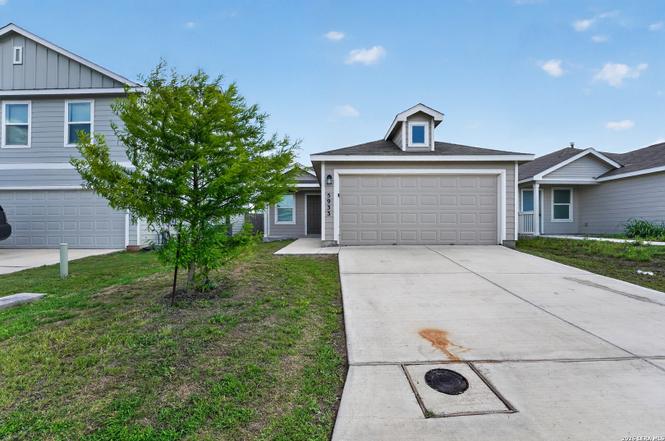
5933 Antonio Pl · Geronimo, TX
Flood risk 1/10 · Minimal
- FEMA flood zone
- X (unshaded)
- Chance of flooding over 30 yrs
- 0.0%
- Est. flood insurance / yr
- $507 – $1,088
Fire risk 3/10 · Minor
- Est. fire insurance / yr
- $1,222 – $2,270
Heat risk 8/10 · Major
- Hot days now (above 108°F)
- 7 days/yr
- Hot days in 30 yrs
- 22 days/yr
Wind risk 8/10 · Major
- Chance of severe wind over 30 yrs
- 80.0%
Air-quality risk 1/10 · Minimal
- Unhealthy air days now
- 0 days/yr
- Unhealthy air days in 30 yrs
- 0 days/yr
Risk factors via First Street. Map © Google.
Why this score? — see what drove the D grade
The composite is a weighted blend of 9 inputs, each scored 0–100. Each bar is that input's sub-score; the figure is the points it added to the 100-point composite (weight × sub-score).
- Cash flow +11.8/30.0
- ARV discount +9.5/15.0
- 1% rule +4.6/10.0
- Schools +4.3/10.0
- Condition / age +4.0/5.0
- DSCR +3.5/10.0
- Rent growth +3.0/5.0
- Livability +2.6/5.0
- Appreciation +0.0/10.0
$189,900
🖨 Deal sheet (PDF) 📄 Offer letter ✓ Due diligence
Listing remarks
This residential property is located in Seguin, Texas, within a quiet and steadily growing suburban community in Guadalupe County. The area is known for its peaceful atmosphere, modern single-family homes, and well-maintained neighborhoods that offer a comfortable setting for everyday living. Residents benefit from a balance of small-town charm and convenient access to larger nearby cities like San Antonio, making commuting to work, school, or entertainment relatively easy via major roadways. The surrounding area includes essential amenities such as grocery stores, schools, dining options, and local services within a short drive. Outdoor recreation is also a strong feature of the region, wi
Key facts
- Essential amenities
- Outdoor recreation
- Convenient access
Tags
Property features AI
Finance
- Other: Possession at closing/funding; For sale
- HOA & community: Mandatory HOA with $50 monthly fee; Association transfer fee of $250; Subdivision: Navarro Ranch; Community amenities: Other (see remarks)
Exterior
- Parking: Attached 2-car garage
- Utilities: Water system; Sewer system
- Home design: Pre-owned single-family home; Approximately 4 years old
- Construction: Cement fiber exterior; Composition roof; Slab foundation
- Exterior features: Privacy fence
Interior
- Kitchen: Stove/Range; Refrigerator; Dishwasher
- Bedrooms: Master bedroom with walk-in closet; Bedroom 2; Bedroom 3
- Flooring: Vinyl flooring
- Bathrooms: Two full bathrooms; Master bath with tub/shower combination
- Heating & cooling: Central heating (electric); Central air conditioning
- Interior features: Open floor plan with high ceilings; Living/dining room combination; Eat-in kitchen with walk-in pantry; Ground level / no steps; Laundry room; Some window coverings remain
- Laundry & utility: Laundry room
Neighborhood map
What this means for you Summary
Snapshot
- This is a 4-bed/2.5-bath single-family listed at $190k. Condition is rated good.
Deal economics
- At list price, monthly cash flow is $-53 ($-637/yr) — negative.
- To cash-flow at today's rent, offer at most $181k (4.9% below list).
- To meet the 1% rule (rent ≥ 1% of price), the offer needs to be $183k (3.6% below list).
- Recommended offer: $181k (4.9% below list) — sets the bar for cash-flow.
- Cap rate 6.0% vs local median 4.7% in Geronimo — meaningfully above typical; check what's discounted (condition, days-on-market, listing class) to confirm the premium yield is real.
Location & tenants
- Location reads 51/100 on livability (#1,471 in TX) — a working-class tenant base; expect higher turnover. Strengths: cost of living A+, housing A+, crime A; Watch: amenities F, commute F, employment F.
- Navarro ISD (rural): math 48% / reading 50% proficiency, ranked #166 of 826 in TX (top 20%) — families likely to look elsewhere, expect single-tenant / working-renter base with shorter leases.
- Zoned schools: Navarro El (math 37% / reading 57%, grade D-, #1,006 of 4,322 statewide, top 25%, 702 students, 45% FRL); Navarro Int (math 50% / reading 44%, grade D+, #424 of 1,662 statewide, top 27%, 485 students, 40% FRL); Navarro H S (math 47% / reading 57%, grade D+, #447 of 1,632 statewide, top 29%, 648 students, 33% FRL) — zoned schools at 39% FRL track the district average.
- Market conditions: Rents rising (+2.0%/yr); 1377 active listings in the ZIP; 8 comparable units currently listed for rent nearby; rentals leasing fast (median 1d on market — plan ~1-2 weeks tenant-placement turnaround); 2,064 units permitted in Guadalupe County in 2024 (133 in 5+ unit buildings).
- This rent runs 31% of the median local income ($71k/yr) — at the standard rent-burdened threshold; future hikes will face affordability resistance.
Forward outlook
- Local home prices are declining (-3.0%/yr); year-one equity from $1k of loan paydown is wiped out by about $6k of value loss. Plan a longer hold.
- Guadalupe County population projected at +61% by 2050 — long-run rental-demand tailwind backs the buy-and-hold thesis.
Negotiation context
- It's been on market 16 days — a 2% lower offer ($187k) is reasonable based on typical stale-listing flexibility.
- 2 sale attempts with the ask held roughly flat each time — persistent listings suggest the price (not the market) is what's stuck; bring a comps-based counter.
Risks & watch-outs
- Climate carrying-cost: severe wind risk, 80% chance of damaging wind over 30y; extreme-heat days projected 7→22/yr by 2055 (HVAC capex compounding) — expect insurance premiums to compound above CPI over the hold.
Questions for the listing agent
- What do current leases actually rent for vs. the listed asking? Can we see a recent rent roll and the last 12 months of T-12 income?
- What does the HOA fee cover, when was the last increase, and are there any pending special assessments or reserve-fund shortfalls?
- Is there a deadline driving the sale (1031 exchange, divorce, estate, relocation)? That informs how much negotiation room exists.
- Schools are F-rated, which usually means shorter tenancies and higher turnover. Who's the typical renter profile here, and what's been the actual vacancy rate?
- The area grade is low — what's the realistic commute time and amenity access for the typical tenant pool here? Any planned neighborhood developments (good or bad) we should know about?
- What's the average days-on-market for RENTAL listings here right now (not sales)? A rising rental-DOM trend means longer vacancies and softer asking-rent achievability than the comps imply.
- What's the recent tenant-quality profile in this submarket — average credit score on applications, eviction rate, late-payment / NSF rate, and stable-employment percentage? A property-management company in the area should have these aggregated.
- How much new for-sale + rental construction is in the pipeline within 1–3 miles? Heavy new supply typically softens prices + rents 12–24 months out; constrained supply supports both.
Investment metrics
- 1% rule
- 0.96% ✗
- Cap rate
- 5.96%
- Cash-on-cash
- -1.20%
- DSCR
- 0.95
- GRM
- 8.6
CMA / ARV
- ARV (on-the-fly)
- $198,720
- Comps found
- 12
Show comp detail 12 sales within ~0.75 mi
| Address | Dist | Beds/Ba | Sqft | Sold | Price | $/sf | Match |
|---|---|---|---|---|---|---|---|
| 163 Pastar Fls | 0.28mi | 4/2.0 | 1,483 (+3%) | 1mo | $184,999 | $125 | 79 |
| 166 Pastar Fls | 0.28mi | 4/2.0 | 1,483 (+3%) | 2mo | $192,999 | $130 | 78 |
| 147 Pastar Fls | 0.31mi | 4/2.0 | 1,483 (+3%) | 1mo | $185,999 | $125 | 78 |
| 150 Pastar Fls | 0.31mi | 4/2.0 | 1,483 (+3%) | 1mo | $188,999 | $127 | 78 |
| 125 Pastar Fls | 0.34mi | 4/2.0 | 1,483 (+3%) | 2mo | $193,999 | $131 | 76 |
| 130 Pastar Fls | 0.34mi | 4/2.0 | 1,483 (+3%) | 2mo | $190,999 | $129 | 76 |
| 137 Pastar Fls | 0.32mi | 4/2.0 | 1,483 (+3%) | 3mo | $235,999 | $159 | 76 |
| 117 Pastar Fls | 0.36mi | 4/2.0 | 1,483 (+3%) | 3mo | $240,999 | $163 | 74 |
| 5511 Alope Way | 0.36mi | 3/2.0 (-1) | 1,411 (-2%) | 0mo | $197,999 | $140 | 73 |
| 215 Pastar Fls | 0.22mi | 3/2.0 (-1) | 1,354 (-6%) | 1mo | $186,999 | $138 | 72 |
| 5515 Alope Way | 0.36mi | 3/2.0 (-1) | 1,266 (-12%) | 0mo | $189,999 | $150 | 56 |
| 8952 Gila Rdg | 0.53mi | 3/2.0 (-1) | 1,634 (+14%) | 3mo | $235,999 | $144 | 44 |
Match score weights: distance 35% · size 25% · config 20% · recency 20%. Top-matched comps best support the ARV.
Projected returns pro-forma
-3.0% appreciation · 2.04% rent growth · sell at horizon
- IRR
- -19.4%
- Equity multiple
- 0.33×
- Total profit
- $-35,763
- Equity at exit
- $28,315
- IRR
- -14.4%
- Equity multiple
- 0.21×
- Total profit
- $-41,967
- Equity at exit
- $16,419
Cash invested: $53,172 (down + closing). Projections, not guarantees.
Landlord ↔ Tenant lean methodology
- Overall (STATE)
- 87 Strongly Landlord-Friendly
- State Texas
- 87 Strongly Landlord-Friendly · R+5
- County
- — inherits STATE
- City
- — inherits STATE
ZIP-level market 78155
- Rents YoY
- 2.0%
- Active inventory
- 1377
- Price-to-rent
- 8.6×
Monthly cashflow live
- Estimated rent
- $1,830 high interval (Pro) →
- Mortgage (P&I)
- −$996
- Tax from tax record
- −$374 /mo · $4,490/yr
- Insurance
- −$79
- HOA
- −$50
- Vacancy / Maint / Mgmt
- −$384
- Net cashflow
- $-53
Break-even live
Sensitivity live
| Price | -10% $54 | -5% $1 | +0% $-53 | +5% $-107 | +10% $-161 |
|---|---|---|---|---|---|
| Rent | -10% $-198 | -5% $-125 | +0% $-53 | +5% $19 | +10% $92 |
| Rate | -1.0pp $43 | -0.5pp $-5 | base $-53 | +0.5pp $-102 | +1.0pp $-152 |
UW: 25.0% down · 7.5% · 30yr · 1.5% tax · 5.0% vac · 8.0% maint · 8.0% mgmt
Financing live
Cash to close
- Down payment
- $47,475
- Closing costs
- $5,697
- Reserves months
- —
- Total cash needed
- —
Loan-product check · same deal, 3 products live
Conventional
25% down · 7.5% · 30yr
- Down + closing
- —
- Monthly P&I
- —
- Monthly cashflow
- —
- DSCR
- —
- Eligible?
- —
Personal DTI + credit; lowest rate.
DSCR
20% down · 8.5% · 30yr
- Down + closing
- —
- Monthly P&I
- —
- Monthly cashflow
- —
- DSCR
- —
- Eligible?
- —
No personal income docs; deal must DSCR.
Hard money
10% down · 12.0% · 12mo
- Down + closing
- —
- Monthly P&I
- —
- Monthly cashflow
- —
- DSCR
- —
- Eligible?
- —
Short-term bridge; refi at stabilization.
Rent comps 8 comps
| Address | Beds | Baths | Sqft | Rent | $/sqft | DOM | Units | Dist |
|---|---|---|---|---|---|---|---|---|
| 5863 Coahulia Rdg Seguin, TX | 3.0 | 2.0 | 1440 | $1,675 | $1.16 | 45d | 1 | 0.08mi |
| 5863 Coahulia Rdg Seguin, TX | 3.0 | 2.0 | 1266 | $1,550 | $1.22 | 0d | 1 | 0.08mi |
| 5812 San Geronimo Seguin, TX | 4.0 | 2.0 | 1627 | $1,700 | $1.04 | 0d | 1 | 0.14mi |
| 9268 James Bowie Seguin, TX | 4.0 | 2.0 | 1627 | $1,575 | $0.97 | 4d | 1 | 0.27mi |
| 9272 James Bowie Seguin, TX | 3.0 | 2.0 | 1440 | $1,450 | $1.01 | 0d | 1 | 0.27mi |
| 217 Alligator Crk Seguin, TX | 3.0 | 2.0 | 1380 | $1,750 | $1.27 | 45d | 1 | 0.29mi |
| 9211 Saint Jerome Seguin, TX | 3.0 | 2.0 | 1440 | $1,500 | $1.04 | 0d | 1 | 0.38mi |
| 964 Pastar Crk Seguin, TX | 4.0 | 2.0 | 1483 | $1,745 | $1.18 | 0d | 1 | 0.41mi |
HOA detail
- Monthly dues
- $50 · $600/yr
Listing history 11 events
-
2026-06-21days on market $189,900 Active 16 DOM
-
2026-06-18days on market $189,900 Active 13 DOM
-
2026-06-17days on market $189,900 Active 12 DOM
-
2026-06-16statusdays on market $189,900 Active 11 DOM
-
2026-06-15days on market $189,900 New 10 DOM
-
2026-06-13days on market $189,900 New 8 DOM
-
2026-06-13days on market $189,900 New 7 DOM
-
2026-06-09days on market $189,900 New 4 DOM
-
2026-06-08days on market $189,900 New 3 DOM
-
2026-06-07remarks 699-char remark
-
2026-06-07$189,900 New 2 DOM
ⓘ Source: listings_history table (triggers on properties + properties_extension) + one-shot
backfill from property_details.listing_events for pre-trigger history.
Tax reassessment forecast TX · Resets to sale price
- Current annual tax
- $4,490 · $374/mo
- Projected year-2 tax
- $4,490 · $374/mo
- Expected delta
- $0/yr ($0/mo · 0.0%)
ⓘ Screening estimate from a state-policy table — verify with the county assessor before closing.
Climate risk First Street
- Flood 1/10 Low FEMA zone X (unshaded) · 0% chance over 30 yrs
- Wildfire 3/10 Moderate
- Heat 8/10 Severe 7 d/yr ≥108°F today · 22 d/yr by 30 yrs out
- Wind 8/10 Severe 80% chance of damaging wind over 30 yrs
- Air quality 1/10 Low 0 unhealthy d/yr today · 0 by 30 yrs out
Nearby sold comps map
Loading sold comps map…
Walkable amenities ~0.75 mi
Loading nearby amenities…
Taxation est. · year 1
- Rental income
- $21,965
- − Mortgage interest
- −$10,637
- − Property taxes
- −$4,490
- − Insurance
- −$950
- − Repairs & maintenance
- −$1,757
- − Management
- −$1,757
- − HOA
- −$600
- − Depreciation
- −$5,524
- Taxable loss
- −$3,750
- Est. tax savings @ 24.0%
- +$900
- After-tax cash flow
- $263/yr
For passive investors: Depreciation is non-cash, so a rental often shows a tax loss while cash-flowing — sheltering income. Rental losses are passive: they offset passive income freely, and up to $25,000/yr can offset ordinary (W-2) income if you actively participate and your MAGI is under $100k (phasing out to $0 by $150k); unused losses carry forward. On sale, claimed depreciation is recaptured at up to 25%, and gains may owe capital-gains tax (a 1031 exchange can defer both). Figures are a year-1 estimate at your 24.0% rate — not tax advice; consult a CPA.
Condition & rehab AI · 6 photos
This single-family home in Seguin, Texas, is in good condition with a good exterior and interior. It has a good foundation and structure, and the HVAC system appears to be in good condition. The home has a good roof and flooring, and the interior walls and paint are in good condition. The home has a good curb appeal with a small tree in front of the house. The home is in need of some landscaping improvements and painting to enhance its curb appeal and interior aesthetics. The home is move-in ready and has a good resale and rental value.
Value-add opportunities
- Both Painting exterior and interior walls — Fresh paint can enhance curb appeal and interior aesthetics.
- Both Landscaping improvements — A well-maintained yard can increase both resale and rental value.
- Both HVAC maintenance — A clean and efficient HVAC system can improve comfort and energy efficiency, attracting more buyers/renters.
- Both Window treatments — Adding curtains or blinds can enhance the home's curb appeal and interior aesthetics.
- Both Flooring maintenance — Regular cleaning and maintenance can keep the flooring looking new and attractive.
- Both Lighting improvements — Upgrading lighting fixtures can improve the home's curb appeal and interior aesthetics.
- Both Landscaping improvements — A well-maintained yard can increase both resale and rental value.
Renovation cost estimate screening
Value-add ROI direction
- Both Painting exterior and interior walls — Fresh paint can enhance curb appeal and interior aesthetics. ↑
- Both Landscaping improvements — A well-maintained yard can increase both resale and rental value. ↑
- Both HVAC maintenance — A clean and efficient HVAC system can improve comfort and energy efficiency, attracting more buyers/renters. ↑
- Both Window treatments — Adding curtains or blinds can enhance the home's curb appeal and interior aesthetics. ↑
- Both Flooring maintenance — Regular cleaning and maintenance can keep the flooring looking new and attractive. ↑
- Both Lighting improvements — Upgrading lighting fixtures can improve the home's curb appeal and interior aesthetics. ↑
- Both Landscaping improvements — A well-maintained yard can increase both resale and rental value. ↑
ⓘ Cost ranges are severity-bucket heuristics (US national rule-of-thumb). Get contractor quotes + a written scope before underwriting a rehab budget.
Schools (NCES district)
- District
- Navarro ISD
- NCES district ID
- 4832160
- Math proficiency
- 48% ▼ -19.00%
- Reading proficiency
- 50% ▼ -6.00%
- Median HH income
- $66,008
- Composite
- 43.49/100
- National rank
- #2996
- State rank
- #166 of 826 in TX
Livability — Geronimo
- Score
- 51/100
- State rank
- #1471
- US rank
- #25174
Category grades
Schools grade is shown separately in the Schools card above.
Census & demographics
- Census place
- Geronimo, TX
- County
- Guadalupe County · 147,291 people
- Metro
- San Antonio-New Braunfels, TX
- Population (ZIP)
- 55,600
- Household income
- $71,039
- Rent vs Own
- Severe rent burden
- 1053.0
Population outlook (Guadalupe County) Hauer SSP2
- Today (2025)
- 196,854 people
- By 2030
- 220,210 · +11.9%
- By 2040
- 268,004 · +36.1%
- By 2050
- 316,333 · +60.7%
- By 2075
- 434,747 · +120.8%
- By 2100
- 520,447 · +164.4%
Race, ethnicity, and origin ACS 2023
- Neighborhood character
- Diverse neighborhood (Simpson 0.58)
- Race & ethnicity
- Hispanic / Latino 49% White 43% Two or more races 26% Black 5%
- Hispanic origin (detail)
- Mexican 41%
- Common ancestry
- Lithuanian 2% Slovak 1% Romanian 1%
- Foreign-born
- 8% · Canada
- Languages at home
- 74% English-only · Spanish 24% German/W. Germanic 1%
Political lean MEDSL · Guadalupe
- 2024 margin
- Strong R (+29.5) · D 34.8% · R 64.3%
- 2008→2024 swing
- +1.5pp toward D · 2008: -31.0pp · 2024: -29.5pp
- All cycles
- 2024: R+29.5 2020: R+24.2 2016: R+31.8 2012: R+35.1 2008: R+31.0
Not yet ingested
- Civics
- —
Market trends
- HPI YoY
- ▼ -147.43%
- Current HPI
- 160.5435
- Rent YoY
- ▲ 2.04%
- Metro
- San Antonio-New Braunfels, TX
- State GDP YoY
- ▲ 3.95%
- F500 in state
- 110
Industry mix (Fortune 500 HQ in TX)
| Industry | F500 HQs | Revenue |
|---|---|---|
| Energy | 16 | $1,198B |
|
||
| Technology | 5 | $198B |
|
||
| Engineering / Construction | 4 | $72B |
|
||
| Energy Services | 3 | $60B |
|
||
| Utilities | 3 | $41B |
|
||
| Healthcare | 2 | $330B |
|
||
Price history
+10598.6% since first listed8 events — show timeline
- 2026-06-05 Listed $189,900 LERA
- 2026-02-28 Rental Removed $1,575 HARMLS
- 2026-01-31 Price Changed $1,575 HARMLS
- 2025-12-18 Listed for Rent $1,660 HARMLS
- 2023-10-17 Rental Removed $1,685 RENT.
- 2023-09-20 Price Changed $1,685 RENT.
- 2023-09-01 Price Changed $1,720 RENT.
- 2023-08-15 Price Changed $1,775 RENT.
Property tax history
+92.4%/yrLatest (2026): $4,490 · -3.4% YoY. Source: county tax records.
Cash-flow waterfall
monthlySold comps — $/sqft
last 12 mo · ≤1 miLoading sold comps…