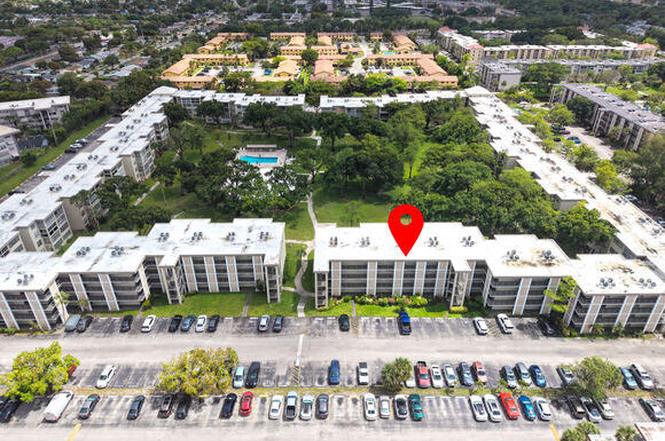
2998 NW 48th Ter #434 · Lauderdale Lakes, FL
Flood risk 1/10 · Minimal
- FEMA flood zone
- X (shaded)
- Chance of flooding over 30 yrs
- 0.0%
- Est. flood insurance / yr
- $507 – $1,088
Fire risk 1/10 · Minimal
- Est. fire insurance / yr
- $947 – $1,759
Heat risk 10/10 · Severe
- Hot days now (above 105°F)
- 7 days/yr
- Hot days in 30 yrs
- 26 days/yr
Wind risk 10/10 · Severe
- Chance of severe wind over 30 yrs
- 99.0%
Air-quality risk 3/10 · Minor
- Unhealthy air days now
- 3 days/yr
- Unhealthy air days in 30 yrs
- 3 days/yr
Risk factors via First Street. Map © Google.
Why this score? — see what drove the C- grade
The composite is a weighted blend of 9 inputs, each scored 0–100. Each bar is that input's sub-score; the figure is the points it added to the 100-point composite (weight × sub-score).
- Cash flow +15.3/30.0
- 1% rule +10.0/10.0
- ARV discount +7.5/15.0
- DSCR +4.7/10.0
- Schools +4.1/10.0
- Livability +4.0/5.0
- Rent growth +2.6/5.0
- Condition / age +2.5/5.0
- Appreciation +0.0/10.0
$102,000
🖨 Deal sheet 📄 Offer letter ✓ Due diligence
Listing remarks
Beautiful and well maintained 2 bedroom and 2 bath condo located in desirable 55+ community in sunny Lauderdale Lakes. Upgraded unit with new laminate floors throughout, eat-in kitchen, formal dining and living room. Furniture is also included in the sale making this beautiful condo truly move in ready. Unit features central air system and enclosed serine tiled patio/Florida Room overlooking clubhouse, pool and garden area. Unit is conveniently located near restaurants, major shops, I-95, FL turnpike, and hospitals. Only 20 minutes from beach! Cypress Chase Condo A is equipped with heated community pool, shuffleboard, hot tub, sauna, picnic/BBQ area. Great Club House and security cameras th
Key facts
- Enclosed tiled patio
- Hot tub
- Sauna
Tags
Property features AI
Finance
- Other: Directions: I-95 exit Oakland Park Blvd west; complex on the left at 48th Ave; quick right to 48th Ter — unit at west end; park in guest parking.
- HOA & community: Has association; Monthly HOA fee (approx.) $530; HOA covers structure maintenance; Association amenities include billiard room, clubhouse, picnic area, pool, spa/hot tub, storage, community room, and maintenance; Senior community
Exterior
- Parking: Guest parking
- Security: Other security features
- Utilities: Cable not available
- Home design: Condominium; 4-story building; Resale, updated/remodeled condition; Not waterfront
- Construction: CBS construction
- Exterior features: Screened porch
Interior
- Kitchen: Disposal; Dishwasher; Electric range; Microwave; Refrigerator
- Bedrooms: 4 bedrooms on the main level
- Flooring: Laminate
- Bathrooms: 2 full bathrooms
- Heating & cooling: Heat strip heating; Central air conditioning
- Interior features: Walk-in closet(s); Blinds
- Laundry & utility: Furnished: Negotiable
Neighborhood map
What this means for you Summary
Snapshot
- This is a 2-bed/2.0-bath condo listed at $102k.
Deal economics
- At list price, monthly cash flow is $37 ($447/yr) — positive.
- The deal already cash-flows at list — no discount required.
- Meets the 1% rule at list price ($2k rent vs $102k).
- Recommended offer: $93k (9.0% below list) — sets the bar for market timing.
Location & tenants
- Location reads 81/100 on livability (#100 in FL, #1,527 nationally) — a professional / high-income tenant draw. Strengths: commute A+, cost of living A+, housing A+; Watch: schools C-, crime D+, amenities F.
- Broward (suburban): math 42% / reading 53% proficiency, ranked #46 of 73 in FL (top 63%) — families likely to look elsewhere, expect single-tenant / working-renter base with shorter leases.
- Market conditions: Rents flat; 656 active listings in the ZIP; 40 comparable units currently listed for rent nearby; rentals at typical pace (median 24d on market — plan ~3-4 weeks tenant-placement turnaround); 2,111 units permitted in Broward County in 2024 (1,265 in 5+ unit buildings).
- This rent runs 45% of the median local income ($46k/yr) — at the standard rent-burdened threshold; future hikes will face affordability resistance.
Forward outlook
- Local home prices are declining (-3.0%/yr); year-one equity from $705 of loan paydown is wiped out by about $3k of value loss. Plan a longer hold.
- Broward County population projected at +34% by 2050 — long-run rental-demand tailwind backs the buy-and-hold thesis.
Negotiation context
- It's been on market 97 days — a 9% lower offer ($93k) is reasonable based on typical stale-listing flexibility.
- 2 sale attempts; this cycle's ask has dropped $7k (6%) from the opening price — seller is motivated, your offer sets the floor, not the list.
- Current owner paid $26k; list at $102k implies a 300% gain — meaningful room to come down on a strong offer.
Risks & watch-outs
- Watch-outs: property tax is 2.6% of price; HOA is 31% of rent.
- Climate carrying-cost: severe wind risk, 99% chance of damaging wind over 30y; extreme-heat days projected 7→26/yr by 2055 (HVAC capex compounding) — expect insurance premiums to compound above CPI over the hold.
Questions for the listing agent
- It's been on market 97 days. Have you received any prior offers? Is the seller open to a 9% concession, seller financing, or rate buy-down credit?
- Built in 1973 — when were the roof, HVAC, electrical panel, plumbing, and water heater last replaced?
- Property tax is high relative to price — has the assessment been appealed recently, and will the sale trigger a re-assessment?
- What does the HOA fee cover, when was the last increase, and are there any pending special assessments or reserve-fund shortfalls?
- Any open or pending special assessments — roof, HVAC, plumbing, elevator, façade? What's the per-unit balance and payoff schedule, and is the seller paying it off at close or rolling it to the buyer?
- Why hasn't it sold? Are there any deal-killer items the seller is aware of (foundation, flood, title, zoning, code violations)?
- Is there a deadline driving the sale (1031 exchange, divorce, estate, relocation)? That informs how much negotiation room exists.
- Crime grade is D in this area — have there been break-ins, vandalism, or insurance claims at this property in the last 3 years? What carrier currently insures it and at what premium?
- What's the average days-on-market for RENTAL listings here right now (not sales)? A rising rental-DOM trend means longer vacancies and softer asking-rent achievability than the comps imply.
- What's the recent tenant-quality profile in this submarket — average credit score on applications, eviction rate, late-payment / NSF rate, and stable-employment percentage? A property-management company in the area should have these aggregated.
- How much new apartment / multifamily construction is in the pipeline within 1–3 miles? Heavy new supply (>2% of stock underway) typically softens rents 12–24 months out; light construction supports rent growth.
Investment metrics
- 1% rule
- 1.69% ✓
- Cap rate
- 6.73%
- Cash-on-cash
- 1.57%
- DSCR
- 1.07
- GRM
- 4.9
CMA / ARV
No comps found within radius.
Projected returns pro-forma
-3.0% appreciation · 0.26% rent growth · sell at horizon
- IRR
- -19.2%
- Equity multiple
- 0.36×
- Total profit
- $-18,385
- Equity at exit
- $15,209
- IRR
- -29.5%
- Equity multiple
- -0.03×
- Total profit
- $-29,310
- Equity at exit
- $8,819
Cash invested: $28,560 (down + closing). Projections, not guarantees.
Landlord ↔ Tenant lean methodology
- Overall (STATE)
- 87 Strongly Landlord-Friendly
- State Florida
- 87 Strongly Landlord-Friendly · R+3
- County
- — inherits STATE
- City
- — inherits STATE
ZIP-level market 33313
- Rents YoY
- 0.3%
- Active inventory
- 656
- Price-to-rent
- 4.9×
Monthly cashflow live
- Estimated rent
- $1,729 high interval (Pro) →
- Mortgage (P&I)
- −$535
- Tax from tax record
- −$221 /mo · $2,651/yr
- Insurance
- −$42
- HOA
- −$530
- Vacancy / Maint / Mgmt
- −$363
- Net cashflow
- $37
Break-even live
UW: 25.0% down · 7.5% · 30yr · 1.5% tax · 5.0% vac · 8.0% maint · 8.0% mgmt
Financing live
Cash to close
- Down payment
- $25,500
- Closing costs
- $3,060
- Reserves months
- —
- Total cash needed
- —
Loan-product check · same deal, 3 products live
Conventional
25% down · 7.5% · 30yr
- Down + closing
- —
- Monthly P&I
- —
- Monthly cashflow
- —
- DSCR
- —
- Eligible?
- —
Personal DTI + credit; lowest rate.
DSCR
20% down · 8.5% · 30yr
- Down + closing
- —
- Monthly P&I
- —
- Monthly cashflow
- —
- DSCR
- —
- Eligible?
- —
No personal income docs; deal must DSCR.
Hard money
10% down · 12.0% · 12mo
- Down + closing
- —
- Monthly P&I
- —
- Monthly cashflow
- —
- DSCR
- —
- Eligible?
- —
Short-term bridge; refi at stabilization.
Rent comps 40 comps
| Address | Beds | Baths | Sqft | Rent | $/sqft | DOM | Units | Dist |
|---|---|---|---|---|---|---|---|---|
| 3070 NW 48th Ter #104 Lauderdale Lakes, FL | 2.0 | 2.0 | 960 | $1,750 | $1.82 | 24d | 1 | 0.07mi |
| 3070 NW 48th Ter Lauderdale Lakes, FL | 2.0 | 2.0 | 960 | $1,750 | $1.82 | 7d | 2 | 0.07mi |
| 3070 NW 48th Ter #405 Lauderdale Lakes, FL | 2.0 | 2.0 | 960 | $1,850 | $1.93 | 2d | 1 | 0.07mi |
| 3001 NW 48th Ave #440 Lauderdale Lakes, FL | 1.0 | 1.5 | 705 | $1,300 | $1.84 | 24d | 1 | 0.10mi |
| 3099 NW 48th Ave #153 Lauderdale Lakes, FL | 2.0 | 2.0 | 960 | $1,850 | $1.93 | 24d | 1 | 0.14mi |
| 3061 NW 47th Ter Unit 132C Lauderdale Lakes, FL | 1.0 | 1.0 | 610 | $1,500 | $2.46 | 24d | 1 | 0.14mi |
| 3061 NW 47th Ter Unit 327B Lauderdale Lakes, FL | 1.0 | 1.5 | 662 | $1,600 | $2.42 | 7d | 1 | 0.14mi |
| 3061 NW 47th Ter #327 Lauderdale Lakes, FL | 1.0 | 1.5 | 662 | $1,500 | $2.27 | 24d | 1 | 0.14mi |
| 2901 NW 47th Ter Unit 247B Lauderdale Lakes, FL | 1.0 | 1.5 | 662 | $1,450 | $2.19 | 24d | 1 | 0.14mi |
| 2901 NW 47th Ter Unit 348B Lauderdale Lakes, FL | 1.0 | 1.5 | 662 | $1,350 | $2.04 | 24d | 1 | 0.14mi |
| 2861 NW 47th Ter Unit 207B Lauderdale Lakes, FL | 1.0 | 1.0 | 768 | $1,400 | $1.82 | 24d | 1 | 0.18mi |
| 2861 NW 47th Ter Lauderdale Lakes, FL | 2.0 | 2.0 | 1021 | $1,700 | $1.67 | 24d | 1 | 0.18mi |
| 4851 NW 26th Ct #338 Lauderdale Lakes, FL | 1.0 | 1.0 | 705 | $1,650 | $2.34 | 16d | 1 | 0.19mi |
| 3141 NW 47th Ter Lauderdale Lakes, FL | 1.0–2.0 | 1.5–2.0 | 861 | $1,700 | $1.97 | 24d | 2 | 0.19mi |
| 3141 NW 47th Ter #430 Lauderdale Lakes, FL | 2.0 | 2.0 | 1002 | $1,700 | $1.70 | 21d | 1 | 0.19mi |
| 3161 NW 47th Ter #111 Lauderdale Lakes, FL | 1.0 | 1.5 | 721 | $1,500 | $2.08 | 24d | 1 | 0.19mi |
| 3161 NW 47th Ter #110 Lauderdale Lakes, FL | 1.0 | 1.5 | 721 | $1,500 | $2.08 | 5d | 1 | 0.19mi |
| 5021 W Oakland Park Blvd Lauderdale Lakes, FL | 1.0 | 1.0 | 684 | $1,550 | $2.27 | 17d | 2 | 0.20mi |
| 2800 NW 47th Ter Unit 106B Lauderdale Lakes, FL | 1.0 | 1.0 | 768 | $1,650 | $2.15 | 24d | 1 | 0.23mi |
| 5111 W Oakland Park Blvd #301 Lauderdale Lakes, FL | 2.0 | 2.0 | 944 | $1,700 | $1.80 | 5d | 1 | 0.26mi |
| 5031 W Oakland Park Blvd Lauderdale Lakes, FL | 1.0 | 1.0 | 683 | $1,400 | $2.05 | 10d | 2 | 0.27mi |
| 3341 NW 47th Ter #301 Lauderdale Lakes, FL | 2.0 | 2.0 | 1002 | $2,050 | $2.05 | 2d | 1 | 0.31mi |
| 2916 NW 55th Ave Unit 2A Lauderhill, FL | 2.0 | 2.0 | 1060 | $2,200 | $2.08 | 7d | 1 | 0.34mi |
| 3301 NW 47th Ter #308 Lauderdale Lakes, FL | 1.0 | 2.0 | 750 | $2,200 | $2.93 | 11d | 1 | 0.34mi |
| 2914 NW 55th Ave Unit 1D Lauderhill, FL | 1.0 | 1.5 | 840 | $1,600 | $1.90 | 17d | 1 | 0.35mi |
| 2914 NW 55th Ave Lauderhill, FL | 1.0 | 2.0 | 840 | $1,600 | $1.90 | 12d | 1 | 0.35mi |
| 5051 W Oakland Park Blvd #204 Lauderdale Lakes, FL | 2.0 | 2.0 | 944 | $1,900 | $2.01 | 24d | 1 | 0.36mi |
| 2606 NW 52nd Ave Unit D15 Lauderhill, FL | 2.0 | 1.5 | 1020 | $1,950 | $1.91 | 24d | 1 | 0.38mi |
| 2604 NW 52nd Ave Unit C15 Lauderhill, FL | 2.0 | 1.5 | 940 | $1,800 | $1.91 | 24d | 1 | 0.39mi |
| 5151 W Oakland Park Blvd #303 Lauderdale Lakes, FL | 2.0 | 2.0 | 944 | $1,850 | $1.96 | 24d | 1 | 0.39mi |
| 5223 NW 27th St Unit 9B Fort Lauderdale, FL | 2.0 | 1.5 | 940 | $1,750 | $1.86 | 24d | 1 | 0.40mi |
| 5231 NW 27th St Unit 8A Lauderhill, FL | 2.0 | 1.5 | 1020 | $1,900 | $1.86 | 24d | 1 | 0.41mi |
| 2552 NW 52nd Ave Unit B19 Lauderhill, FL | 2.0 | 1.5 | 940 | $1,900 | $2.02 | 3d | 1 | 0.41mi |
| 2982 NW 55th Ave Unit 2C Lauderhill, FL | 1.0 | 1.5 | 840 | $1,600 | $1.90 | 24d | 1 | 0.44mi |
| 3460 NW 50th Ave Lauderdale Lakes, FL | 1.0–2.0 | 1.0–2.0 | 750 | $2,150 | $2.87 | 16d | 3 | 0.44mi |
| 2512 NW 52nd Ave Unit 22B Lauderhill, FL | 2.0 | 1.5 | 940 | $1,700 | $1.81 | 17d | 1 | 0.44mi |
| 2810 NW 55th Ave Unit 2A Lauderhill, FL | 2.0 | 2.0 | 1060 | $2,000 | $1.89 | 7d | 1 | 0.46mi |
| 4848 NW 24th Ct Lauderdale Lakes, FL | 1.0–3.0 | 1.0–2.0 | 1045 | $1,725 | $1.65 | 16d | 3 | 0.46mi |
| 4848 NW 24th Ct Lauderdale Lakes, FL | 1.0–3.0 | 1.0–2.0 | 1045 | $1,675 | $1.60 | 5d | 4 | 0.46mi |
| 2814 NW 55th Ave Unit 1B Lauderhill, FL | 2.0 | 2.0 | 1070 | $1,800 | $1.68 | 24d | 1 | 0.46mi |
HOA detail condo
- Monthly dues
- $530 · $6,360/yr
- Likely covers
- poolsecurity
- Assessments
- None detected in remarks — confirm with the listing agent.
Listing history 19 events
-
2026-06-18days on market $102,000 Active 97 DOM
-
2026-06-17days on market $102,000 Active 96 DOM
-
2026-06-16days on market $102,000 Active 95 DOM
-
2026-06-15days on market $102,000 Active 94 DOM
-
2026-06-13days on market $102,000 Active 92 DOM
-
2026-06-09days on market $102,000 Active 88 DOM
-
2026-06-08days on market $102,000 Active 87 DOM
-
2026-06-07days on market $102,000 Active 86 DOM
-
2026-06-04days on market $102,000 Active 83 DOM
-
2026-06-03days on market $102,000 Active 82 DOM
-
2026-06-02days on market $102,000 Active 81 DOM
-
2026-06-01days on market $102,000 Active 80 DOM
-
2026-05-31days on market $102,000 Active 79 DOM
-
2026-05-07price $102,000
-
2026-03-21status Active
-
2026-03-19historical
-
2025-12-19$109,000 Active
-
1996-06-26soldstatus $25,500
-
1983-09-01soldstatus $50,000
ⓘ Source: listings_history table (triggers on properties + properties_extension) + one-shot
backfill from property_details.listing_events for pre-trigger history.
Tax reassessment forecast FL · Resets to sale price
- Current annual tax
- $2,651 · $221/mo
- Projected year-2 tax
- $2,651 · $221/mo
- Expected delta
- $0/yr ($0/mo · 0.0%)
ⓘ Screening estimate from a state-policy table — verify with the county assessor before closing.
Climate risk First Street
- Flood 1/10 Low FEMA zone X (shaded) · 0% chance over 30 yrs
- Wildfire 1/10 Low
- Heat 10/10 Extreme 7 d/yr ≥105°F today · 26 d/yr by 30 yrs out
- Wind 10/10 Extreme 99% chance of damaging wind over 30 yrs
- Air quality 3/10 Moderate 3 unhealthy d/yr today · 3 by 30 yrs out
Nearby sold comps map
Loading sold comps map…
Walkable amenities ~0.75 mi
Loading nearby amenities…
Taxation est. · year 1
- Rental income
- $20,743
- − Mortgage interest
- −$5,714
- − Property taxes
- −$2,651
- − Insurance
- −$510
- − Repairs & maintenance
- −$1,659
- − Management
- −$1,659
- − HOA
- −$6,360
- − Depreciation
- −$2,967
- Taxable loss
- −$778
- Est. tax savings @ 24.0%
- +$187
- After-tax cash flow
- $634/yr
For passive investors: Depreciation is non-cash, so a rental often shows a tax loss while cash-flowing — sheltering income. Rental losses are passive: they offset passive income freely, and up to $25,000/yr can offset ordinary (W-2) income if you actively participate and your MAGI is under $100k (phasing out to $0 by $150k); unused losses carry forward. On sale, claimed depreciation is recaptured at up to 25%, and gains may owe capital-gains tax (a 1031 exchange can defer both). Figures are a year-1 estimate at your 24.0% rate — not tax advice; consult a CPA.
Schools (NCES district)
- District
- Broward
- NCES district ID
- 1200180
- Math proficiency
- 42% ▼ -18.00%
- Reading proficiency
- 53% ▼ -5.00%
- Median HH income
- $52,139
- Composite
- 40.88/100
- National rank
- #3621
- State rank
- #46 of 73 in FL
Livability — Lauderdale Lakes
- Score
- 81/100
- State rank
- #100
- US rank
- #1527
Category grades
Schools grade is shown separately in the Schools card above.
Census & demographics
- Census place
- Lauderdale Lakes, FL
- County
- Broward County · 1,963,430 people
- City population
- 62,807
- Metro
- Miami-Fort Lauderdale-Pompano Beach, FL
- Population (ZIP)
- 62,807
- Household income
- $46,305
- Rent vs Own
- Severe rent burden
- 5692.0
Population outlook (Broward County) Hauer SSP2
- Today (2025)
- 2,207,033 people
- By 2030
- 2,360,704 · +7.0%
- By 2040
- 2,661,208 · +20.6%
- By 2050
- 2,946,698 · +33.5%
- By 2075
- 3,602,273 · +63.2%
- By 2100
- 3,970,984 · +79.9%
Race, ethnicity, and origin ACS 2023
- Neighborhood character
- Predominantly Black (77%)
- Race & ethnicity
- Black 77% Hispanic / Latino 12% Two or more races 8% White 7% Asian 2%
- Hispanic origin (detail)
- Puerto Rican 2% Cuban 3% Dominican 1%
- Common ancestry
- Hispanic 20%
- Foreign-born
- 39% · Canada, Jamaica, Dominican Republic
- Languages at home
- 66% English-only · French/Haitian/Cajun 22% Spanish 10%
Political lean MEDSL · Broward
- 2024 margin
- D (+17.0) · D 58.0% · R 41.0%
- 2008→2024 swing
- -17.8pp toward R · 2008: 34.7pp · 2024: 17.0pp
- All cycles
- 2024: D+17.0 2020: D+29.8 2016: D+35.0 2012: D+34.9 2008: D+34.7
Not yet ingested
- Civics
- —
Market trends
- HPI YoY
- ▼ -338.15%
- Current HPI
- 288.9345
- Rent YoY
- ▲ 0.26%
- Metro
- Miami-Fort Lauderdale-Pompano Beach, FL
- State GDP YoY
- ▲ 3.28%
- F500 in state
- 36
Industry mix (Fortune 500 HQ in FL)
| Industry | F500 HQs | Revenue |
|---|---|---|
| Industrial Technology | 2 | $29B |
|
||
| Insurance | 2 | $17B |
|
||
| Retail | 1 | $60B |
|
||
| Technology Distribution | 1 | $58B |
|
||
| Homebuilding | 1 | $35B |
|
||
| Technology Manufacturing | 1 | $35B |
|
||
Price history
+104.0% since first listed6 events — show timeline
- 2026-05-07 Price Changed $102,000 Beaches MLS
- 2026-03-21 Relisted — Beaches MLS
- 2026-03-19 Listing Removed — Beaches MLS
- 2025-12-19 Listed $109,000 Beaches MLS
- 1996-06-26 Sold (Public Records) $25,500 Public Records
- 1983-09-01 Sold (Public Records) $50,000 Public Records
Property tax history
+6.8%/yrLatest (2025): $2,651 · +6.2% YoY. Source: county tax records.
Cash-flow waterfall
monthlySold comps — $/sqft
last 12 mo · ≤1 miLoading sold comps…