 Multi-family
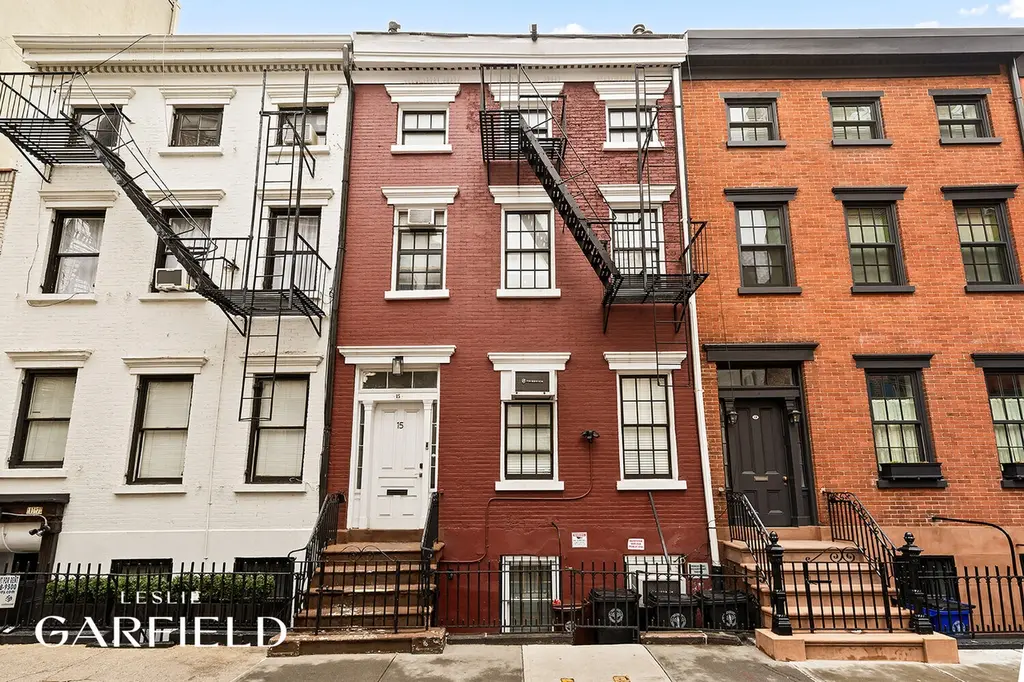
15 Gay St · New York, NY
Flood risk 6/10 · Moderate
- FEMA flood zone
- X (unshaded)
- Chance of flooding over 30 yrs
- 0.75%
- Est. flood insurance / yr
- $507 – $1,088
Fire risk 1/10 · Minimal
- Est. fire insurance / yr
- $691 – $1,283
Heat risk 7/10 · Major
- Hot days now (above 99°F)
- 7 days/yr
- Hot days in 30 yrs
- 15 days/yr
Wind risk 6/10 · Moderate
- Chance of severe wind over 30 yrs
- 27.0%
Air-quality risk 4/10 · Minor
- Unhealthy air days now
- 5 days/yr
- Unhealthy air days in 30 yrs
- 7 days/yr
Risk factors via First Street. Map © Google.
Why this score? — see what drove the C- grade
The composite is a weighted blend of 9 inputs, each scored 0–100. Each bar is that input's sub-score; the figure is the points it added to the 100-point composite (weight × sub-score).
- Cash flow +13.4/30.0
- Appreciation +7.9/10.0
- ARV discount +7.5/15.0
- Schools +5.0/10.0
- Rent growth +4.3/5.0
- DSCR +4.0/10.0
- Livability +3.8/5.0
- 1% rule +2.7/10.0
- Condition / age +2.5/5.0
$4,950,000
🖨 Deal sheet 📄 Offer letter ✓ Due diligence
Multi-family units
County records classify this as Multi-Family (2-4 Unit). Listing-text estimate: 1 unit. estimate disagrees with records
Listing remarks
Step into the storybook charm of 15 Gay Street, a rare Greenwich Village townhouse where timeless architecture meets a rich, bohemian past. Built in 1910, this four story, four-unit walk-up spans approximately 3,344 square feet on a 1,235-square-foot lot. Tucked away on one of Manhattan's shortest and most winding lanes, Gay Street curves gracefully between Christopher Street and Waverly Place - an intimate passage lined with 19th-century elegance. Federal-style brick facades from the 1820s and 1830s greet you on one side, while Greek Revival designs from the mid-1800s stand proudly on the other. Every step along its cobblestones hums with history: once home to Black musicians and Village
Key facts
- 1,235 sq ft lot
- Built 1910
- Listed 35 days
Tags
Property features AI
Finance
- Other: Zoning includes C4-5
- Financial info: Annual taxes reported
Exterior
- Home design: One-story building; Entry at level 1
- Construction: Green building
- Exterior features: Private outdoor space (over 60 sqft); Terrace
Interior
- Bedrooms: Total of 9 rooms (bedroom count not specified)
- Bathrooms: 4 full bathrooms
- Interior features: Smoke-free property; Basement (other)
- Laundry & utility: In-unit laundry
Neighborhood map
What this means for you Summary
Snapshot
- This is a 4-bed/4.0-bath multifamily listed at $4.95M.
Deal economics
- At list price, monthly cash flow is $62 ($742/yr) — positive.
- The deal already cash-flows at list — no discount required.
- To meet the 1% rule (rent ≥ 1% of price), the offer needs to be $3.79M (23.4% below list).
- Recommended offer: $3.79M (23.4% below list) — sets the bar for 1% rule.
- Cap rate 6.3% vs local median 2.6% in New York — top-decile yield for the area; either an underpriced asset or a hidden risk that comps aren't pricing in. Stress-test before assuming the spread holds.
Location & tenants
- Location reads 75/100 on livability (#268 in NY, #4,188 nationally) — a middle-class / working-renter tenant base. Strengths: amenities A+, commute A+, health & safety A; Watch: crime F, cost of living F.
- Market conditions: Rents rising fast (+7.1%/yr); 197 active listings in the ZIP; 17 comparable units currently listed for rent nearby; rentals at typical pace (median 19d on market — plan ~3-4 weeks tenant-placement turnaround); high-income renter base; 4,467 units permitted in New York County in 2024 (4,463 in 5+ unit buildings).
- At $37,897/mo this rent would consume 258% of the median local household income ($176k/yr) (locally 2282% of renters already pay >50% of income on rent) — very limited rent-growth headroom before tenants either downsize or default.
Forward outlook
- In year one you build about $321k of equity ($34k loan paydown + $286k appreciation (5.8% local appreciation)).
- New York County population projected at +21% by 2050 — long-run rental-demand tailwind backs the buy-and-hold thesis.
- At projected returns (5.8% appreciation + 7.1% rent growth), your $1.39M cash investment doubles in ~4 years — after that, you're playing with house money.
- By year 2, paydown + projected appreciation supports a ~$513k cash-out refi (75% LTV) — recoverable capital for the next deal without selling this one.
Negotiation context
- It's been on market 35 days — a 3% lower offer ($4.80M) is reasonable based on typical stale-listing flexibility.
- 2 sale attempts with the ask held roughly flat each time — persistent listings suggest the price (not the market) is what's stuck; bring a comps-based counter.
Risks & watch-outs
- Watch-outs: built in 1910 — expect roof / HVAC / electrical / plumbing capex.
- Climate carrying-cost: major flood risk; major wind risk, 27% chance of damaging wind over 30y; extreme-heat days projected 7→15/yr by 2055 (HVAC capex compounding) — expect insurance premiums to compound above CPI over the hold.
Questions for the listing agent
- It's been on market 35 days. Have you received any prior offers? Is the seller open to a 23% concession, seller financing, or rate buy-down credit?
- Built in 1910 — when were the roof, HVAC, electrical panel, plumbing, and water heater last replaced?
- Is there a deadline driving the sale (1031 exchange, divorce, estate, relocation)? That informs how much negotiation room exists.
- Schools are B-rated — typically a magnet for longer-tenancy family renters. What's the average tenant stay here, and is there a school-zone premium baked into asking?
- Crime grade is F in this area — have there been break-ins, vandalism, or insurance claims at this property in the last 3 years? What carrier currently insures it and at what premium?
- What's the average days-on-market for RENTAL listings here right now (not sales)? A rising rental-DOM trend means longer vacancies and softer asking-rent achievability than the comps imply.
- What's the recent tenant-quality profile in this submarket — average credit score on applications, eviction rate, late-payment / NSF rate, and stable-employment percentage? A property-management company in the area should have these aggregated.
- How much new apartment / multifamily construction is in the pipeline within 1–3 miles? Heavy new supply (>2% of stock underway) typically softens rents 12–24 months out; light construction supports rent growth.
Investment metrics
- 1% rule
- 0.77% ✗
- Cap rate
- 6.31%
- Cash-on-cash
- 0.05%
- DSCR
- 1.00
- GRM
- 10.9
CMA / ARV
No comps found within radius.
Projected returns pro-forma
5.79% appreciation · 7.13% rent growth · sell at horizon
- IRR
- 16.4%
- Equity multiple
- 2.11×
- Total profit
- $1,531,992
- Equity at exit
- $3,044,699
- IRR
- 17.8%
- Equity multiple
- 4.54×
- Total profit
- $4,909,752
- Equity at exit
- $5,464,426
Cash invested: $1,386,000 (down + closing). Projections, not guarantees.
Landlord ↔ Tenant lean methodology
- Overall (CITY)
- 0 Strongly Tenant-Friendly
- State New York
- 15 Strongly Tenant-Friendly · D+10
- County
- — inherits STATE
- City New York
- 0 Strongly Tenant-Friendly · D+34
ZIP-level market 10014
- Home prices YoY
- 3.0%
- Rents YoY
- 7.1%
- Active inventory
- 197
- Price-to-rent
- 43.5×
Monthly cashflow live
- Estimated rent
- $37,897 high interval (Pro) →
- Mortgage (P&I)
- −$25,958
- Tax from tax record
- −$1,856 /mo · $22,272/yr
- Insurance
- −$2,062
- HOA
- −$0
- Vacancy / Maint / Mgmt
- −$7,958
- Net cashflow
- $62
Break-even live
4-unit breakdown (identical units grouped — click to expand)
| Units | Beds | Baths | Est. rent |
|---|---|---|---|
| 4× units | 2 | 1.5 | $37,896 |
| #1 | 2 | 1.5 | $9,474 |
| #2 | 2 | 1.5 | $9,474 |
| #3 | 2 | 1.5 | $9,474 |
| #4 | 2 | 1.5 | $9,474 |
| Total (4 units) | $37,897 | ||
UW: 25.0% down · 7.5% · 30yr · 1.5% tax · 5.0% vac · 8.0% maint · 8.0% mgmt
Financing live
Cash to close
- Down payment
- $1,237,500
- Closing costs
- $148,500
- Reserves months
- —
- Total cash needed
- —
Loan-product check · same deal, 3 products live
Conventional
25% down · 7.5% · 30yr
- Down + closing
- —
- Monthly P&I
- —
- Monthly cashflow
- —
- DSCR
- —
- Eligible?
- —
Personal DTI + credit; lowest rate.
DSCR
20% down · 8.5% · 30yr
- Down + closing
- —
- Monthly P&I
- —
- Monthly cashflow
- —
- DSCR
- —
- Eligible?
- —
No personal income docs; deal must DSCR.
Hard money
10% down · 12.0% · 12mo
- Down + closing
- —
- Monthly P&I
- —
- Monthly cashflow
- —
- DSCR
- —
- Eligible?
- —
Short-term bridge; refi at stabilization.
Rent comps 17 comps
| Address | Beds | Baths | Sqft | Rent | $/sqft | DOM | Units | Dist |
|---|---|---|---|---|---|---|---|---|
| 24 Commerce St Unit 1763 New York, NY | 4.0 | 3.5 | 2400 | $44,000 | $18.33 | 22d | 1 | 0.29mi |
| 71 Horatio St Unit 1 New York, NY | 3.0 | 2.0 | 1737 | $20,000 | $11.51 | 1d | 1 | 0.50mi |
| 125 E 12th St Unit 1C New York, NY | 3.0 | 2.5 | 2059 | $20,000 | $9.71 | 5d | 1 | 0.60mi |
| 112 E 10th St Unit 1021937P New York, NY | 1.0–3.0 | 1.0–2.5 | 1296 | $21,605 | $16.66 | 3d | 2 | 0.66mi |
| 127 Spring St Unit 1035010P New York, NY | 3.0 | 2.0 | 2798 | $24,633 | $8.80 | 24d | 1 | 0.69mi |
| 128 W 26th St #13 New York, NY | 3.0 | 2.0 | 1426 | $13,000 | $9.12 | 24d | 1 | 0.86mi |
| 460 Greenwich St New York, NY | 2.0–3.0 | 2.0–2.5 | 1750 | $14,500 | $8.29 | 3d | 2 | 0.87mi |
| 460 Greenwich St Unit 5 New York, NY | 3.0 | 2.0 | 1750 | $14,500 | $8.29 | 1d | 1 | 0.87mi |
| 11 6th Ave Unit 11A New York, NY | 3.0 | 2.5 | 1648 | $27,500 | $16.69 | 24d | 1 | 1.03mi |
| 31 Walker St Unit 4 New York, NY | 3.0 | 2.0 | 2000 | $13,500 | $6.75 | 19d | 1 | 1.04mi |
| 10 E 29th St New York, NY | 1.0–3.0 | 1.0–3.0 | 1323 | $16,736 | $12.65 | 1d | 4 | 1.04mi |
| 208 W 30th St Unit 501 New York, NY | 3.0 | 2.0 | 2500 | $13,000 | $5.20 | 24d | 1 | 1.07mi |
| 351 W 30th St New York, NY | 4.0 | 2.5 | 2450 | $16,950 | $6.92 | 11d | 1 | 1.16mi |
| 490 2nd Ave Unit 10A New York, NY | 4.0 | 2.0 | 1400 | $10,900 | $7.79 | 24d | 1 | 1.21mi |
| 220 E 30th St Unit 2 New York, NY | 3.0 | 2.5 | 2200 | $11,995 | $5.45 | 24d | 1 | 1.25mi |
| 30 Park Ave Unit 30B New York, NY | 3.0 | 3.0 | 2773 | $28,000 | $10.10 | 24d | 1 | 1.41mi |
| 101 Warren St New York, NY | 2.0–3.0 | 2.5–3.0 | 1611 | $20,250 | $12.57 | 11d | 2 | 1.41mi |
Listing history 9 events
-
2026-06-18days on market $4,950,000 Active 35 DOM
-
2026-06-17days on market $4,950,000 Active 34 DOM
-
2026-06-16days on market $4,950,000 Active 33 DOM
-
2026-06-15days on market $4,950,000 Active 32 DOM
-
2026-06-13days on market $4,950,000 Active 30 DOM
-
2026-06-10days on market $4,950,000 Active 26 DOM
-
2026-06-08days on market $4,950,000 Active 25 DOM
-
2026-06-08remarks 699-char remark
-
2026-06-08$4,950,000 Active 24 DOM
ⓘ Source: listings_history table (triggers on properties + properties_extension) + one-shot
backfill from property_details.listing_events for pre-trigger history.
Tax reassessment forecast NY · Partial reset (capped growth)
- Current annual tax
- $22,272 · $1,856/mo
- Projected year-2 tax
- $52,963 · $4,414/mo
- Expected delta
- +$30,692/yr (+$2,558/mo · 137.8%)
ⓘ Screening estimate from a state-policy table — verify with the county assessor before closing.
Climate risk First Street
- Flood 6/10 Major FEMA zone X (unshaded) · 75% chance over 30 yrs
- Wildfire 1/10 Low
- Heat 7/10 Severe 7 d/yr ≥99°F today · 15 d/yr by 30 yrs out
- Wind 6/10 Major 27% chance of damaging wind over 30 yrs
- Air quality 4/10 Moderate 5 unhealthy d/yr today · 7 by 30 yrs out
Nearby sold comps map
Loading sold comps map…
Walkable amenities ~0.75 mi
Loading nearby amenities…
Taxation est. · year 1
- Rental income
- $454,764
- − Mortgage interest
- −$277,277
- − Property taxes
- −$22,272
- − Insurance
- −$24,750
- − Repairs & maintenance
- −$36,381
- − Management
- −$36,381
- − Depreciation
- −$144,000
- Taxable loss
- −$86,297
- Est. tax savings @ 24.0%
- +$20,711
- After-tax cash flow
- $21,453/yr
For passive investors: Depreciation is non-cash, so a rental often shows a tax loss while cash-flowing — sheltering income. Rental losses are passive: they offset passive income freely, and up to $25,000/yr can offset ordinary (W-2) income if you actively participate and your MAGI is under $100k (phasing out to $0 by $150k); unused losses carry forward. On sale, claimed depreciation is recaptured at up to 25%, and gains may owe capital-gains tax (a 1031 exchange can defer both). Figures are a year-1 estimate at your 24.0% rate — not tax advice; consult a CPA.
Schools (NCES district)
No district data.
Livability — New York
- Score
- 75/100
- State rank
- #268
- US rank
- #4188
Category grades
Schools grade is shown separately in the Schools card above.
Census & demographics
- Census place
- New York, NY
- County
- New York County · 1,599,927 people
- City population
- 7,731,280
- Metro
- New York-Newark-Jersey City, NY-NJ-PA
- Population (ZIP)
- 29,230
- Household income
- $176,395
- Rent vs Own
- Severe rent burden
- 2282.0
Population outlook (New York County) Hauer SSP2
- Today (2025)
- 1,825,725 people
- By 2030
- 1,904,611 · +4.3%
- By 2040
- 2,052,719 · +12.4%
- By 2050
- 2,206,601 · +20.9%
- By 2075
- 2,509,427 · +37.4%
- By 2100
- 2,702,933 · +48.0%
Race, ethnicity, and origin ACS 2023
- Neighborhood character
- Predominantly White (78%)
- Race & ethnicity
- White 78% Hispanic / Latino 11% Two or more races 8% Asian 5% Black 3%
- Hispanic origin (detail)
- Mexican 2% Puerto Rican 4% Cuban 1%
- Common ancestry
- Romanian 6% Scotch-Irish 5% Lithuanian 4%
- Foreign-born
- 19% · Canada, China, Dominican Republic
- Languages at home
- 84% English-only · Spanish 6% Other Indo-European 3% French/Haitian/Cajun 2%
Political lean MEDSL · New York
- 2024 margin
- Solid D (+64.8) · D 82.4% · R 17.6%
- 2008→2024 swing
- -7.4pp toward R · 2008: 72.2pp · 2024: 64.8pp
- All cycles
- 2024: D+64.8 2020: D+74.5 2016: D+77.2 2012: D+69.6 2008: D+72.2
Not yet ingested
- Civics
- —
Market trends
- HPI YoY
- ▲ 5.79%
- Current HPI
- 200.1796
- Rent YoY
- ▲ 7.13%
- Metro
- New York-Newark-Jersey City, NY-NJ-PA
- State GDP YoY
- ▲ 2.60%
- F500 in state
- 92
Industry mix (Fortune 500 HQ in NY)
| Industry | F500 HQs | Revenue |
|---|---|---|
| Financial Services | 10 | $950B |
|
||
| Consumer Goods | 9 | $162B |
|
||
| Insurance | 4 | $225B |
|
||
| Telecommunications | 2 | $144B |
|
||
| Pharmaceuticals | 2 | $112B |
|
||
| Media / Entertainment | 2 | $69B |
|
||
Price history
2 events — show timeline
- 2026-06-04 Relisted — RLS at REBNY
- 2026-04-10 Listed $4,950,000 RLS at REBNY
Property tax history
+0.8%/yrLatest (2025): $22,272 · -46.0% YoY. Source: county tax records.
Cash-flow waterfall
monthlySold comps — $/sqft
last 12 mo · ≤1 miLoading sold comps…