 🏗️ New Construction
184 Weaver Way · Maurice, LA
Flood risk No data
- FEMA flood zone
- —
- Chance of flooding over 30 yrs
- —
- Est. flood insurance / yr
- —
Fire risk No data
- Est. fire insurance / yr
- —
Heat risk No data
- Hot days now (above threshold)
- —
- Hot days in 30 yrs
- —
Wind risk No data
- Chance of severe wind over 30 yrs
- —
Air-quality risk No data
- Unhealthy air days now
- —
- Unhealthy air days in 30 yrs
- —
Risk factors via First Street. Map © Google.
Why this score? — see what drove the D- grade
The composite is a weighted blend of 9 inputs, each scored 0–100. Each bar is that input's sub-score; the figure is the points it added to the 100-point composite (weight × sub-score).
- Cash flow +10.4/30.0
- ARV discount +7.5/15.0
- Condition / age +5.0/5.0
- Schools +3.9/10.0
- Livability +3.8/5.0
- 1% rule +3.2/10.0
- DSCR +3.0/10.0
- Rent growth +2.5/5.0
- Appreciation +0.0/10.0
$257,095
🖨 Deal sheet 📄 Offer letter ✓ Due diligence
Listing remarks
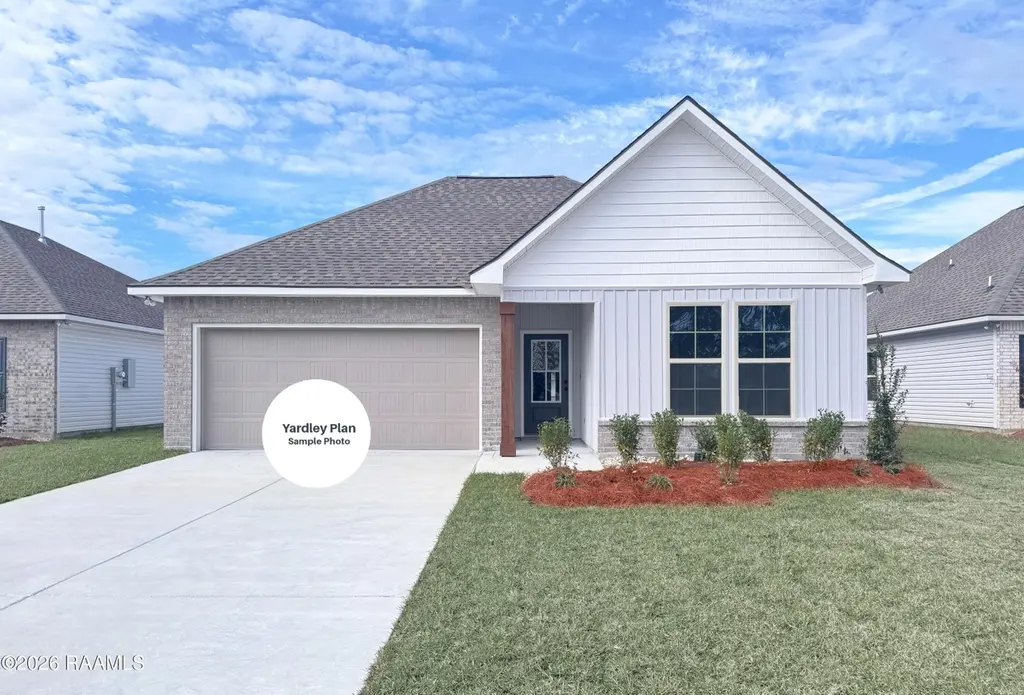
BACKS TO POND!Brand NEW Construction built by DSLD HOMES in Hudson Yards! This YARDLEY III G has an open floor plan with upgraded quartz counters, stainless appliances with a gas range, backsplash & more. Special features include: kitchen island, vinyl plank flooring in living room & all wet areas, undermount kitchen sink, garden tub, separate shower & walk-in closet in master, smart connect Wi-Fi thermostat, structured wiring panel box, covered patio & more!
Key facts
- 6,098 sq ft lot
- 2 garage spots
- Built 2026
Neighborhood map
What this means for you Summary
Snapshot
- This is a 4-bed/2.5-bath single-family listed at $257k. Condition is rated excellent.
Deal economics
- At list price, monthly cash flow is $-141 ($-2k/yr) — negative.
- To cash-flow at today's rent, offer at most $245k (4.5% below list).
- To meet the 1% rule (rent ≥ 1% of price), the offer needs to be $219k (14.9% below list).
- Recommended offer: $219k (14.9% below list) — sets the bar for 1% rule.
Location & tenants
- Location reads 76/100 on livability (#15 in LA, #3,333 nationally) — a middle-class / working-renter tenant base. Strengths: crime A+, cost of living A+, housing A+; Watch: amenities F, commute F.
- Vermilion Parish (town): math 40% / reading 53% proficiency, ranked #15 of 98 in LA (top 15%) — families likely to look elsewhere, expect single-tenant / working-renter base with shorter leases.
- Zoned schools: Cecil Picard Elementary School At Maurice (math 61% / reading 68%, grade B, #40 of 646 statewide, top 7%, 845 students, 42% FRL); North Vermilion Middle School (math 47% / reading 53%, grade C, #26 of 218 statewide, top 12%, 656 students, 45% FRL); North Vermilion High School (math 57% / reading 63%, grade C+, #20 of 265 statewide, top 7%, 854 students, 44% FRL).
- Market conditions: 248 active listings in the ZIP; 5 comparable units currently listed for rent nearby; rentals lingering (median 44d on market — plan ~5-8 weeks vacancy on turnover, expect pricing pressure); 60% of comp listings sitting > 30 days — soft ceiling on asking rent; solid renter incomes; 228 units permitted in Vermilion Parish in 2024 (0 in 5+ unit buildings).
- This rent runs 34% of the median local income ($76k/yr) — at the standard rent-burdened threshold; future hikes will face affordability resistance.
Forward outlook
- Local home prices are declining (-3.0%/yr); year-one equity from $2k of loan paydown is wiped out by about $8k of value loss. Plan a longer hold.
- Vermilion County population projected at +10% by 2050 — modest demand growth; plan on rents tracking national, not racing it.
Negotiation context
- Only 0 days on market — expect competitive offers; lowballing is unlikely to land.
Questions for the listing agent
- What do current leases actually rent for vs. the listed asking? Can we see a recent rent roll and the last 12 months of T-12 income?
- What does the HOA fee cover, when was the last increase, and are there any pending special assessments or reserve-fund shortfalls?
- Is there a deadline driving the sale (1031 exchange, divorce, estate, relocation)? That informs how much negotiation room exists.
- Schools are A-rated — typically a magnet for longer-tenancy family renters. What's the average tenant stay here, and is there a school-zone premium baked into asking?
- The area grade is low — what's the realistic commute time and amenity access for the typical tenant pool here? Any planned neighborhood developments (good or bad) we should know about?
- What's the average days-on-market for RENTAL listings here right now (not sales)? A rising rental-DOM trend means longer vacancies and softer asking-rent achievability than the comps imply.
- What's the recent tenant-quality profile in this submarket — average credit score on applications, eviction rate, late-payment / NSF rate, and stable-employment percentage? A property-management company in the area should have these aggregated.
- How much new for-sale + rental construction is in the pipeline within 1–3 miles? Heavy new supply typically softens prices + rents 12–24 months out; constrained supply supports both.
Investment metrics
- 1% rule
- 0.82% ✗
- Cap rate
- 5.66%
- Cash-on-cash
- -2.27%
- DSCR
- 0.90
- GRM
- 10.1
CMA / ARV
- ARV (on-the-fly)
- $265,785
- Comps found
- 12
Show comp detail 12 sales within ~0.75 mi
| Address | Dist | Beds/Ba | Sqft | Sold | Price | $/sf | Match |
|---|---|---|---|---|---|---|---|
| 184 Weaver Way | 0.00mi | 4/2.5 | 1,833 (0%) | 0mo | $257,095 | $140 | 100 |
| 116 Dawson Ave | 0.13mi | 4/2.5 | 1,833 (0%) | 1mo | $258,406 | $141 | 93 |
| 409 Weaver Way | 0.22mi | 4/2.5 | 1,833 (0%) | 2mo | $255,405 | $139 | 88 |
| 121 Harper Dr | 0.21mi | 4/2.0 | 1,858 (+1%) | 1mo | $258,936 | $139 | 85 |
| 108 Pierce Ln | 0.17mi | 4/2.0 | 1,875 (+2%) | 2mo | $257,185 | $137 | 85 |
| 106 Dawson Ave | 0.13mi | 4/2.0 | 1,641 (-10%) | 0mo | $242,615 | $148 | 74 |
| 98 Margaret Lucia Dr | 0.54mi | 4/2.0 | 1,885 (+3%) | 2mo | $280,000 | $149 | 66 |
| 114 Dawson Ave | 0.13mi | 3/2.0 (-1) | 1,613 (-12%) | 1mo | $236,175 | $146 | 66 |
| 125 Dawson Ave | 0.15mi | 3/2.0 (-1) | 1,629 (-11%) | 2mo | $235,880 | $145 | 66 |
| 110 Louis Private Ln | 0.63mi | 3/2.0 (-1) | 1,729 (-6%) | 2mo | $280,000 | $162 | 53 |
| 149 Micah Edward Dr | 0.51mi | 3/2.0 (-1) | 1,642 (-10%) | 3mo | $243,000 | $148 | 49 |
| 102 Esson Dr | 0.58mi | 3/2.0 (-1) | 1,616 (-12%) | 1mo | $234,500 | $145 | 45 |
Match score weights: distance 35% · size 25% · config 20% · recency 20%. Top-matched comps best support the ARV.
Projected returns pro-forma
-3.0% appreciation · 3.0% rent growth · sell at horizon
- IRR
- -20.0%
- Equity multiple
- 0.30×
- Total profit
- $-51,989
- Equity at exit
- $39,629
- IRR
- -13.0%
- Equity multiple
- 0.24×
- Total profit
- $-56,612
- Equity at exit
- $22,980
Cash invested: $74,420 (down + closing). Projections, not guarantees.
Landlord ↔ Tenant lean methodology
- Overall (STATE)
- 90 Strongly Landlord-Friendly
- State Louisiana
- 90 Strongly Landlord-Friendly · R+12
- County
- — inherits STATE
- City
- — inherits STATE
ZIP-level market 70555
- Home prices YoY
- -29.4%
- Active inventory
- 248
- Price-to-rent
- 9.8×
Monthly cashflow live
- Estimated rent
- $2,187 high interval (Pro) →
- Mortgage (P&I)
- −$1,394
- Tax est. 1.5%
- −$332 /mo · $3,987/yr
- Insurance
- −$111
- HOA
- −$32
- Vacancy / Maint / Mgmt
- −$459
- Net cashflow
- $-141
Break-even live
UW: 25.0% down · 7.5% · 30yr · 1.5% tax · 5.0% vac · 8.0% maint · 8.0% mgmt
Financing live
Cash to close
- Down payment
- $66,446
- Closing costs
- $7,974
- Reserves months
- —
- Total cash needed
- —
Loan-product check · same deal, 3 products live
Conventional
25% down · 7.5% · 30yr
- Down + closing
- —
- Monthly P&I
- —
- Monthly cashflow
- —
- DSCR
- —
- Eligible?
- —
Personal DTI + credit; lowest rate.
DSCR
20% down · 8.5% · 30yr
- Down + closing
- —
- Monthly P&I
- —
- Monthly cashflow
- —
- DSCR
- —
- Eligible?
- —
No personal income docs; deal must DSCR.
Hard money
10% down · 12.0% · 12mo
- Down + closing
- —
- Monthly P&I
- —
- Monthly cashflow
- —
- DSCR
- —
- Eligible?
- —
Short-term bridge; refi at stabilization.
Rent comps 5 comps
| Address | Beds | Baths | Sqft | Rent | $/sqft | DOM | Units | Dist |
|---|---|---|---|---|---|---|---|---|
| 222 Weaver Way Maurice, LA | 3.0 | 2.0 | 1538 | $1,850 | $1.20 | 13d | 1 | 0.03mi |
| 108 Michael John Dr Maurice, LA | 4.0 | 2.0 | 1961 | $1,900 | $0.97 | 43d | 1 | 0.26mi |
| 112 Melanie Rose Dr Unit NA Maurice, LA | 4.0 | 2.0 | 2010 | $1,995 | $0.99 | 13d | 1 | 0.28mi |
| 8550 Cat Rd Unit B Maurice, LA | 3.0 | 2.0 | 1324 | $1,650 | $1.25 | 43d | 1 | 0.59mi |
| 127 Allister Rd Maurice, LA | 4.0 | 2.0 | 1803 | $1,575 | $0.87 | 43d | 1 | 0.80mi |
HOA detail
- Monthly dues
- $32 · $384/yr
- Likely covers
- gasinternet
Listing history 1 events
-
2026-03-17$253,095
ⓘ Source: listings_history table (triggers on properties + properties_extension) + one-shot
backfill from property_details.listing_events for pre-trigger history.
Nearby sold comps map
Loading sold comps map…
Walkable amenities ~0.75 mi
Loading nearby amenities…
Taxation est. · year 1
- Rental income
- $26,246
- − Mortgage interest
- −$14,888
- − Property taxes
- −$3,987
- − Insurance
- −$1,329
- − Repairs & maintenance
- −$2,100
- − Management
- −$2,100
- − HOA
- −$384
- − Depreciation
- −$7,732
- Taxable loss
- −$6,273
- Est. tax savings @ 24.0%
- +$1,505
- After-tax cash flow
- $-185/yr
For passive investors: Depreciation is non-cash, so a rental often shows a tax loss while cash-flowing — sheltering income. Rental losses are passive: they offset passive income freely, and up to $25,000/yr can offset ordinary (W-2) income if you actively participate and your MAGI is under $100k (phasing out to $0 by $150k); unused losses carry forward. On sale, claimed depreciation is recaptured at up to 25%, and gains may owe capital-gains tax (a 1031 exchange can defer both). Figures are a year-1 estimate at your 24.0% rate — not tax advice; consult a CPA.
Condition & rehab AI · 1 photo
This newly constructed single-family home in Maurice, LA, is in excellent condition with no visible repairs needed. It offers a high-end finish and is move-in ready, making it an attractive investment for both resale and rental markets.
Value-add opportunities
- Both Landscaping improvements — Enhances curb appeal and property value
- Both Smart home integration — Improves convenience and marketability
Renovation cost estimate screening
Value-add ROI direction
- Both Landscaping improvements — Enhances curb appeal and property value ↑
- Both Smart home integration — Improves convenience and marketability ↑
ⓘ Cost ranges are severity-bucket heuristics (US national rule-of-thumb). Get contractor quotes + a written scope before underwriting a rehab budget.
Schools (NCES district)
- District
- Vermilion Parish
- NCES district ID
- 2201800
- Math proficiency
- 40% ▼ -38.00%
- Reading proficiency
- 53% ▼ -32.00%
- Median HH income
- $45,115
- Composite
- 39.37/100
- National rank
- #3974
- State rank
- #15 of 98 in LA
Livability — Maurice
- Score
- 76/100
- State rank
- #15
- US rank
- #3333
Category grades
Schools grade is shown separately in the Schools card above.
Census & demographics
- Census place
- Maurice, LA
- County
- Vermilion Parish · 8,759 people
- City population
- 8,759
- Metro
- Lafayette, LA
- Population (ZIP)
- 8,759
- Household income
- $76,213
- Rent vs Own
- Severe rent burden
- 46.0
Population outlook (Vermilion County) Hauer SSP2
- Today (2025)
- 64,095 people
- By 2030
- 65,915 · +2.8%
- By 2040
- 68,985 · +7.6%
- By 2050
- 70,804 · +10.5%
- By 2075
- 73,897 · +15.3%
- By 2100
- 71,793 · +12.0%
Race, ethnicity, and origin ACS 2023
- Neighborhood character
- Predominantly White (82%)
- Race & ethnicity
- White 82% Black 8% Two or more races 5% Hispanic / Latino 4% Asian 3%
- Common ancestry
- Lithuanian 25% Romanian 3% Italian 1%
- Foreign-born
- 2% · Vietnam
- Languages at home
- 93% English-only · French/Haitian/Cajun 4% Vietnamese 2% Spanish 1%
Political lean MEDSL · Vermilion
- 2024 margin
- Solid R (+63.8) · D 17.6% · R 81.4% · Other 1.1%
- 2008→2024 swing
- -16.3pp toward R · 2008: -47.5pp · 2024: -63.8pp
- All cycles
- 2024: R+63.8 2020: R+61.9 2016: R+59.6 2012: R+52.8 2008: R+47.5
Not yet ingested
- Civics
- —
Market trends
- HPI YoY
- ▼ -55.61%
- Current HPI
- 133.7146
- Rent YoY
- —
- Metro
- Lafayette, LA
- State GDP YoY
- ▲ 3.29%
- F500 in state
- 10
Industry mix (Fortune 500 HQ in LA)
| Industry | F500 HQs | Revenue |
|---|---|---|
| Telecommunications | 2 | $23B |
|
||
| Utilities | 1 | $12B |
|
||
| Wholesale / Distribution | 1 | $5B |
|
||
| Advertising | 1 | $2B |
|
||
Price history
1 event — show timeline
- 2026-03-17 Listed $253,095 AcadianaMLS
Cash-flow waterfall
monthlySold comps — $/sqft
last 12 mo · ≤1 miLoading sold comps…