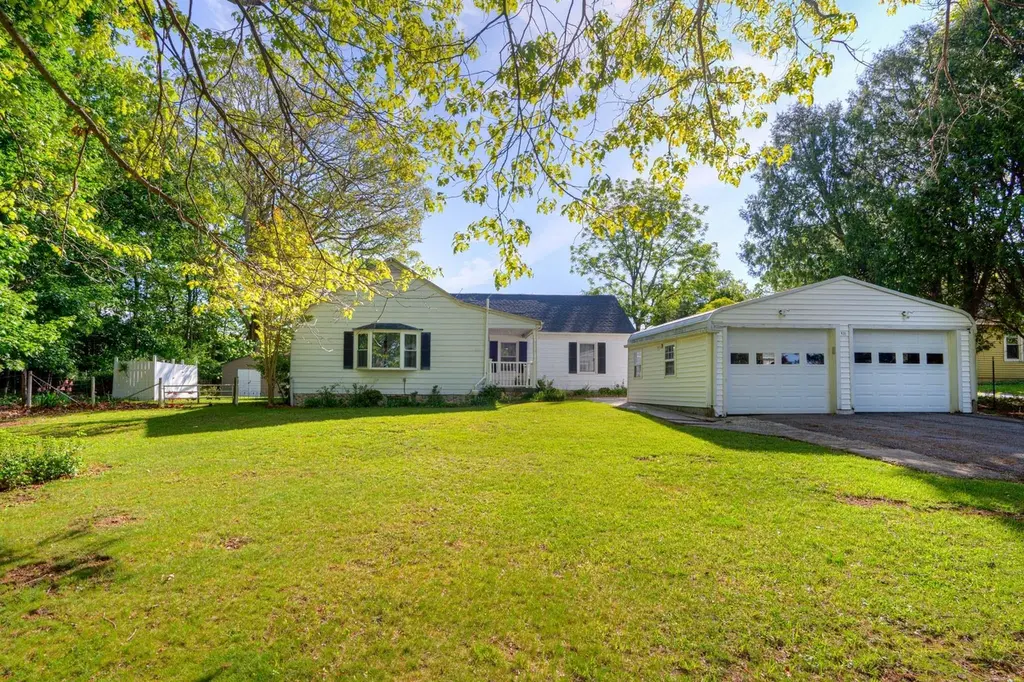
431 Alleghany St · Blacksburg, VA
Flood risk 1/10 · Minimal
- FEMA flood zone
- X (unshaded)
- Chance of flooding over 30 yrs
- 0.0%
- Est. flood insurance / yr
- $473 – $860
Fire risk 3/10 · Minor
- Est. fire insurance / yr
- $666 – $1,236
Heat risk 3/10 · Minor
- Hot days now (above 95°F)
- 5 days/yr
- Hot days in 30 yrs
- 13 days/yr
Wind risk 2/10 · Minimal
- Chance of severe wind over 30 yrs
- 1.0%
Air-quality risk 1/10 · Minimal
- Unhealthy air days now
- 0 days/yr
- Unhealthy air days in 30 yrs
- 0 days/yr
Risk factors via First Street. Map © Google.
Why this score? — see what drove the D grade
The composite is a weighted blend of 9 inputs, each scored 0–100. Each bar is that input's sub-score; the figure is the points it added to the 100-point composite (weight × sub-score).
- ARV discount +15.0/15.0
- Cash flow +7.7/30.0
- Schools +5.4/10.0
- Livability +4.4/5.0
- Rent growth +3.5/5.0
- Condition / age +2.5/5.0
- DSCR +1.8/10.0
- 1% rule +1.3/10.0
- Appreciation +0.0/10.0
$379,500
🖨 Deal sheet 📄 Offer letter ✓ Due diligence
Listing remarks MLS
Welcome to 431 Alleghany Street! This well-loved, one-owner, home is looking for someone to make it their own! Less than 1 mile from Downtown Blacksburg, this lovely home has hardwood floors, a beautiful living room with bright windows, a large eat-in kitchen, and a massive sunroom/bonus room. The basement is partially finished with a bathroom and was previously a 3rd non-conforming bedroom with a closet - perfect for a guest suite, office, or flex space! The flat yard, adjacent to a wooded lot, is partially fenced in the front and fully fenced in the back. Enjoy the screened in porch or the patio in the warmer months and the fireplace in the sunroom when the weather cools down. This home is a charmer!
Key facts
- Covered porches
- Fenced-in yard
- Hardwood floors
Tags
Property features AI
Exterior
- Parking: Detached 2-car garage; Asphalt driveway
- Utilities: Public water; Public sewer
- Home design: Single-family detached residence; One story
- Construction: Aluminum siding; Shingle roof
- Exterior features: Porch; Screened porch; Fenced yard; Shed(s)
Interior
- Kitchen: Dishwasher; Electric range; Refrigerator; Electric water heater
- Flooring: Carpet; Ceramic tile; Hardwood; Vinyl
- Bathrooms: 2 full bathrooms
- Heating & cooling: Heat pump; Baseboard heating; Electric heating; Ceiling fan(s)
- Interior features: Bay windows; Finished basement
- Laundry & utility: Washer; Dryer; Laundry in basement
Neighborhood map
What this means for you Summary
Snapshot
- This is a 3-bed/2.0-bath single-family listed at $380k.
Deal economics
- At list price, monthly cash flow is $-434 ($-5k/yr) — negative.
- To cash-flow at today's rent, offer at most $303k (20.2% below list).
- To meet the 1% rule (rent ≥ 1% of price), the offer needs to be $240k (36.8% below list).
- Recommended offer: $240k (36.8% below list) — sets the bar for 1% rule.
- Cap rate 4.9% vs local median 2.5% in Blacksburg — top-decile yield for the area; either an underpriced asset or a hidden risk that comps aren't pricing in. Stress-test before assuming the spread holds.
Location & tenants
- Location reads 88/100 on livability (#8 in VA, #215 nationally) — a professional / high-income tenant draw. Strengths: crime A+, amenities A+, commute A+; Watch: cost of living C-, housing C-.
- Montgomery County Public School District (urban): math 57% / reading 70% proficiency, ranked #47 of 131 in VA (top 36%) — acceptable for families but not a draw, mixed tenant base, ~2y average lease.
- Zoned schools: Harding Avenue Elementary (math 77% / reading 87%, grade A+, #106 of 1,108 statewide, top 11%, 296 students, 18% FRL); Blacksburg Middle (math 62% / reading 77%, grade A, #85 of 342 statewide, top 26%, 946 students, 30% FRL); Blacksburg High (math 80% / reading 92%, grade A, #20 of 319 statewide, top 6%, 1,321 students, 23% FRL).
- Zoned-school proficiency averages 79% at this address vs 64% district-wide (+16 pts) — the actual schools serving this property are materially stronger than the Montgomery County Public School District average implies; a family-tenant draw the district grade alone would hide.
- Market conditions: Rents rising (+4.0%/yr); 313 active listings in the ZIP; 3 comparable units currently listed for rent nearby; rentals lingering (median 44d on market — plan ~5-8 weeks vacancy on turnover, expect pricing pressure); 100% of comp listings sitting > 30 days — soft ceiling on asking rent; 323 units permitted in Montgomery County in 2024 (0 in 5+ unit buildings).
- This rent runs 43% of the median local income ($68k/yr) — at the standard rent-burdened threshold; future hikes will face affordability resistance.
Forward outlook
- Local home prices are declining (-3.0%/yr); year-one equity from $3k of loan paydown is wiped out by about $11k of value loss. Plan a longer hold.
- Montgomery County population projected at +13% by 2050 — modest demand growth; plan on rents tracking national, not racing it.
Negotiation context
- It's been on market 46 days — a 3% lower offer ($368k) is reasonable based on typical stale-listing flexibility.
- 3 sale attempts since 4y ago with the ask held roughly flat each time — persistent listings suggest the price (not the market) is what's stuck; bring a comps-based counter.
- Current owner paid $320k; 19% above their basis — modest negotiation headroom, anchor on the comps not their cost.
Questions for the listing agent
- What do current leases actually rent for vs. the listed asking? Can we see a recent rent roll and the last 12 months of T-12 income?
- It's been on market 46 days. Have you received any prior offers? Is the seller open to a 37% concession, seller financing, or rate buy-down credit?
- Built in 1960 — when were the roof, HVAC, electrical panel, plumbing, and water heater last replaced?
- Is there a deadline driving the sale (1031 exchange, divorce, estate, relocation)? That informs how much negotiation room exists.
- Schools are A-rated — typically a magnet for longer-tenancy family renters. What's the average tenant stay here, and is there a school-zone premium baked into asking?
- The area grade is low — what's the realistic commute time and amenity access for the typical tenant pool here? Any planned neighborhood developments (good or bad) we should know about?
- What's the average days-on-market for RENTAL listings here right now (not sales)? A rising rental-DOM trend means longer vacancies and softer asking-rent achievability than the comps imply.
- What's the recent tenant-quality profile in this submarket — average credit score on applications, eviction rate, late-payment / NSF rate, and stable-employment percentage? A property-management company in the area should have these aggregated.
- How much new for-sale + rental construction is in the pipeline within 1–3 miles? Heavy new supply typically softens prices + rents 12–24 months out; constrained supply supports both.
Investment metrics
- 1% rule
- 0.63% ✗
- Cap rate
- 4.92%
- Cash-on-cash
- -4.90%
- DSCR
- 0.78
- GRM
- 13.2
CMA / ARV
- ARV (median comp)
- $534,747
- List price
- $379,500
- Delta
- -29.03%
- Verdict
- UNDERPRICED
- Comps
- 20 within 1.0 mi
Show comp detail 12 sales within ~0.75 mi
| Address | Dist | Beds/Ba | Sqft | Sold | Price | $/sf | Match |
|---|---|---|---|---|---|---|---|
| 406 Ridgeview Dr | 0.26mi | 3/3.0 | 2,496 (+1%) | 3mo | $554,900 | $222 | 80 |
| 604 Gigi Dr | 0.19mi | 4/2.5 (+1) | 2,740 (+10%) | 6mo | $575,000 | $210 | 61 |
| 404 Piedmont St | 0.17mi | 3/2.5 | 2,228 (-10%) | 15mo | $526,600 | $236 | 61 |
| 304 Fincastle Dr | 0.21mi | 4/3.0 (+1) | 2,723 (+10%) | 8mo | $548,000 | $201 | 58 |
| 417 Ridgeview Dr | 0.29mi | 4/2.5 (+1) | 2,248 (-9%) | 9mo | $490,000 | $218 | 56 |
| 605 Kentwood Dr | 0.55mi | 4/3.5 (+1) | 2,424 (-2%) | 6mo | $735,000 | $303 | 55 |
| 2771 Wrights Way | 0.71mi | 4/3.5 (+1) | 2,426 (-2%) | 7mo | $525,000 | $216 | 46 |
| 504 Jefferson St | 0.33mi | 4/2.5 (+1) | 2,823 (+14%) | 10mo | $775,000 | $275 | 46 |
| 205 Fincastle Dr Dr | 0.31mi | 4/2.5 (+1) | 2,826 (+14%) | 12mo | $600,000 | $212 | 45 |
| 1430 Harding Rd | 0.74mi | 3/3.5 | 2,335 (-6%) | 6mo | $432,500 | $185 | 45 |
| 304 Apperson Dr | 0.56mi | 4/3.0 (+1) | 2,626 (+6%) | 20mo | $470,000 | $179 | 39 |
| 1006 Palmer Dr | 0.74mi | 4/3.0 (+1) | 2,115 (-15%) | 19mo | $420,000 | $199 | 16 |
Match score weights: distance 35% · size 25% · config 20% · recency 20%. Top-matched comps best support the ARV.
Projected returns pro-forma
-3.0% appreciation · 3.95% rent growth · sell at horizon
- IRR
- -23.8%
- Equity multiple
- 0.18×
- Total profit
- $-86,961
- Equity at exit
- $56,585
- IRR
- -16.8%
- Equity multiple
- 0.04×
- Total profit
- $-102,210
- Equity at exit
- $32,812
Cash invested: $106,260 (down + closing). Projections, not guarantees.
Landlord ↔ Tenant lean methodology
- Overall (STATE)
- 55 Moderately Landlord-Leaning
- State Virginia
- 55 Moderately Landlord-Leaning · D+2
- County
- — inherits STATE
- City
- — inherits STATE
ZIP-level market 24060
- Rents YoY
- 4.0%
- Active inventory
- 313
- Price-to-rent
- 13.2×
Monthly cashflow live
- Estimated rent
- $2,400 medium interval (Pro) →
- Mortgage (P&I)
- −$1,990
- Tax from tax record
- −$181 /mo · $2,177/yr
- Insurance
- −$158
- HOA
- −$0
- Vacancy / Maint / Mgmt
- −$504
- Net cashflow
- $-434
Break-even live
UW: 25.0% down · 7.5% · 30yr · 1.5% tax · 5.0% vac · 8.0% maint · 8.0% mgmt
Financing live
Cash to close
- Down payment
- $94,875
- Closing costs
- $11,385
- Reserves months
- —
- Total cash needed
- —
Loan-product check · same deal, 3 products live
Conventional
25% down · 7.5% · 30yr
- Down + closing
- —
- Monthly P&I
- —
- Monthly cashflow
- —
- DSCR
- —
- Eligible?
- —
Personal DTI + credit; lowest rate.
DSCR
20% down · 8.5% · 30yr
- Down + closing
- —
- Monthly P&I
- —
- Monthly cashflow
- —
- DSCR
- —
- Eligible?
- —
No personal income docs; deal must DSCR.
Hard money
10% down · 12.0% · 12mo
- Down + closing
- —
- Monthly P&I
- —
- Monthly cashflow
- —
- DSCR
- —
- Eligible?
- —
Short-term bridge; refi at stabilization.
Rent comps 3 comps
| Address | Beds | Baths | Sqft | Rent | $/sqft | DOM | Units | Dist |
|---|---|---|---|---|---|---|---|---|
| 504 Cedar Orchard Dr W Blacksburg, VA | 4.0 | 2.5 | 2946 | $2,300 | $0.78 | 44d | 1 | 0.12mi |
| 904 Kentwood Dr Blacksburg, VA | 4.0 | 3.5 | 2200 | $2,800 | $1.27 | 44d | 1 | 0.60mi |
| 1320 N Main St Blacksburg, VA | 3.0 | 1.5 | 1947 | $2,100 | $1.08 | 44d | 1 | 1.28mi |
Listing history 21 events
-
2026-06-17status $379,500 Pending 46 DOM
-
2026-06-16days on market $379,500 Active 46 DOM
-
2026-06-15days on market $379,500 Active 45 DOM
-
2026-06-14days on market $379,500 Active 43 DOM
-
2026-06-13days on market $379,500 Active 42 DOM
-
2026-06-10days on market $379,500 Active 40 DOM
-
2026-06-09days on market $379,500 Active 39 DOM
-
2026-06-08days on market $379,500 Active 38 DOM
-
2026-06-07days on market $379,500 Active 37 DOM
-
2026-06-05days on market $379,500 Active 34 DOM
-
2026-06-03days on market $379,500 Active 33 DOM
-
2026-06-02days on market $379,500 Active 32 DOM
-
2026-06-01days on market $379,500 Active 31 DOM
-
2026-05-31days on market $379,500 Active 30 DOM
-
2026-05-30days on market $379,500 Active 29 DOM
-
2026-05-15price $379,500 960-char remark
-
2026-05-01$389,500 Active 960-char remark
-
2024-07-10historical $1,800
-
2024-07-03$1,800
-
2022-03-24soldstatus $319,750 711-char remark
Show marketing remark (711 chars)
Welcome to 431 Alleghany Street! This well-loved, one-owner, home is looking for someone to make it their own! Less than 1 mile from Downtown Blacksburg, this lovely home has hardwood floors, a beautiful living room with bright windows, a large eat-in kitchen, and a massive sunroom/bonus room. The basement is partially finished with a bathroom and was previously a 3rd non-conforming bedroom with a closet - perfect for a guest suite, office, or flex space! The flat yard, adjacent to a wooded lot, is partially fenced in the front and fully fenced in the back. Enjoy the screened in porch or the patio in the warmer months and the fireplace in the sunroom when the weather cools down. This home is a charmer!
-
2022-02-23$315,000 711-char remark
Show marketing remark (711 chars)
Welcome to 431 Alleghany Street! This well-loved, one-owner, home is looking for someone to make it their own! Less than 1 mile from Downtown Blacksburg, this lovely home has hardwood floors, a beautiful living room with bright windows, a large eat-in kitchen, and a massive sunroom/bonus room. The basement is partially finished with a bathroom and was previously a 3rd non-conforming bedroom with a closet - perfect for a guest suite, office, or flex space! The flat yard, adjacent to a wooded lot, is partially fenced in the front and fully fenced in the back. Enjoy the screened in porch or the patio in the warmer months and the fireplace in the sunroom when the weather cools down. This home is a charmer!
ⓘ Source: listings_history table (triggers on properties + properties_extension) + one-shot
backfill from property_details.listing_events for pre-trigger history.
Tax reassessment forecast VA · Resets to sale price
- Current annual tax
- $2,177 · $181/mo
- Projected year-2 tax
- $3,112 · $259/mo
- Expected delta
- +$935/yr (+$78/mo · 43.0%)
ⓘ Screening estimate from a state-policy table — verify with the county assessor before closing.
Climate risk First Street
- Flood 1/10 Low FEMA zone X (unshaded) · 0% chance over 30 yrs
- Wildfire 3/10 Moderate
- Heat 3/10 Moderate 5 d/yr ≥95°F today · 13 d/yr by 30 yrs out
- Wind 2/10 Low 100% chance of damaging wind over 30 yrs
- Air quality 1/10 Low 0 unhealthy d/yr today · 0 by 30 yrs out
Nearby sold comps map
Loading sold comps map…
Walkable amenities ~0.75 mi
Loading nearby amenities…
Taxation est. · year 1
- Rental income
- $28,796
- − Mortgage interest
- −$21,258
- − Property taxes
- −$2,177
- − Insurance
- −$1,898
- − Repairs & maintenance
- −$2,304
- − Management
- −$2,304
- − Depreciation
- −$11,040
- Taxable loss
- −$12,184
- Est. tax savings @ 24.0%
- +$2,924
- After-tax cash flow
- $-2,283/yr
For passive investors: Depreciation is non-cash, so a rental often shows a tax loss while cash-flowing — sheltering income. Rental losses are passive: they offset passive income freely, and up to $25,000/yr can offset ordinary (W-2) income if you actively participate and your MAGI is under $100k (phasing out to $0 by $150k); unused losses carry forward. On sale, claimed depreciation is recaptured at up to 25%, and gains may owe capital-gains tax (a 1031 exchange can defer both). Figures are a year-1 estimate at your 24.0% rate — not tax advice; consult a CPA.
Schools (NCES district)
- District
- Montgomery County Public School District
- NCES district ID
- 5102520
- Math proficiency
- 57% ▼ -29.00%
- Reading proficiency
- 70% ▼ -11.00%
- Median HH income
- $46,618
- Composite
- 53.6/100
- National rank
- #1440
- State rank
- #47 of 131 in VA
Livability — Blacksburg
- Score
- 88/100
- State rank
- #8
- US rank
- #215
Category grades
Schools grade is shown separately in the Schools card above.
Census & demographics
- Census place
- Blacksburg, VA
- County
- Montgomery County · 78,218 people
- City population
- 48,541
- Metro
- Blacksburg-Christiansburg, VA
- Population (ZIP)
- 48,541
- Household income
- $67,675
- Rent vs Own
- Severe rent burden
- 3694.0
Population outlook (Montgomery County) Hauer SSP2
- Today (2025)
- 105,748 people
- By 2030
- 110,301 · +4.3%
- By 2040
- 115,652 · +9.4%
- By 2050
- 119,651 · +13.1%
- By 2075
- 126,005 · +19.2%
- By 2100
- 129,771 · +22.7%
Race, ethnicity, and origin ACS 2023
- Neighborhood character
- Predominantly White (80%)
- Race & ethnicity
- White 80% Asian 8% Two or more races 4% Hispanic / Latino 4% Black 3%
- Common ancestry
- Romanian 3% Italian 3% Slovak 2%
- Foreign-born
- 14% · China, Canada, South Korea
- Languages at home
- 86% English-only · Other Indo-European 4% Chinese 3% Spanish 3%
Political lean MEDSL · Montgomery
- 2024 margin
- Toss-up / Even · D 50.9% · R 47.4% · Other 1.7%
- 2008→2024 swing
- -1.4pp toward R · 2008: 4.9pp · 2024: 3.5pp
- All cycles
- 2024: D+3.5 2020: D+5.8 2016: D+1.3 2012: R+0.2 2008: D+4.9
Not yet ingested
- Civics
- —
Market trends
- HPI YoY
- ▼ -176.54%
- Current HPI
- 289.8166
- Rent YoY
- ▲ 3.95%
- Metro
- Blacksburg-Christiansburg, VA
- State GDP YoY
- ▲ 2.40%
- F500 in state
- 50
Industry mix (Fortune 500 HQ in VA)
| Industry | F500 HQs | Revenue |
|---|---|---|
| Aerospace / Defense | 4 | $236B |
|
||
| Technology / Defense | 3 | $32B |
|
||
| Financial Services | 2 | $176B |
|
||
| Utilities | 2 | $27B |
|
||
| Insurance | 2 | $25B |
|
||
| Technology | 2 | $15B |
|
||
Price history
+20.5% since first listed7 events — show timeline
- 2026-06-16 Pending — NRVMLS
- 2026-05-15 Price Changed $379,500 NRVMLS
- 2026-05-01 Listed $389,500 NRVMLS
- 2024-07-10 Rental Removed $1,800 APPFOLIO
- 2024-07-03 Listed for Rent $1,800 APPFOLIO
- 2022-03-24 Sold (MLS) $319,750 NRVMLS
- 2022-02-23 Listed $315,000 NRVMLS
Property tax history
+2.4%/yrLatest (2025): $2,177 · +1.3% YoY. Source: county tax records.
Cash-flow waterfall
monthlySold comps — $/sqft
last 12 mo · ≤1 miLoading sold comps…