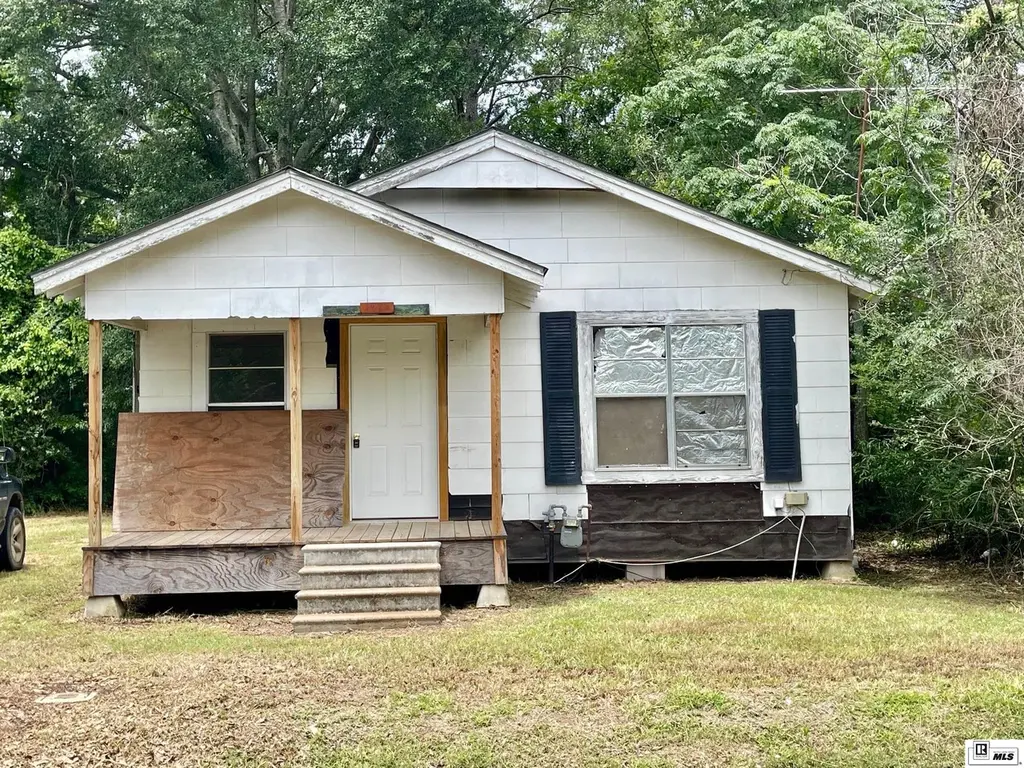
1214 Oak St · Winnsboro, LA
Flood risk 1/10 · Minimal
- FEMA flood zone
- X (unshaded)
- Chance of flooding over 30 yrs
- 0.0%
- Est. flood insurance / yr
- $507 – $1,088
Fire risk 3/10 · Minor
- Est. fire insurance / yr
- $1,269 – $2,357
Heat risk 8/10 · Major
- Hot days now (above 111°F)
- 7 days/yr
- Hot days in 30 yrs
- 19 days/yr
Wind risk 8/10 · Major
- Chance of severe wind over 30 yrs
- 80.0%
Air-quality risk 1/10 · Minimal
- Unhealthy air days now
- 0 days/yr
- Unhealthy air days in 30 yrs
- 0 days/yr
Risk factors via First Street. Map © Google.
Why this score? — see what drove the D+ grade
The composite is a weighted blend of 9 inputs, each scored 0–100. Each bar is that input's sub-score; the figure is the points it added to the 100-point composite (weight × sub-score).
- Cash flow +15.0/30.0
- ARV discount +15.0/15.0
- 1% rule +5.0/10.0
- DSCR +5.0/10.0
- Livability +3.0/5.0
- Rent growth +2.5/5.0
- Condition / age +2.5/5.0
- Schools +1.5/10.0
- Appreciation +0.0/10.0
$38,000
🖨 Deal sheet 📄 Offer letter ✓ Due diligence
Listing remarks MLS
Investment opportunity with great rental income potential!!! Interior has been remodeled with paint, flooring, vent hood, and cabinets within last few months. Added a new front porch and has good size back yard. Call today to schedule your private Showing!!!
Key facts
- Remodeled interior
- New front porch
- Good size back yard
Tags
Neighborhood map
What this means for you Summary
Snapshot
- This is a 2-bed/1.0-bath single-family listed at $38k.
Deal economics
- At list price, monthly cash flow is $1k ($15k/yr) — positive.
- The deal already cash-flows at list — no discount required.
- Meets the 1% rule at list price ($2k rent vs $38k).
- Recommended offer: $33k (12.0% below list) — sets the bar for market timing.
Location & tenants
- Location reads 59/100 on livability (#278 in LA) — a working-class tenant base; expect higher turnover. Strengths: cost of living A+; Watch: health & safety D, schools F, crime D-.
- Franklin Parish (rural): math 14% / reading 22% proficiency, ranked #71 of 98 in LA (top 72%) — low school quality limits family demand, transient renter base, plan for 1-2y turnover; 78% free/reduced lunch — lower-income household profile, screen leases tightly.
- Market conditions: 44 active listings in the ZIP; 17 units permitted in Franklin Parish in 2024 (0 in 5+ unit buildings).
Forward outlook
- Local home prices are declining (-3.0%/yr); year-one equity from $263 of loan paydown is wiped out by about $1k of value loss. Plan a longer hold.
- Franklin County population projected at -14% by 2050 — secular population decline; favor cash flow + early exit over multi-decade hold.
- At projected returns (-3.0% appreciation + 3.0% rent growth), your $11k cash investment doubles in ~1 year — after that, you're playing with house money.
Negotiation context
- It's been on market 357 days — a 12% lower offer ($33k) is reasonable based on typical stale-listing flexibility.
Risks & watch-outs
- Climate carrying-cost: severe wind risk, 80% chance of damaging wind over 30y; extreme-heat days projected 7→19/yr by 2055 (HVAC capex compounding) — expect insurance premiums to compound above CPI over the hold.
Questions for the listing agent
- It's been on market 357 days. Have you received any prior offers? Is the seller open to a 12% concession, seller financing, or rate buy-down credit?
- Why hasn't it sold? Are there any deal-killer items the seller is aware of (foundation, flood, title, zoning, code violations)?
- Is there a deadline driving the sale (1031 exchange, divorce, estate, relocation)? That informs how much negotiation room exists.
- Schools are F-rated, which usually means shorter tenancies and higher turnover. Who's the typical renter profile here, and what's been the actual vacancy rate?
- Crime grade is D in this area — have there been break-ins, vandalism, or insurance claims at this property in the last 3 years? What carrier currently insures it and at what premium?
- The area grade is low — what's the realistic commute time and amenity access for the typical tenant pool here? Any planned neighborhood developments (good or bad) we should know about?
- What's the average days-on-market for RENTAL listings here right now (not sales)? A rising rental-DOM trend means longer vacancies and softer asking-rent achievability than the comps imply.
- What's the recent tenant-quality profile in this submarket — average credit score on applications, eviction rate, late-payment / NSF rate, and stable-employment percentage? A property-management company in the area should have these aggregated.
- How much new for-sale + rental construction is in the pipeline within 1–3 miles? Heavy new supply typically softens prices + rents 12–24 months out; constrained supply supports both.
Investment metrics
- 1% rule
- 4.91% ✓
- Cap rate
- 45.34%
- Cash-on-cash
- 139.44%
- DSCR
- 7.20
- GRM
- 1.7
CMA / ARV
- ARV (median comp)
- $53,372
- List price
- $38,000
- Delta
- -28.80%
- Verdict
- UNDERPRICED
- Comps
- 4 within 1.0 mi
Projected returns pro-forma
-3.0% appreciation · 3.0% rent growth · sell at horizon
- IRR
- —
- Equity multiple
- 7.82×
- Total profit
- $72,600
- Equity at exit
- $5,666
- IRR
- —
- Equity multiple
- 16.48×
- Total profit
- $164,667
- Equity at exit
- $3,286
Cash invested: $10,640 (down + closing). Projections, not guarantees.
Landlord ↔ Tenant lean methodology
- Overall (STATE)
- 90 Strongly Landlord-Friendly
- State Louisiana
- 90 Strongly Landlord-Friendly · R+12
- County
- — inherits STATE
- City
- — inherits STATE
ZIP-level market 71295
- Home prices YoY
- -20.6%
- Active inventory
- 44
- Price-to-rent
- 1.7×
Monthly cashflow live
- Estimated rent
- $1,865 medium interval (Pro) →
- Mortgage (P&I)
- −$199
- Tax from tax record
- −$22 /mo · $259/yr
- Insurance
- −$16
- HOA
- −$0
- Vacancy / Maint / Mgmt
- −$392
- Net cashflow
- $1,236
Break-even live
UW: 25.0% down · 7.5% · 30yr · 1.5% tax · 5.0% vac · 8.0% maint · 8.0% mgmt
Financing live
Cash to close
- Down payment
- $9,500
- Closing costs
- $1,140
- Reserves months
- —
- Total cash needed
- —
Loan-product check · same deal, 3 products live
Conventional
25% down · 7.5% · 30yr
- Down + closing
- —
- Monthly P&I
- —
- Monthly cashflow
- —
- DSCR
- —
- Eligible?
- —
Personal DTI + credit; lowest rate.
DSCR
20% down · 8.5% · 30yr
- Down + closing
- —
- Monthly P&I
- —
- Monthly cashflow
- —
- DSCR
- —
- Eligible?
- —
No personal income docs; deal must DSCR.
Hard money
10% down · 12.0% · 12mo
- Down + closing
- —
- Monthly P&I
- —
- Monthly cashflow
- —
- DSCR
- —
- Eligible?
- —
Short-term bridge; refi at stabilization.
Listing history 12 events
-
2026-06-09status $38,000 Pending 357 DOM
-
2026-06-08days on market $38,000 Active 357 DOM
-
2026-06-07days on market $38,000 Active 356 DOM
-
2026-06-07days on market $38,000 Active 355 DOM
-
2026-06-04days on market $38,000 Active 352 DOM
-
2026-06-02days on market $38,000 Active 351 DOM
-
2026-06-01days on market $38,000 Active 350 DOM
-
2026-05-31days on market $38,000 Active 349 DOM
-
2026-05-31days on market $38,000 Active 348 DOM
-
2025-12-03price $38,000 258-char remark
Show marketing remark (258 chars)
Investment opportunity with great rental income potential!!! Interior has been remodeled with paint, flooring, vent hood, and cabinets within last few months. Added a new front porch and has good size back yard. Call today to schedule your private Showing!!!
-
2025-06-13$45,000 Active 258-char remark
Show marketing remark (258 chars)
Investment opportunity with great rental income potential!!! Interior has been remodeled with paint, flooring, vent hood, and cabinets within last few months. Added a new front porch and has good size back yard. Call today to schedule your private Showing!!!
-
2010-07-30soldstatus
ⓘ Source: listings_history table (triggers on properties + properties_extension) + one-shot
backfill from property_details.listing_events for pre-trigger history.
Tax reassessment forecast LA · Resets to sale price
- Current annual tax
- $259 · $22/mo
- Projected year-2 tax
- $259 · $22/mo
- Expected delta
- $0/yr ($0/mo · 0.0%)
ⓘ Screening estimate from a state-policy table — verify with the county assessor before closing.
Climate risk First Street
- Flood 1/10 Low FEMA zone X (unshaded) · 0% chance over 30 yrs
- Wildfire 3/10 Moderate
- Heat 8/10 Severe 7 d/yr ≥111°F today · 19 d/yr by 30 yrs out
- Wind 8/10 Severe 80% chance of damaging wind over 30 yrs
- Air quality 1/10 Low 0 unhealthy d/yr today · 0 by 30 yrs out
Nearby sold comps map
Loading sold comps map…
Walkable amenities ~0.75 mi
Loading nearby amenities…
Taxation est. · year 1
- Rental income
- $22,376
- − Mortgage interest
- −$2,129
- − Property taxes
- −$259
- − Insurance
- −$190
- − Repairs & maintenance
- −$1,790
- − Management
- −$1,790
- − Depreciation
- −$1,105
- Taxable income
- $15,113
- Est. tax owed @ 24.0%
- −$3,627
- After-tax cash flow
- $11,210/yr
For passive investors: Depreciation is non-cash, so a rental often shows a tax loss while cash-flowing — sheltering income. Rental losses are passive: they offset passive income freely, and up to $25,000/yr can offset ordinary (W-2) income if you actively participate and your MAGI is under $100k (phasing out to $0 by $150k); unused losses carry forward. On sale, claimed depreciation is recaptured at up to 25%, and gains may owe capital-gains tax (a 1031 exchange can defer both). Figures are a year-1 estimate at your 24.0% rate — not tax advice; consult a CPA.
Schools (NCES district)
- District
- Franklin Parish
- NCES district ID
- 2200660
- Math proficiency
- 14% ▼ -42.00%
- Reading proficiency
- 22% ▼ -35.00%
- Median HH income
- $32,403
- Composite
- 14.55/100
- National rank
- #9416
- State rank
- #71 of 98 in LA
Livability — Winnsboro
- Score
- 59/100
- State rank
- #278
- US rank
- #20151
Category grades
Schools grade is shown separately in the Schools card above.
Census & demographics
- Census place
- Winnsboro, LA
- Population (ZIP)
- 14,008
Population outlook (Franklin County) Hauer SSP2
- Today (2025)
- 19,537 people
- By 2030
- 18,985 · -2.8%
- By 2040
- 17,886 · -8.5%
- By 2050
- 16,828 · -13.9%
- By 2075
- 14,273 · -26.9%
- By 2100
- 11,435 · -41.5%
Race, ethnicity, and origin ACS 2023
- Neighborhood character
- Majority White (61%)
- Race & ethnicity
- White 61% Black 33% Two or more races 4% Hispanic / Latino 2%
- Common ancestry
- Lithuanian 2% Italian 1% Slovak 1%
- Foreign-born
- 0%
- Languages at home
- 96% English-only · Spanish 2% French/Haitian/Cajun 1%
Political lean MEDSL · Franklin
- 2024 margin
- Solid R (+49.2) · D 25.0% · R 74.2%
- 2008→2024 swing
- -13.7pp toward R · 2008: -35.5pp · 2024: -49.2pp
- All cycles
- 2024: R+49.2 2020: R+44.4 2016: R+43.8 2012: R+36.1 2008: R+35.5
Not yet ingested
- Civics
- —
Market trends
- HPI YoY
- ▼ -35.67%
- Current HPI
- 137.0883
- Rent YoY
- —
- Metro
- —
- State GDP YoY
- ▲ 3.29%
- F500 in state
- 10
Industry mix (Fortune 500 HQ in LA)
| Industry | F500 HQs | Revenue |
|---|---|---|
| Telecommunications | 2 | $23B |
|
||
| Utilities | 1 | $12B |
|
||
| Wholesale / Distribution | 1 | $5B |
|
||
| Advertising | 1 | $2B |
|
||
Price history
-15.6% since first listed3 events — show timeline
- 2025-12-03 Price Changed $38,000 NELABOR
- 2025-06-13 Listed $45,000 NELABOR
- 2010-07-30 Sold (Public Records) — Public Records
Property tax history
+3.0%/yrLatest (2025): $259 · +0.1% YoY. Source: county tax records.
Cash-flow waterfall
monthlySold comps — $/sqft
last 12 mo · ≤1 miLoading sold comps…