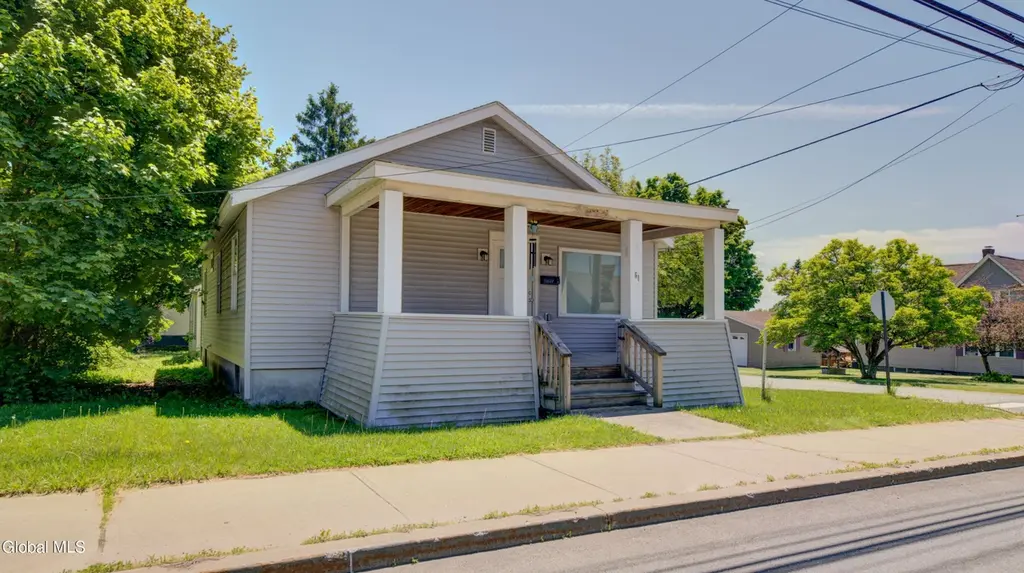
261 Church St · Amsterdam, NY
Flood risk 1/10 · Minimal
- FEMA flood zone
- X (unshaded)
- Chance of flooding over 30 yrs
- 0.0%
- Est. flood insurance / yr
- $473 – $860
Fire risk 1/10 · Minimal
- Est. fire insurance / yr
- $691 – $1,283
Heat risk 3/10 · Minor
- Hot days now (above 95°F)
- 7 days/yr
- Hot days in 30 yrs
- 17 days/yr
Wind risk 3/10 · Minor
- Chance of severe wind over 30 yrs
- 4.0%
Air-quality risk 1/10 · Minimal
- Unhealthy air days now
- 0 days/yr
- Unhealthy air days in 30 yrs
- 0 days/yr
Risk factors via First Street. Map © Google.
Why this score? — see what drove the D- grade
The composite is a weighted blend of 9 inputs, each scored 0–100. Each bar is that input's sub-score; the figure is the points it added to the 100-point composite (weight × sub-score).
- Appreciation +10.0/10.0
- Cash flow +7.4/30.0
- Livability +3.8/5.0
- Schools +3.2/10.0
- ARV discount +3.0/15.0
- Rent growth +2.5/5.0
- Condition / age +2.5/5.0
- 1% rule +1.9/10.0
- DSCR +1.5/10.0
$215,000
🖨 Deal sheet 📄 Offer letter ✓ Due diligence
Listing remarks
Thoughtfully updated and impeccably maintained, this charming one floor bungalow sits proudly on a corner lot with easy access to Route 67, Route 5, and the NYS Thruway, offering both convenience and comfort in one beautiful package. From the moment you step inside, you'll appreciate the care and attention poured into every detail of this thoughtfully remodeled home, featuring a bright and inviting living room, a dedicated dining room perfect for entertaining, and a beautifully updated kitchen complete with all the bells and whistles today's buyers are looking for. The home offers three generously sized bedrooms with ample closet space, along with a practical mudroom, attached one-car garag
Key facts
- Updated kitchen
- Corner lot
- 6,534 sq ft lot
Tags
Property features AI
Exterior
- Parking: Attached garage (1 car); Two parking spaces total; Off-street paved parking and driveway
- Utilities: Public water; Public sewer
- Home design: Single family residence; Located on a corner lot
- Construction: Vinyl siding; Shingle roof
- Exterior features: Front porch; Paved driveway; Exterior lighting; Garage(s) structure
Interior
- Kitchen: Dishwasher; Oven; Refrigerator
- Bedrooms: Three bedrooms on the first floor
- Bathrooms: One full bathroom on the first floor
- Heating & cooling: Natural gas heating
- Interior features: Seven total rooms; Full basement
- Laundry & utility: Laundry in basement; Mud room on the first floor
Neighborhood map
What this means for you Summary
Snapshot
- This is a 3-bed/1.0-bath single-family listed at $215k.
Deal economics
- At list price, monthly cash flow is $-281 ($-3k/yr) — negative.
- To cash-flow at today's rent, offer at most $165k (23.1% below list).
- To meet the 1% rule (rent ≥ 1% of price), the offer needs to be $148k (31.4% below list).
- Recommended offer: $148k (31.4% below list) — sets the bar for 1% rule.
- Cap rate 4.7% vs local median 6.3% in Amsterdam — below-typical yield; the buyer is paying a premium for something (appreciation thesis, condition, location) that the cap rate doesn't capture.
Location & tenants
- Location reads 75/100 on livability (#247 in NY, #3,884 nationally) — a middle-class / working-renter tenant base. Strengths: cost of living A+, housing A+, health & safety A+; Watch: crime F, employment F.
- Amsterdam City School District (town): math 35% / reading 41% proficiency, ranked #546 of 590 in NY (top 92%) — families likely to look elsewhere, expect single-tenant / working-renter base with shorter leases.
- Zoned schools: Amsterdam High School (math 75% / reading 82%, grade A-, #563 of 1,100 statewide, top 52%, 1,179 students, 68% FRL) — zoned schools average 68% FRL vs 40% district-wide (28 pts higher); higher-poverty schools than district average — tighter screening recommended.
- Zoned-school proficiency averages 78% at this address vs 38% district-wide (+40 pts) — the actual schools serving this property are materially stronger than the Amsterdam City School District average implies; a family-tenant draw the district grade alone would hide.
- Market conditions: 164 active listings in the ZIP; 7 comparable units currently listed for rent nearby; rentals at typical pace (median 19d on market — plan ~3-4 weeks tenant-placement turnaround); 210 units permitted in Montgomery County in 2024 (168 in 5+ unit buildings).
Forward outlook
- In year one you build about $23k of equity ($1k loan paydown + $22k appreciation (10.0% local appreciation)).
- Montgomery County population projected at -11% by 2050 — secular population decline; favor cash flow + early exit over multi-decade hold.
- By year 2, paydown + projected appreciation supports a ~$37k cash-out refi (75% LTV) — recoverable capital for the next deal without selling this one.
Negotiation context
- Only 6 days on market — expect competitive offers; lowballing is unlikely to land.
Risks & watch-outs
- Watch-outs: built in 1949 — expect roof / HVAC / electrical / plumbing capex.
Questions for the listing agent
- What do current leases actually rent for vs. the listed asking? Can we see a recent rent roll and the last 12 months of T-12 income?
- Built in 1949 — when were the roof, HVAC, electrical panel, plumbing, and water heater last replaced?
- Is there a deadline driving the sale (1031 exchange, divorce, estate, relocation)? That informs how much negotiation room exists.
- Schools are D-rated, which usually means shorter tenancies and higher turnover. Who's the typical renter profile here, and what's been the actual vacancy rate?
- Crime grade is F in this area — have there been break-ins, vandalism, or insurance claims at this property in the last 3 years? What carrier currently insures it and at what premium?
- The area grade is low — what's the realistic commute time and amenity access for the typical tenant pool here? Any planned neighborhood developments (good or bad) we should know about?
- What's the average days-on-market for RENTAL listings here right now (not sales)? A rising rental-DOM trend means longer vacancies and softer asking-rent achievability than the comps imply.
- What's the recent tenant-quality profile in this submarket — average credit score on applications, eviction rate, late-payment / NSF rate, and stable-employment percentage? A property-management company in the area should have these aggregated.
- How much new for-sale + rental construction is in the pipeline within 1–3 miles? Heavy new supply typically softens prices + rents 12–24 months out; constrained supply supports both.
Investment metrics
- 1% rule
- 0.69% ✗
- Cap rate
- 4.73%
- Cash-on-cash
- -5.60%
- DSCR
- 0.75
- GRM
- 12.1
CMA / ARV
- ARV (on-the-fly)
- $195,264
- Comps found
- 6
Show comp detail 6 sales within ~0.75 mi
| Address | Dist | Beds/Ba | Sqft | Sold | Price | $/sf | Match |
|---|---|---|---|---|---|---|---|
| 34 Gorski St | 0.21mi | 3/1.0 | 900 (+4%) | 13mo | $162,800 | $181 | 72 |
| 45 Lodge St | 0.23mi | 3/1.0 | 928 (+7%) | 12mo | $210,000 | $226 | 67 |
| 15 Catherine St | 0.12mi | 2/1.0 (-1) | 952 (+10%) | 14mo | $225,000 | $236 | 61 |
| 21 Julia St | 0.12mi | 2/1.0 (-1) | 962 (+11%) | 14mo | $210,000 | $218 | 59 |
| 237 Vrooman Ave | 0.61mi | 2/1.5 (-1) | 832 (-4%) | 2mo | $80,000 | $96 | 57 |
| 11 Peter Ln | 0.64mi | 3/1.0 | 960 (+11%) | 8mo | $222,500 | $232 | 45 |
Match score weights: distance 35% · size 25% · config 20% · recency 20%. Top-matched comps best support the ARV.
Projected returns pro-forma
10.0% appreciation · 3.0% rent growth · sell at horizon
- IRR
- 20.3%
- Equity multiple
- 2.65×
- Total profit
- $99,207
- Equity at exit
- $193,689
- IRR
- 18.5%
- Equity multiple
- 6.09×
- Total profit
- $306,211
- Equity at exit
- $417,698
Cash invested: $60,200 (down + closing). Projections, not guarantees.
Landlord ↔ Tenant lean methodology
- Overall (STATE)
- 15 Strongly Tenant-Friendly
- State New York
- 15 Strongly Tenant-Friendly · D+10
- County
- — inherits STATE
- City
- — inherits STATE
ZIP-level market 12010
- Home prices YoY
- 4.0%
- Active inventory
- 164
- Price-to-rent
- 12.1×
Monthly cashflow live
- Estimated rent
- $1,476 high interval (Pro) →
- Mortgage (P&I)
- −$1,127
- Tax from tax record
- −$230 /mo · $2,754/yr
- Insurance
- −$90
- HOA
- −$0
- Vacancy / Maint / Mgmt
- −$310
- Net cashflow
- $-281
Break-even live
UW: 25.0% down · 7.5% · 30yr · 1.5% tax · 5.0% vac · 8.0% maint · 8.0% mgmt
Financing live
Cash to close
- Down payment
- $53,750
- Closing costs
- $6,450
- Reserves months
- —
- Total cash needed
- —
Loan-product check · same deal, 3 products live
Conventional
25% down · 7.5% · 30yr
- Down + closing
- —
- Monthly P&I
- —
- Monthly cashflow
- —
- DSCR
- —
- Eligible?
- —
Personal DTI + credit; lowest rate.
DSCR
20% down · 8.5% · 30yr
- Down + closing
- —
- Monthly P&I
- —
- Monthly cashflow
- —
- DSCR
- —
- Eligible?
- —
No personal income docs; deal must DSCR.
Hard money
10% down · 12.0% · 12mo
- Down + closing
- —
- Monthly P&I
- —
- Monthly cashflow
- —
- DSCR
- —
- Eligible?
- —
Short-term bridge; refi at stabilization.
Rent comps 7 comps
| Address | Beds | Baths | Sqft | Rent | $/sqft | DOM | Units | Dist |
|---|---|---|---|---|---|---|---|---|
| 17 Grand St Amsterdam, NY | 4.0 | 1.0 | 1098 | $1,400 | $1.28 | 23d | 1 | 0.72mi |
| 255 Main St Amsterdam, NY | 2.0 | 1.0 | 800 | $1,400 | $1.75 | 14d | 1 | 0.84mi |
| 30 Kline St Amsterdam, NY | 2.0 | 1.0 | 800 | $1,300 | $1.62 | 19d | 1 | 0.89mi |
| 7 Hewitt St Amsterdam, NY | 3.0 | 1.0 | 967 | $1,700 | $1.76 | 43d | 1 | 0.96mi |
| 7 Hewitt St Amsterdam, NY | 3.0 | 1.0 | 967 | $1,700 | $1.76 | 14d | 1 | 0.96mi |
| 70 Wall St Amsterdam, NY | 3.0 | 1.0 | 1098 | $1,300 | $1.18 | 19d | 1 | 1.18mi |
| 62 Glen Ave Amsterdam, NY | 3.0 | 1.0 | 1115 | $1,550 | $1.39 | 23d | 1 | 1.22mi |
Listing history 6 events
-
2026-06-03status $215,000 Pending 6 DOM
-
2026-06-02days on market $215,000 Active 6 DOM
-
2026-06-01days on market $215,000 Active 5 DOM
-
2026-05-31days on market $215,000 Active 4 DOM
-
2026-05-31days on market $215,000 Active 3 DOM
-
2026-05-27$215,000 Active
ⓘ Source: listings_history table (triggers on properties + properties_extension) + one-shot
backfill from property_details.listing_events for pre-trigger history.
Tax reassessment forecast NY · Partial reset (capped growth)
- Current annual tax
- $2,754 · $230/mo
- Projected year-2 tax
- $3,194 · $266/mo
- Expected delta
- +$440/yr (+$37/mo · 16.0%)
ⓘ Screening estimate from a state-policy table — verify with the county assessor before closing.
Climate risk First Street
- Flood 1/10 Low FEMA zone X (unshaded) · 0% chance over 30 yrs
- Wildfire 1/10 Low
- Heat 3/10 Moderate 7 d/yr ≥95°F today · 17 d/yr by 30 yrs out
- Wind 3/10 Moderate 4% chance of damaging wind over 30 yrs
- Air quality 1/10 Low 0 unhealthy d/yr today · 0 by 30 yrs out
Nearby sold comps map
Loading sold comps map…
Walkable amenities ~0.75 mi
Loading nearby amenities…
Taxation est. · year 1
- Rental income
- $17,708
- − Mortgage interest
- −$12,043
- − Property taxes
- −$2,754
- − Insurance
- −$1,075
- − Repairs & maintenance
- −$1,417
- − Management
- −$1,417
- − Depreciation
- −$6,255
- Taxable loss
- −$7,253
- Est. tax savings @ 24.0%
- +$1,741
- After-tax cash flow
- $-1,629/yr
For passive investors: Depreciation is non-cash, so a rental often shows a tax loss while cash-flowing — sheltering income. Rental losses are passive: they offset passive income freely, and up to $25,000/yr can offset ordinary (W-2) income if you actively participate and your MAGI is under $100k (phasing out to $0 by $150k); unused losses carry forward. On sale, claimed depreciation is recaptured at up to 25%, and gains may owe capital-gains tax (a 1031 exchange can defer both). Figures are a year-1 estimate at your 24.0% rate — not tax advice; consult a CPA.
Schools (NCES district)
- District
- Amsterdam City School District
- NCES district ID
- 3602970
- Math proficiency
- 35% ▲ 5.00%
- Reading proficiency
- 41% ▲ 10.00%
- Median HH income
- $41,735
- Composite
- 32.03/100
- National rank
- #5824
- State rank
- #546 of 590 in NY
Livability — Amsterdam
- Score
- 75/100
- State rank
- #247
- US rank
- #3884
Category grades
Schools grade is shown separately in the Schools card above.
Census & demographics
- Census place
- Amsterdam, NY
- City population
- 27,339
- Population (ZIP)
- 27,339
Population outlook (Montgomery County) Hauer SSP2
- Today (2025)
- 48,683 people
- By 2030
- 47,785 · -1.8%
- By 2040
- 45,492 · -6.6%
- By 2050
- 43,161 · -11.3%
- By 2075
- 38,134 · -21.7%
- By 2100
- 32,337 · -33.6%
Race, ethnicity, and origin ACS 2023
- Neighborhood character
- Predominantly White (68%)
- Race & ethnicity
- White 68% Hispanic / Latino 23% Two or more races 9% Black 4% Asian 1%
- Hispanic origin (detail)
- Mexican 2% Puerto Rican 18%
- Common ancestry
- Romanian 12% Lithuanian 2% Iranian 2%
- Foreign-born
- 5% · Canada
- Languages at home
- 86% English-only · Spanish 11% Russian/Polish/Slavic 1% Other Indo-European 1%
Political lean MEDSL · Montgomery
- 2024 margin
- Strong R (+28.7) · D 35.6% · R 64.4%
- 2008→2024 swing
- -20.6pp toward R · 2008: -8.1pp · 2024: -28.7pp
- All cycles
- 2024: R+28.7 2020: R+22.6 2016: R+26.5 2012: R+4.4 2008: R+8.1
Not yet ingested
- Civics
- —
Market trends
- HPI YoY
- ▲ 12.12%
- Current HPI
- 312.4966
- Rent YoY
- —
- Metro
- —
- State GDP YoY
- ▲ 2.60%
- F500 in state
- 92
Industry mix (Fortune 500 HQ in NY)
| Industry | F500 HQs | Revenue |
|---|---|---|
| Financial Services | 10 | $950B |
|
||
| Consumer Goods | 9 | $162B |
|
||
| Insurance | 4 | $225B |
|
||
| Telecommunications | 2 | $144B |
|
||
| Pharmaceuticals | 2 | $112B |
|
||
| Media / Entertainment | 2 | $69B |
|
||
Price history
1 event — show timeline
- 2026-05-27 Listed $215,000 Global MLS
Property tax history
+2.2%/yrLatest (2025): $2,754 · -5.4% YoY. Source: county tax records.
Cash-flow waterfall
monthlySold comps — $/sqft
last 12 mo · ≤1 miLoading sold comps…