1216 Alisa Ln · Arlington, TX
Flood risk 1/10 · Minimal
- FEMA flood zone
- X (unshaded)
- Chance of flooding over 30 yrs
- 0.0%
- Est. flood insurance / yr
- $507 – $1,088
Fire risk 2/10 · Minimal
- Est. fire insurance / yr
- $1,222 – $2,270
Heat risk 8/10 · Major
- Hot days now (above 110°F)
- 7 days/yr
- Hot days in 30 yrs
- 24 days/yr
Wind risk 6/10 · Moderate
- Chance of severe wind over 30 yrs
- 27.0%
Air-quality risk 3/10 · Minor
- Unhealthy air days now
- 2 days/yr
- Unhealthy air days in 30 yrs
- 4 days/yr
Risk factors via First Street. Map © Google.
Why this score? — see what drove the D+ grade
The composite is a weighted blend of 9 inputs, each scored 0–100. Each bar is that input's sub-score; the figure is the points it added to the 100-point composite (weight × sub-score).
- ARV discount +15.0/15.0
- Cash flow +11.1/30.0
- 1% rule +5.6/10.0
- Livability +3.9/5.0
- Rent growth +3.5/5.0
- DSCR +3.2/10.0
- Schools +2.5/10.0
- Condition / age +2.5/5.0
- Appreciation +0.0/10.0
$205,000
🖨 Deal sheet 📄 Offer letter ✓ Due diligence
Listing remarks MLS
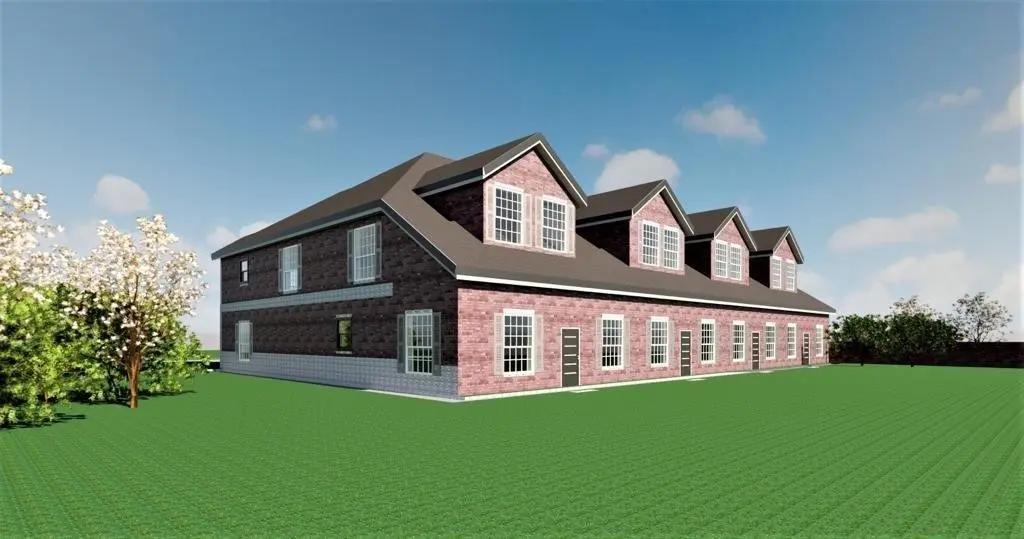
Rare Investment Opportunity 4-Unit Incomplete Structure! Discover the potential at 1214 -1220 Alisa Lane, a rare investment opportunity featuring a 4-unit multifamily structure, each with separate tax ID numbers. The property is currently incomplete, offering a blank slate for value added to investors or developers to finish out the build to suit rental, resale, or portfolio strategies. Each unit is framed and ready for completion, presenting a flexible layout ideal for multifamily income generation. With infrastructure in place and significant progress already made, this is an excellent opportunity to capitalize on the growing demand for housing in the area. Whether you're looking to finish and flip, hold for rental income, or complete as a condo conversion project this property is primed for returns. Sold as-is. Investor inquiries welcome.
Key facts
- Built 2022
- Listed 346 days
Neighborhood map
What this means for you Summary
Snapshot
- This is a 4-bed/3.5-bath townhouse listed at $205k.
Deal economics
- At list price, monthly cash flow is $-83 ($-993/yr) — negative.
- To cash-flow at today's rent, offer at most $190k (7.1% below list).
- Meets the 1% rule at list price ($2k rent vs $205k).
- Recommended offer: $180k (12.0% below list) — sets the bar for market timing.
- Cap rate 5.8% vs local median 3.7% in Arlington — top-decile yield for the area; either an underpriced asset or a hidden risk that comps aren't pricing in. Stress-test before assuming the spread holds.
Location & tenants
- Location reads 78/100 on livability (#75 in TX, #2,697 nationally) — a middle-class / working-renter tenant base. Strengths: amenities A+, cost of living A+, housing A+; Watch: schools D+, crime F, commute F.
- Arlington ISD (urban): math 24% / reading 34% proficiency, ranked #629 of 826 in TX (top 76%) — low school quality limits family demand, transient renter base, plan for 1-2y turnover.
- Market conditions: Rents rising fast (+4.1%/yr); 67 active listings in the ZIP; 24 comparable units currently listed for rent nearby; rentals at typical pace (median 15d on market — plan ~3-4 weeks tenant-placement turnaround); 18,938 units permitted in Tarrant County in 2024 (8,336 in 5+ unit buildings).
- This rent runs 43% of the median local income ($60k/yr) — at the standard rent-burdened threshold; future hikes will face affordability resistance.
Forward outlook
- Local home prices are declining (-3.0%/yr); year-one equity from $1k of loan paydown is wiped out by about $6k of value loss. Plan a longer hold.
- Tarrant County population projected at +41% by 2050 — long-run rental-demand tailwind backs the buy-and-hold thesis.
Negotiation context
- It's been on market 347 days — a 12% lower offer ($180k) is reasonable based on typical stale-listing flexibility.
- 9 sale attempts since 2y ago with the ask held roughly flat each time — persistent listings suggest the price (not the market) is what's stuck; bring a comps-based counter.
Risks & watch-outs
- Watch-outs: property tax is 3.8% of price.
- Climate carrying-cost: major wind risk, 27% chance of damaging wind over 30y; extreme-heat days projected 7→24/yr by 2055 (HVAC capex compounding) — expect insurance premiums to compound above CPI over the hold.
Questions for the listing agent
- What do current leases actually rent for vs. the listed asking? Can we see a recent rent roll and the last 12 months of T-12 income?
- It's been on market 347 days. Have you received any prior offers? Is the seller open to a 12% concession, seller financing, or rate buy-down credit?
- Property tax is high relative to price — has the assessment been appealed recently, and will the sale trigger a re-assessment?
- Why hasn't it sold? Are there any deal-killer items the seller is aware of (foundation, flood, title, zoning, code violations)?
- Is there a deadline driving the sale (1031 exchange, divorce, estate, relocation)? That informs how much negotiation room exists.
- Schools are D-rated, which usually means shorter tenancies and higher turnover. Who's the typical renter profile here, and what's been the actual vacancy rate?
- Crime grade is F in this area — have there been break-ins, vandalism, or insurance claims at this property in the last 3 years? What carrier currently insures it and at what premium?
- The area grade is low — what's the realistic commute time and amenity access for the typical tenant pool here? Any planned neighborhood developments (good or bad) we should know about?
- What's the average days-on-market for RENTAL listings here right now (not sales)? A rising rental-DOM trend means longer vacancies and softer asking-rent achievability than the comps imply.
- What's the recent tenant-quality profile in this submarket — average credit score on applications, eviction rate, late-payment / NSF rate, and stable-employment percentage? A property-management company in the area should have these aggregated.
- How much new for-sale + rental construction is in the pipeline within 1–3 miles? Heavy new supply typically softens prices + rents 12–24 months out; constrained supply supports both.
Investment metrics
- 1% rule
- 1.06% ✓
- Cap rate
- 5.81%
- Cash-on-cash
- -1.73%
- DSCR
- 0.92
- GRM
- 7.8
CMA / ARV
- ARV (median comp)
- $247,500
- List price
- $205,000
- Delta
- -17.17%
- Verdict
- UNDERPRICED
- Comps
- 11 within 1.0 mi
Projected returns pro-forma
-3.0% appreciation · 4.08% rent growth · sell at horizon
- IRR
- -17.4%
- Equity multiple
- 0.38×
- Total profit
- $-35,821
- Equity at exit
- $30,566
- IRR
- -6.9%
- Equity multiple
- 0.53×
- Total profit
- $-26,819
- Equity at exit
- $17,725
Cash invested: $57,400 (down + closing). Projections, not guarantees.
Landlord ↔ Tenant lean methodology
- Overall (STATE)
- 87 Strongly Landlord-Friendly
- State Texas
- 87 Strongly Landlord-Friendly · R+5
- County
- — inherits STATE
- City
- — inherits STATE
ZIP-level market 76014
- Home prices YoY
- -30.2%
- Rents YoY
- 4.1%
- Active inventory
- 67
- Price-to-rent
- 7.8×
Monthly cashflow live
- Estimated rent
- $2,182 high interval (Pro) →
- Mortgage (P&I)
- −$1,075
- Tax from tax record
- −$646 /mo · $7,756/yr
- Insurance
- −$85
- HOA
- −$0
- Vacancy / Maint / Mgmt
- −$458
- Net cashflow
- $-83
Break-even live
UW: 25.0% down · 7.5% · 30yr · 1.5% tax · 5.0% vac · 8.0% maint · 8.0% mgmt
Financing live
Cash to close
- Down payment
- $51,250
- Closing costs
- $6,150
- Reserves months
- —
- Total cash needed
- —
Loan-product check · same deal, 3 products live
Conventional
25% down · 7.5% · 30yr
- Down + closing
- —
- Monthly P&I
- —
- Monthly cashflow
- —
- DSCR
- —
- Eligible?
- —
Personal DTI + credit; lowest rate.
DSCR
20% down · 8.5% · 30yr
- Down + closing
- —
- Monthly P&I
- —
- Monthly cashflow
- —
- DSCR
- —
- Eligible?
- —
No personal income docs; deal must DSCR.
Hard money
10% down · 12.0% · 12mo
- Down + closing
- —
- Monthly P&I
- —
- Monthly cashflow
- —
- DSCR
- —
- Eligible?
- —
Short-term bridge; refi at stabilization.
Rent comps 24 comps
| Address | Beds | Baths | Sqft | Rent | $/sqft | DOM | Units | Dist |
|---|---|---|---|---|---|---|---|---|
| 1401 Nandina Dr Arlington, TX | 1.0–4.0 | 1.0–2.0 | 1031 | $2,160 | $2.10 | 1d | 47 | 0.23mi |
| 3510 Daniel Dr Arlington, TX | 3.0 | 2.0 | 1507 | $1,975 | $1.31 | 25d | 1 | 0.28mi |
| 1206 Brook Hill Ln Arlington, TX | 3.0 | 2.0 | 1590 | $1,995 | $1.25 | 3d | 1 | 0.34mi |
| 3501 Green Hill Dr Arlington, TX | 3.0 | 2.0 | 1340 | $2,499 | $1.86 | 44d | 1 | 0.37mi |
| 3414 Chesapeake Dr Arlington, TX | 3.0 | 2.0 | 1674 | $1,950 | $1.16 | 15d | 1 | 0.44mi |
| 3414 Chesapeake Dr Arlington, TX | 3.0 | 2.0 | 1674 | $1,950 | $1.16 | 44d | 1 | 0.44mi |
| 3401 Shea Ct Arlington, TX | 3.0 | 2.0 | 1836 | $1,800 | $0.98 | 5d | 1 | 0.61mi |
| 107 Hidalgo Ln Arlington, TX | 3.0 | 2.0 | 1333 | $2,095 | $1.57 | 44d | 1 | 0.72mi |
| 800 Custer St Arlington, TX | 3.0 | 2.0 | 1521 | $1,925 | $1.27 | 44d | 1 | 0.79mi |
| 1002 Candlewick St Arlington, TX | 4.0 | 2.0 | 1888 | $2,300 | $1.22 | 25d | 1 | 0.86mi |
| 1505 Hanover Dr Arlington, TX | 3.0 | 2.0 | 1726 | $2,183 | $1.26 | 2d | 1 | 0.88mi |
| 1003 Candlewick St Arlington, TX | 3.0 | 2.0 | 1230 | $2,106 | $1.71 | 7d | 1 | 0.88mi |
| 2082 Knoll Crest Dr Arlington, TX | 2.0–3.0 | 1.0–2.0 | 1066 | $1,860 | $1.74 | 44d | 1 | 0.96mi |
| 4806 Shadyway Dr Arlington, TX | 3.0 | 2.0 | 1357 | $2,300 | $1.69 | 25d | 1 | 1.04mi |
| 3012 Barrington Ct Arlington, TX | 4.0 | 3.0 | 2349 | $2,650 | $1.13 | 44d | 1 | 1.10mi |
| 1013 Terrebonne Ct Arlington, TX | 3.0 | 2.0 | 1558 | $2,390 | $1.53 | 13d | 1 | 1.13mi |
| 913 E Timberview Ln Arlington, TX | 3.0 | 2.0 | 1509 | $1,950 | $1.29 | 5d | 1 | 1.17mi |
| 300 Bardin Greene Dr Arlington, TX | 1.0–3.0 | 1.0–2.0 | 950 | $2,127 | $2.24 | 2d | 35 | 1.22mi |
| 1805 Crimson Ct Arlington, TX | 3.0 | 2.0 | 1314 | $1,925 | $1.46 | 44d | 1 | 1.24mi |
| 2219 Foxcroft Ln Arlington, TX | 3.0 | 1.0 | 1302 | $1,850 | $1.42 | 14d | 1 | 1.24mi |
| 305 Ranch Dr Arlington, TX | 1.0–3.0 | 1.0–2.0 | 1042 | $2,432 | $2.33 | 2d | 19 | 1.30mi |
| 1408 Seely St Arlington, TX | 3.0 | 2.0 | 2125 | $2,350 | $1.11 | 5d | 1 | 1.32mi |
| 2509 E Williamsburg Mnr Arlington, TX | 3.0 | 2.0 | 1478 | $1,996 | $1.35 | 21d | 1 | 1.32mi |
| 4624 Windstone Dr Arlington, TX | 1.0–3.0 | 1.0–2.0 | 964 | $1,966 | $2.04 | 3d | 14 | 1.40mi |
Listing history 33 events
-
2026-06-18days on market $205,000 Active 347 DOM
-
2026-06-17days on market $205,000 Active 346 DOM
-
2026-06-16days on market $205,000 Active 345 DOM
-
2026-06-15days on market $205,000 Active 344 DOM
-
2026-06-13days on market $205,000 Active 342 DOM
-
2026-06-09days on market $205,000 Active 338 DOM
-
2026-06-08days on market $205,000 Active 337 DOM
-
2026-06-07days on market $205,000 Active 336 DOM
-
2026-06-04days on market $205,000 Active 333 DOM
-
2026-06-03days on market $205,000 Active 332 DOM
-
2026-06-02days on market $205,000 Active 331 DOM
-
2026-06-01days on market $205,000 Active 330 DOM
-
2026-05-31days on market $205,000 Active 329 DOM
-
2025-10-25status Active 855-char remark
Show marketing remark (855 chars)
Rare Investment Opportunity 4-Unit Incomplete Structure! Discover the potential at 1214 -1220 Alisa Lane, a rare investment opportunity featuring a 4-unit multifamily structure, each with separate tax ID numbers. The property is currently incomplete, offering a blank slate for value added to investors or developers to finish out the build to suit rental, resale, or portfolio strategies. Each unit is framed and ready for completion, presenting a flexible layout ideal for multifamily income generation. With infrastructure in place and significant progress already made, this is an excellent opportunity to capitalize on the growing demand for housing in the area. Whether you're looking to finish and flip, hold for rental income, or complete as a condo conversion project this property is primed for returns. Sold as-is. Investor inquiries welcome.
-
2025-10-07historical Active Under Contract 855-char remark
Show marketing remark (855 chars)
Rare Investment Opportunity 4-Unit Incomplete Structure! Discover the potential at 1214 -1220 Alisa Lane, a rare investment opportunity featuring a 4-unit multifamily structure, each with separate tax ID numbers. The property is currently incomplete, offering a blank slate for value added to investors or developers to finish out the build to suit rental, resale, or portfolio strategies. Each unit is framed and ready for completion, presenting a flexible layout ideal for multifamily income generation. With infrastructure in place and significant progress already made, this is an excellent opportunity to capitalize on the growing demand for housing in the area. Whether you're looking to finish and flip, hold for rental income, or complete as a condo conversion project this property is primed for returns. Sold as-is. Investor inquiries welcome.
-
2025-07-06$205,000 Active 855-char remark
Show marketing remark (855 chars)
Rare Investment Opportunity 4-Unit Incomplete Structure! Discover the potential at 1214 -1220 Alisa Lane, a rare investment opportunity featuring a 4-unit multifamily structure, each with separate tax ID numbers. The property is currently incomplete, offering a blank slate for value added to investors or developers to finish out the build to suit rental, resale, or portfolio strategies. Each unit is framed and ready for completion, presenting a flexible layout ideal for multifamily income generation. With infrastructure in place and significant progress already made, this is an excellent opportunity to capitalize on the growing demand for housing in the area. Whether you're looking to finish and flip, hold for rental income, or complete as a condo conversion project this property is primed for returns. Sold as-is. Investor inquiries welcome.
-
2025-07-01historical
-
2025-04-01status Active
-
2025-03-31historical
-
2025-03-31historical
-
2025-02-14status Active
-
2025-02-14status Active
-
2025-02-06status Pending
-
2025-01-06status Pending
-
2025-01-06status Pending, Continue to Show
-
2024-12-30status Option Pending
-
2024-12-01$205,000 Active
-
2024-10-08status Active
-
2024-10-08historical
-
2024-10-06$205,000 Active
-
2024-06-16historical
-
2024-06-16historical
-
2024-06-03$325,000
ⓘ Source: listings_history table (triggers on properties + properties_extension) + one-shot
backfill from property_details.listing_events for pre-trigger history.
Tax reassessment forecast TX · Resets to sale price
- Current annual tax
- $7,756 · $646/mo
- Projected year-2 tax
- $7,756 · $646/mo
- Expected delta
- $0/yr ($0/mo · 0.0%)
ⓘ Screening estimate from a state-policy table — verify with the county assessor before closing.
Climate risk First Street
- Flood 1/10 Low FEMA zone X (unshaded) · 0% chance over 30 yrs
- Wildfire 2/10 Low
- Heat 8/10 Severe 7 d/yr ≥110°F today · 24 d/yr by 30 yrs out
- Wind 6/10 Major 27% chance of damaging wind over 30 yrs
- Air quality 3/10 Moderate 2 unhealthy d/yr today · 4 by 30 yrs out
Nearby sold comps map
Loading sold comps map…
Walkable amenities ~0.75 mi
Loading nearby amenities…
Taxation est. · year 1
- Rental income
- $26,188
- − Mortgage interest
- −$11,483
- − Property taxes
- −$7,756
- − Insurance
- −$1,025
- − Repairs & maintenance
- −$2,095
- − Management
- −$2,095
- − Depreciation
- −$5,964
- Taxable loss
- −$4,230
- Est. tax savings @ 24.0%
- +$1,015
- After-tax cash flow
- $22/yr
For passive investors: Depreciation is non-cash, so a rental often shows a tax loss while cash-flowing — sheltering income. Rental losses are passive: they offset passive income freely, and up to $25,000/yr can offset ordinary (W-2) income if you actively participate and your MAGI is under $100k (phasing out to $0 by $150k); unused losses carry forward. On sale, claimed depreciation is recaptured at up to 25%, and gains may owe capital-gains tax (a 1031 exchange can defer both). Figures are a year-1 estimate at your 24.0% rate — not tax advice; consult a CPA.
Schools (NCES district)
- District
- Arlington ISD
- NCES district ID
- 4808700
- Math proficiency
- 24% ▼ -21.00%
- Reading proficiency
- 34% ▼ -8.00%
- Median HH income
- $50,873
- Composite
- 25.42/100
- National rank
- #7458
- State rank
- #629 of 826 in TX
Livability — Arlington
- Score
- 78/100
- State rank
- #75
- US rank
- #2697
Category grades
Schools grade is shown separately in the Schools card above.
Census & demographics
- Census place
- Arlington, TX
- County
- Tarrant County · 2,033,669 people
- City population
- 366,588
- Metro
- Dallas-Fort Worth-Arlington, TX
- Population (ZIP)
- 32,818
- Household income
- $60,333
- Rent vs Own
- Severe rent burden
- 2233.0
Population outlook (Tarrant County) Hauer SSP2
- Today (2025)
- 2,380,417 people
- By 2030
- 2,578,900 · +8.3%
- By 2040
- 2,974,995 · +25.0%
- By 2050
- 3,350,489 · +40.8%
- By 2075
- 4,216,909 · +77.2%
- By 2100
- 4,741,527 · +99.2%
Race, ethnicity, and origin ACS 2023
- Neighborhood character
- Highly diverse neighborhood (Simpson 0.70)
- Race & ethnicity
- Hispanic / Latino 44% Two or more races 25% Black 24% White 19% Asian 9%
- Hispanic origin (detail)
- Mexican 36% Puerto Rican 2%
- Common ancestry
- Italian 1% Slovak 1%
- Foreign-born
- 30% · Canada, Vietnam, Jamaica
- Languages at home
- 49% English-only · Spanish 35% Vietnamese 7% German/W. Germanic 1%
Political lean MEDSL · Tarrant
- 2024 margin
- Lean R (+5.1) · D 46.7% · R 51.9% · Other 1.4%
- 2008→2024 swing
- +6.6pp toward D · 2008: -11.7pp · 2024: -5.1pp
- All cycles
- 2024: R+5.1 2020: D+0.2 2016: R+8.7 2012: R+15.7 2008: R+11.7
Not yet ingested
- Civics
- —
Market trends
- HPI YoY
- ▼ -149.12%
- Current HPI
- 344.4376
- Rent YoY
- ▲ 4.08%
- Metro
- Dallas-Fort Worth-Arlington, TX
- State GDP YoY
- ▲ 3.95%
- F500 in state
- 110
Industry mix (Fortune 500 HQ in TX)
| Industry | F500 HQs | Revenue |
|---|---|---|
| Energy | 16 | $1,198B |
|
||
| Technology | 5 | $198B |
|
||
| Engineering / Construction | 4 | $72B |
|
||
| Energy Services | 3 | $60B |
|
||
| Utilities | 3 | $41B |
|
||
| Healthcare | 2 | $330B |
|
||
Price history
-36.9% since first listed20 events — show timeline
- 2025-10-25 Relisted — HARMLS
- 2025-10-07 Contingent — HARMLS
- 2025-07-06 Listed $205,000 HARMLS
- 2025-07-01 Listing Removed — HARMLS
- 2025-04-01 Relisted — HARMLS
- 2025-03-31 Listing Removed — NTREIS
- 2025-03-31 Listing Removed — HARMLS
- 2025-02-14 Relisted — NTREIS
- 2025-02-14 Relisted — HARMLS
- 2025-02-06 Pending — HARMLS
- 2025-01-06 Pending — NTREIS
- 2025-01-06 Pending — HARMLS
- 2024-12-30 Pending — HARMLS
- 2024-12-01 Listed $205,000 NTREIS
- 2024-10-08 Relisted — HARMLS
- 2024-10-08 Listing Removed — HARMLS
- 2024-10-06 Listed $205,000 HARMLS
- 2024-06-16 Listing Removed — NTREIS
- 2024-06-16 Listing Removed — NTREIS
- 2024-06-03 Listed $325,000 NTREIS
Property tax history
+51.2%/yrLatest (2025): $7,756 · +42.4% YoY. Source: county tax records.
Cash-flow waterfall
monthlySold comps — $/sqft
last 12 mo · ≤1 miLoading sold comps…