486 Deersville Ave · Uhrichsville, OH
Flood risk 1/10 · Minimal
- FEMA flood zone
- X (unshaded)
- Chance of flooding over 30 yrs
- 0.0%
- Est. flood insurance / yr
- $473 – $860
Fire risk 2/10 · Minimal
- Est. fire insurance / yr
- $713 – $1,323
Heat risk 3/10 · Minor
- Hot days now (above 99°F)
- 7 days/yr
- Hot days in 30 yrs
- 17 days/yr
Wind risk 1/10 · Minimal
- Chance of severe wind over 30 yrs
- —
Air-quality risk 2/10 · Minimal
- Unhealthy air days now
- 1 days/yr
- Unhealthy air days in 30 yrs
- 2 days/yr
Risk factors via First Street. Map © Google.
Why this score? — see what drove the B- grade
The composite is a weighted blend of 9 inputs, each scored 0–100. Each bar is that input's sub-score; the figure is the points it added to the 100-point composite (weight × sub-score).
- Cash flow +30.0/30.0
- 1% rule +10.0/10.0
- DSCR +10.0/10.0
- ARV discount +7.5/15.0
- Schools +4.1/10.0
- Livability +3.0/5.0
- Rent growth +2.5/5.0
- Condition / age +2.5/5.0
- Appreciation +0.0/10.0
$60,000
🖨 Deal sheet (PDF) 📄 Offer letter ✓ Due diligence
Listing remarks MLS
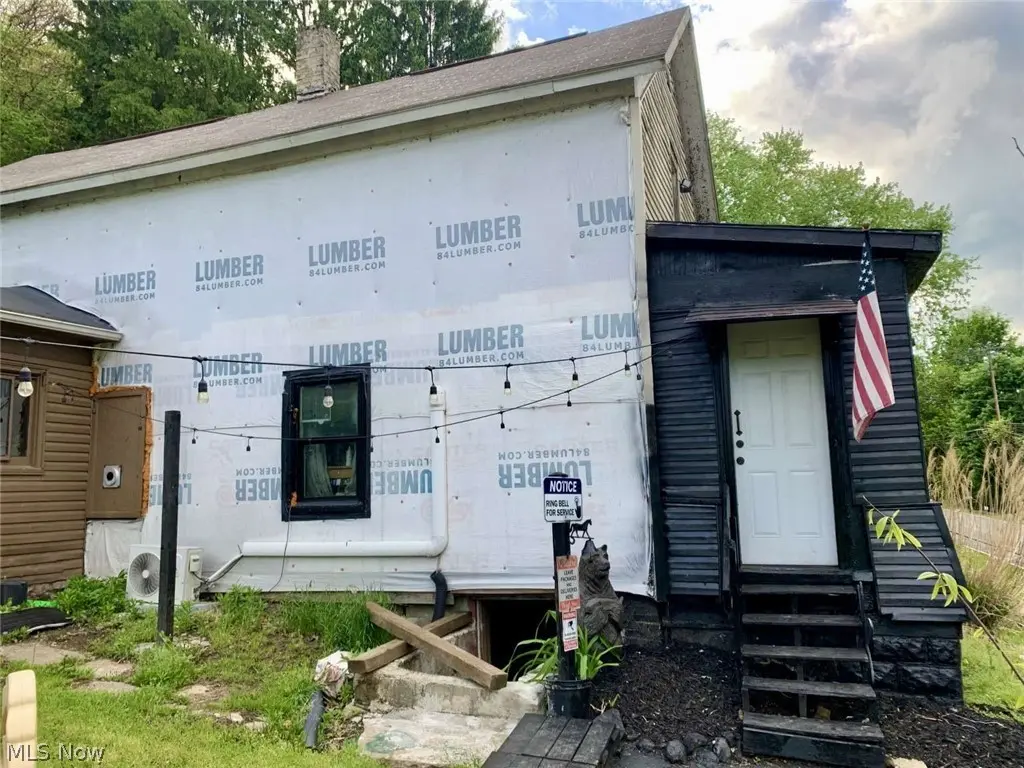
3 Bedroom, 1 Bath home in Claymont School District. Half acre lot, vinyl siding. This property is being offered on an upcoming event. All bids should be submitted at Xome. All properties are subject to a 5% buyer's premium pursuant to the Event Agreement and Terms & Conditions (minimums will apply).
Key facts
- Investment potential
- Prime location
- Generous lot size
Tags
Property features AI
Finance
- Financial info: Annual tax amount reported (2025): $624
Exterior
- Parking: Additional off-street parking
- Utilities: Public water; Public sewer
- Home design: Two-story home
- Construction: Vinyl and wood siding; Asphalt roof; Above-grade finished area reported as 1,500 (owner-reported)
- Exterior features: Lot approximately 0.1894 acres; Property listed as fixer / under construction
Interior
- Bathrooms: One full bathroom (main level)
- Heating & cooling: Electric heating; Central air conditioning
- Interior features: Partial basement; Total of 8 rooms
Neighborhood map
What this means for you Summary
Snapshot
- This is a 2-bed/1.0-bath single-family listed at $60k.
Deal economics
- At list price, monthly cash flow is $440 ($5k/yr) — positive.
- The deal already cash-flows at list — no discount required.
- Meets the 1% rule at list price ($1k rent vs $60k).
- Recommended offer: $58k (3.0% below list) — sets the bar for market timing.
Location & tenants
- Location reads 59/100 on livability (#1,002 in OH) — a working-class tenant base; expect higher turnover. Strengths: cost of living A+, housing A; Watch: schools C-, crime F, amenities F.
- Claymont City (town): math 47% / reading 51% proficiency, ranked #467 of 656 in OH (top 71%) — families likely to look elsewhere, expect single-tenant / working-renter base with shorter leases.
- Market conditions: 37 active listings in the ZIP; 244 units permitted in Tuscarawas County in 2024 (0 in 5+ unit buildings).
Forward outlook
- Local home prices are declining (-3.0%/yr); year-one equity from $415 of loan paydown is wiped out by about $2k of value loss. Plan a longer hold.
- Tuscarawas County population projected to shrink 10% by 2050 — rents likely to lag national; underwrite the cash flow, not the appreciation.
- At projected returns (-3.0% appreciation + 3.0% rent growth), your $17k cash investment doubles in ~4 years — after that, you're playing with house money.
Negotiation context
- It's been on market 49 days — a 3% lower offer ($58k) is reasonable based on typical stale-listing flexibility.
- 5 sale attempts since 21y ago; this cycle's ask is 20% above the opening price — seller raised mid-cycle; expect resistance to lowballs.
- Current owner paid $12k; list at $60k implies a 400% gain — meaningful room to come down on a strong offer.
Risks & watch-outs
- Watch-outs: built in 1900 — expect roof / HVAC / electrical / plumbing capex.
Questions for the listing agent
- It's been on market 49 days. Have you received any prior offers? Is the seller open to a 3% concession, seller financing, or rate buy-down credit?
- Built in 1900 — when were the roof, HVAC, electrical panel, plumbing, and water heater last replaced?
- Is there a deadline driving the sale (1031 exchange, divorce, estate, relocation)? That informs how much negotiation room exists.
- Crime grade is F in this area — have there been break-ins, vandalism, or insurance claims at this property in the last 3 years? What carrier currently insures it and at what premium?
- What's the average days-on-market for RENTAL listings here right now (not sales)? A rising rental-DOM trend means longer vacancies and softer asking-rent achievability than the comps imply.
- What's the recent tenant-quality profile in this submarket — average credit score on applications, eviction rate, late-payment / NSF rate, and stable-employment percentage? A property-management company in the area should have these aggregated.
- How much new for-sale + rental construction is in the pipeline within 1–3 miles? Heavy new supply typically softens prices + rents 12–24 months out; constrained supply supports both.
Investment metrics
- 1% rule
- 1.75% ✓
- Cap rate
- 15.10%
- Cash-on-cash
- 31.44%
- DSCR
- 2.40
- GRM
- 4.7
CMA / ARV
- ARV (median comp)
- $120,355
- List price
- $60,000
- Delta
- -50.15%
- Verdict
- UNDERPRICED
- Comps
- 20 within 1.0 mi
Show comp detail 8 sales within ~0.75 mi
| Address | Dist | Beds/Ba | Sqft | Sold | Price | $/sf | Match |
|---|---|---|---|---|---|---|---|
| 322 Deersville Ave | 0.25mi | 3/1.0 (+1) | 1,036 (-7%) | 10mo | $10,000 | $10 | 63 |
| 320 Sherman St | 0.49mi | 2/1.0 | 1,028 (-8%) | 2mo | $73,500 | $71 | 62 |
| 510 E 3rd St | 0.54mi | 3/1.0 (+1) | 1,176 (+6%) | 12mo | $110,000 | $94 | 50 |
| 210 Spring St | 0.64mi | 3/1.0 (+1) | 1,058 (-5%) | 12mo | $115,000 | $109 | 47 |
| 515 E High St | 0.35mi | 3/1.0 (+1) | 1,276 (+14%) | 10mo | $169,500 | $133 | 47 |
| 119 Taylor Ave | 0.69mi | 2/1.5 | 1,188 (+7%) | 15mo | $106,600 | $90 | 42 |
| 608 Gorley St | 0.74mi | 3/1.5 (+1) | 1,098 (-1%) | 20mo | $150,900 | $137 | 39 |
| 307 Hanna St | 0.65mi | 2/1.0 | 980 (-12%) | 18mo | $124,900 | $127 | 35 |
Match score weights: distance 35% · size 25% · config 20% · recency 20%. Top-matched comps best support the ARV.
Projected returns pro-forma
-3.0% appreciation · 3.0% rent growth · sell at horizon
- IRR
- 26.3%
- Equity multiple
- 2.09×
- Total profit
- $18,316
- Equity at exit
- $8,946
- IRR
- 33.9%
- Equity multiple
- 4.10×
- Total profit
- $52,058
- Equity at exit
- $5,188
Cash invested: $16,800 (down + closing). Projections, not guarantees.
Landlord ↔ Tenant lean methodology
- Overall (STATE)
- 73 Landlord-Friendly
- State Ohio
- 73 Landlord-Friendly · R+6
- County
- — inherits STATE
- City
- — inherits STATE
ZIP-level market 44683
- Home prices YoY
- -14.4%
- Active inventory
- 37
- Price-to-rent
- 4.7×
Monthly cashflow live
- Estimated rent
- $1,053 medium interval (Pro) →
- Mortgage (P&I)
- −$315
- Tax from tax record
- −$52 /mo · $624/yr
- Insurance
- −$25
- HOA
- −$0
- Vacancy / Maint / Mgmt
- −$221
- Net cashflow
- $440
Break-even live
Sensitivity live
| Price | -10% $474 | -5% $457 | +0% $440 | +5% $423 | +10% $406 |
|---|---|---|---|---|---|
| Rent | -10% $357 | -5% $399 | +0% $440 | +5% $482 | +10% $523 |
| Rate | -1.0pp $470 | -0.5pp $455 | base $440 | +0.5pp $425 | +1.0pp $409 |
UW: 25.0% down · 7.5% · 30yr · 1.5% tax · 5.0% vac · 8.0% maint · 8.0% mgmt
Financing live
Cash to close
- Down payment
- $15,000
- Closing costs
- $1,800
- Reserves months
- —
- Total cash needed
- —
Loan-product check · same deal, 3 products live
Conventional
25% down · 7.5% · 30yr
- Down + closing
- —
- Monthly P&I
- —
- Monthly cashflow
- —
- DSCR
- —
- Eligible?
- —
Personal DTI + credit; lowest rate.
DSCR
20% down · 8.5% · 30yr
- Down + closing
- —
- Monthly P&I
- —
- Monthly cashflow
- —
- DSCR
- —
- Eligible?
- —
No personal income docs; deal must DSCR.
Hard money
10% down · 12.0% · 12mo
- Down + closing
- —
- Monthly P&I
- —
- Monthly cashflow
- —
- DSCR
- —
- Eligible?
- —
Short-term bridge; refi at stabilization.
Listing history 27 events
-
2026-06-21days on market $60,000 Active 49 DOM
-
2026-06-18days on market $60,000 Active 47 DOM
-
2026-06-17days on market $60,000 Active 46 DOM
-
2026-06-16days on market $60,000 Active 45 DOM
-
2026-06-15days on market $60,000 Active 44 DOM
-
2026-06-13days on market $60,000 Active 42 DOM
-
2026-06-12days on market $60,000 Active 41 DOM
-
2026-06-09days on market $60,000 Active 38 DOM
-
2026-06-08days on market $60,000 Active 37 DOM
-
2026-06-08days on market $60,000 Active 36 DOM
-
2026-06-07days on market $60,000 Active 35 DOM
-
2026-06-04days on market $60,000 Active 32 DOM
-
2026-06-02days on market $60,000 Active 31 DOM
-
2026-06-01days on market $60,000 Active 30 DOM
-
2026-05-31days on market $60,000 Active 29 DOM
-
2026-05-02$50,000 Active 1487-char remark
-
2016-10-21soldstatus $12,000
-
2016-09-28soldstatus $12,000 307-char remark
Show marketing remark (307 chars)
3 Bedroom, 1 Bath home in Claymont School District. Half acre lot, vinyl siding. This property is being offered on an upcoming event. All bids should be submitted at Xome. All properties are subject to a 5% buyer's premium pursuant to the Event Agreement and Terms & Conditions (minimums will apply).
-
2016-08-08$25,000 307-char remark
Show marketing remark (307 chars)
3 Bedroom, 1 Bath home in Claymont School District. Half acre lot, vinyl siding. This property is being offered on an upcoming event. All bids should be submitted at Xome. All properties are subject to a 5% buyer's premium pursuant to the Event Agreement and Terms & Conditions (minimums will apply).
-
2016-05-24historical
-
2016-04-14$6,500
-
2016-03-07historical
-
2016-03-04$9,000
-
2006-02-14soldstatus $16,500
-
2005-07-27$17,900
-
2003-04-15soldstatus $28,680
-
1996-06-21soldstatus $12,129
ⓘ Source: listings_history table (triggers on properties + properties_extension) + one-shot
backfill from property_details.listing_events for pre-trigger history.
Tax reassessment forecast OH · Partial reset (capped growth)
- Current annual tax
- $624 · $52/mo
- Projected year-2 tax
- $780 · $65/mo
- Expected delta
- +$156/yr (+$13/mo · 25.0%)
ⓘ Screening estimate from a state-policy table — verify with the county assessor before closing.
Climate risk First Street
- Flood 1/10 Low FEMA zone X (unshaded) · 0% chance over 30 yrs
- Wildfire 2/10 Low
- Heat 3/10 Moderate 7 d/yr ≥99°F today · 17 d/yr by 30 yrs out
- Wind 1/10 Low
- Air quality 2/10 Low 1 unhealthy d/yr today · 2 by 30 yrs out
Nearby sold comps map
Loading sold comps map…
Walkable amenities ~0.75 mi
Loading nearby amenities…
Taxation est. · year 1
- Rental income
- $12,636
- − Mortgage interest
- −$3,361
- − Property taxes
- −$624
- − Insurance
- −$300
- − Repairs & maintenance
- −$1,011
- − Management
- −$1,011
- − Depreciation
- −$1,745
- Taxable income
- $4,584
- Est. tax owed @ 24.0%
- −$1,100
- After-tax cash flow
- $4,182/yr
For passive investors: Depreciation is non-cash, so a rental often shows a tax loss while cash-flowing — sheltering income. Rental losses are passive: they offset passive income freely, and up to $25,000/yr can offset ordinary (W-2) income if you actively participate and your MAGI is under $100k (phasing out to $0 by $150k); unused losses carry forward. On sale, claimed depreciation is recaptured at up to 25%, and gains may owe capital-gains tax (a 1031 exchange can defer both). Figures are a year-1 estimate at your 24.0% rate — not tax advice; consult a CPA.
Schools (NCES district)
- District
- Claymont City
- NCES district ID
- 3904377
- Math proficiency
- 47% ▼ -11.00%
- Reading proficiency
- 51% ▼ -15.00%
- Median HH income
- $37,563
- Composite
- 40.76/100
- National rank
- #3650
- State rank
- #467 of 656 in OH
Livability — Uhrichsville
- Score
- 59/100
- State rank
- #1002
- US rank
- #19658
Category grades
Schools grade is shown separately in the Schools card above.
Census & demographics
- Census place
- Uhrichsville, OH
- County
- Tuscarawas · 99,287 people
- Population (ZIP)
- 7,888
- Household income
- $55,179
- Rent vs Own
- Severe rent burden
- 7.2
Population outlook (Tuscarawas County) Hauer SSP2
- Today (2025)
- 92,253 people
- By 2030
- 91,060 · -1.3%
- By 2040
- 87,479 · -5.2%
- By 2050
- 83,174 · -9.8%
- By 2075
- 72,000 · -22.0%
- By 2100
- 58,574 · -36.5%
Race, ethnicity, and origin ACS 2023
- Neighborhood character
- Predominantly White (95%)
- Race & ethnicity
- White 95% Two or more races 2% Hispanic / Latino 1%
- Common ancestry
- Romanian 3% Slovak 3% Serbian 2%
- Foreign-born
- 1% · Canada, Vietnam
- Languages at home
- 99% English-only · Other Indo-European 1%
Political lean MEDSL · Tuscarawas
- 2024 margin
- Solid R (+43.3) · D 28.0% · R 71.2%
- 2008→2024 swing
- -45.7pp toward R · 2008: 2.4pp · 2024: -43.3pp
- All cycles
- 2024: R+43.3 2020: R+39.9 2016: R+35.5 2012: R+9.8 2008: D+2.4
Not yet ingested
- Civics
- —
Market trends
- HPI YoY
- ▼ -35.60%
- Current HPI
- 212.197
- Rent YoY
- —
- Metro
- —
- State GDP YoY
- ▲ 1.98%
- F500 in state
- 48
Industry mix (Fortune 500 HQ in OH)
| Industry | F500 HQs | Revenue |
|---|---|---|
| Insurance | 3 | $145B |
|
||
| Industrial Machinery | 3 | $49B |
|
||
| Financial Services | 3 | $24B |
|
||
| Consumer Goods | 2 | $93B |
|
||
| Aerospace / Defense | 2 | $47B |
|
||
| Utilities | 2 | $33B |
|
||
Price history
+394.7% since first listed13 events — show timeline
- 2026-05-26 Price Changed $60,000 MLSNOW
- 2026-05-02 Listed $50,000 MLSNOW
- 2016-10-21 Sold (Public Records) $12,000 Public Records
- 2016-09-28 Sold (MLS) $12,000 MLSNOW
- 2016-08-08 Listed $25,000 MLSNOW
- 2016-05-24 Listing Removed — MLSNOW
- 2016-04-14 Listed $6,500 MLSNOW
- 2016-03-07 Listing Removed — MLSNOW
- 2016-03-04 Listed $9,000 MLSNOW
- 2006-02-14 Sold (MLS) $16,500 MLSNOW
- 2005-07-27 Listed $17,900 MLSNOW
- 2003-04-15 Sold (Public Records) $28,680 Public Records
- 1996-06-21 Sold (Public Records) $12,129 Public Records
Property tax history
+3.1%/yrLatest (2025): $624 · +22.7% YoY. Source: county tax records.
Cash-flow waterfall
monthlySold comps — $/sqft
last 12 mo · ≤1 miLoading sold comps…