704 Fleming St · Columbia, TN
Flood risk 1/10 · Minimal
- FEMA flood zone
- X (unshaded)
- Chance of flooding over 30 yrs
- 0.0%
- Est. flood insurance / yr
- $507 – $1,088
Fire risk 4/10 · Minor
- Est. fire insurance / yr
- $949 – $1,763
Heat risk 6/10 · Moderate
- Hot days now (above 106°F)
- 7 days/yr
- Hot days in 30 yrs
- 19 days/yr
Wind risk 4/10 · Minor
- Chance of severe wind over 30 yrs
- 13.0%
Air-quality risk 1/10 · Minimal
- Unhealthy air days now
- 0 days/yr
- Unhealthy air days in 30 yrs
- 0 days/yr
Risk factors via First Street. Map © Google.
Why this score? — see what drove the D grade
The composite is a weighted blend of 9 inputs, each scored 0–100. Each bar is that input's sub-score; the figure is the points it added to the 100-point composite (weight × sub-score).
- ARV discount +15.0/15.0
- Cash flow +10.3/30.0
- Rent growth +3.7/5.0
- Livability +3.2/5.0
- DSCR +3.0/10.0
- Condition / age +2.5/5.0
- 1% rule +2.0/10.0
- Schools +1.8/10.0
- Appreciation +0.0/10.0
$260,000
🖨 Deal sheet 📄 Offer letter ✓ Due diligence
Listing remarks MLS
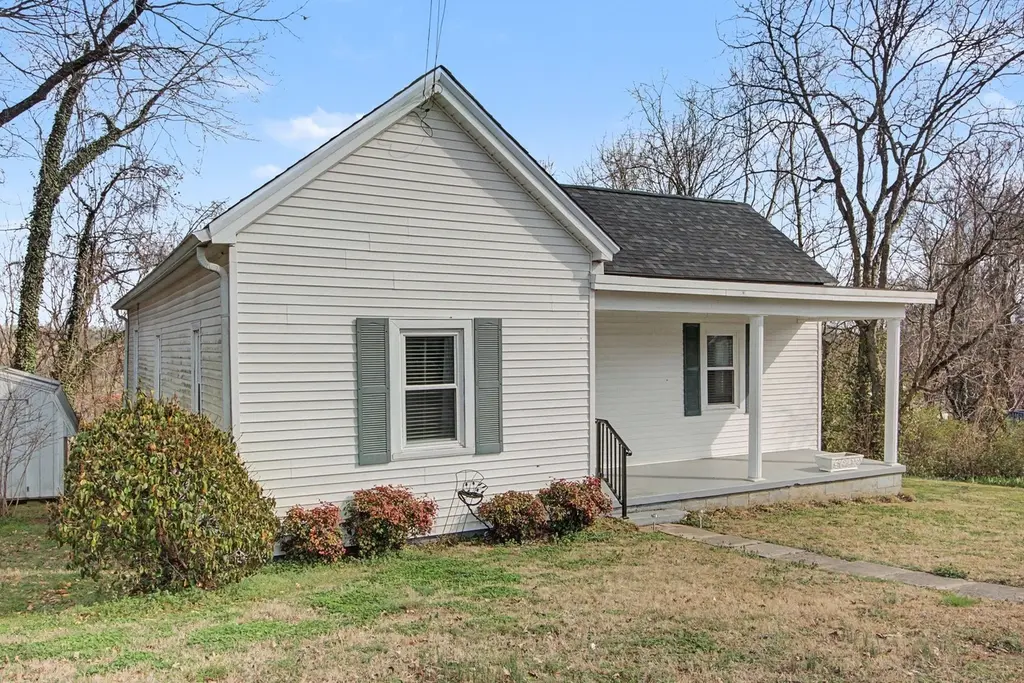
Adorable Riverside neighborhood cottage. Amazing location. Hardwood flooring in all bedrooms, dining room, den, and living room. Appliances included. Covered front porch and side entry deck. Newer hvac system and newer roof. Not in a flood plain.
Key facts
- Hardwood flooring
- Covered front porch
- Side entry deck
Tags
Neighborhood map
What this means for you Summary
Snapshot
- This is a 3-bed/2.0-bath single-family listed at $260k.
Deal economics
- At list price, monthly cash flow is $-141 ($-2k/yr) — negative.
- To cash-flow at today's rent, offer at most $235k (9.6% below list).
- To meet the 1% rule (rent ≥ 1% of price), the offer needs to be $182k (29.9% below list).
- Recommended offer: $182k (29.9% below list) — sets the bar for 1% rule.
- Cap rate 5.6% vs local median 2.8% in Columbia — top-decile yield for the area; either an underpriced asset or a hidden risk that comps aren't pricing in. Stress-test before assuming the spread holds.
Location & tenants
- Location reads 63/100 on livability (#207 in TN) — a middle-class / working-renter tenant base. Strengths: cost of living A+, housing A+; Watch: employment C-, health & safety C-, schools F.
- Maury County (town): math 19% / reading 21% proficiency, ranked #108 of 139 in TN (top 78%) — low school quality limits family demand, transient renter base, plan for 1-2y turnover.
- Market conditions: Rents rising fast (+5.0%/yr); 1118 active listings in the ZIP; 24 comparable units currently listed for rent nearby; rentals at typical pace (median 24d on market — plan ~3-4 weeks tenant-placement turnaround); 1,650 units permitted in Maury County in 2024 (60 in 5+ unit buildings).
- This rent runs 32% of the median local income ($68k/yr) — at the standard rent-burdened threshold; future hikes will face affordability resistance.
Forward outlook
- Local home prices are declining (-3.0%/yr); year-one equity from $2k of loan paydown is wiped out by about $8k of value loss. Plan a longer hold.
- Maury County population projected at +34% by 2050 — long-run rental-demand tailwind backs the buy-and-hold thesis.
Negotiation context
- It's been on market 104 days — a 9% lower offer ($237k) is reasonable based on typical stale-listing flexibility.
Risks & watch-outs
- Watch-outs: built in 1953 — expect roof / HVAC / electrical / plumbing capex.
- Climate carrying-cost: extreme-heat days projected 7→19/yr by 2055 (HVAC capex compounding) — expect insurance premiums to compound above CPI over the hold.
Questions for the listing agent
- What do current leases actually rent for vs. the listed asking? Can we see a recent rent roll and the last 12 months of T-12 income?
- It's been on market 104 days. Have you received any prior offers? Is the seller open to a 30% concession, seller financing, or rate buy-down credit?
- Built in 1953 — when were the roof, HVAC, electrical panel, plumbing, and water heater last replaced?
- Why hasn't it sold? Are there any deal-killer items the seller is aware of (foundation, flood, title, zoning, code violations)?
- Is there a deadline driving the sale (1031 exchange, divorce, estate, relocation)? That informs how much negotiation room exists.
- Schools are F-rated, which usually means shorter tenancies and higher turnover. Who's the typical renter profile here, and what's been the actual vacancy rate?
- Crime grade is F in this area — have there been break-ins, vandalism, or insurance claims at this property in the last 3 years? What carrier currently insures it and at what premium?
- The area grade is low — what's the realistic commute time and amenity access for the typical tenant pool here? Any planned neighborhood developments (good or bad) we should know about?
- What's the average days-on-market for RENTAL listings here right now (not sales)? A rising rental-DOM trend means longer vacancies and softer asking-rent achievability than the comps imply.
- What's the recent tenant-quality profile in this submarket — average credit score on applications, eviction rate, late-payment / NSF rate, and stable-employment percentage? A property-management company in the area should have these aggregated.
- How much new for-sale + rental construction is in the pipeline within 1–3 miles? Heavy new supply typically softens prices + rents 12–24 months out; constrained supply supports both.
Investment metrics
- 1% rule
- 0.70% ✗
- Cap rate
- 5.64%
- Cash-on-cash
- -2.32%
- DSCR
- 0.90
- GRM
- 11.9
CMA / ARV
- ARV (median comp)
- $313,240
- List price
- $260,000
- Delta
- -17.00%
- Verdict
- UNDERPRICED
- Comps
- 20 within 1.0 mi
Show comp detail 12 sales within ~0.75 mi
| Address | Dist | Beds/Ba | Sqft | Sold | Price | $/sf | Match |
|---|---|---|---|---|---|---|---|
| 402 4th Ave | 0.31mi | 3/2.0 | 1,569 (+2%) | 2mo | $313,500 | $200 | 80 |
| 407 6th Ave | 0.13mi | 4/2.5 (+1) | 1,523 (-1%) | 11mo | $360,000 | $236 | 76 |
| 207 2nd Ave | 0.51mi | 3/2.0 | 1,542 (+0%) | 1mo | $345,000 | $224 | 75 |
| 109 Bass Dr | 0.27mi | 3/3.0 | 1,656 (+8%) | 0mo | $347,900 | $210 | 70 |
| 305 2nd Ave | 0.46mi | 3/1.0 | 1,535 (-0%) | 7mo | $270,000 | $176 | 68 |
| 104 3rd Ave | 0.55mi | 3/2.0 | 1,548 (+1%) | 8mo | $170,000 | $110 | 67 |
| 108 8th Ave | 0.27mi | 3/1.5 | 1,706 (+11%) | 3mo | $303,900 | $178 | 65 |
| 112 3rd Ave | 0.51mi | 2/1.0 (-1) | 1,548 (+1%) | 3mo | $279,000 | $180 | 64 |
| 308 6th Ave | 0.22mi | 3/2.5 | 1,322 (-14%) | 4mo | $337,000 | $255 | 61 |
| 212 3rd Ave | 0.44mi | 4/2.5 (+1) | 1,598 (+4%) | 9mo | $374,000 | $234 | 59 |
| 115 7th Ave | 0.34mi | 3/2.0 | 1,716 (+12%) | 7mo | $350,000 | $204 | 59 |
| 106 7th Ave | 0.40mi | 4/2.0 (+1) | 1,714 (+11%) | 0mo | $335,000 | $195 | 57 |
Match score weights: distance 35% · size 25% · config 20% · recency 20%. Top-matched comps best support the ARV.
Projected returns pro-forma
-3.0% appreciation · 4.97% rent growth · sell at horizon
- IRR
- -18.3%
- Equity multiple
- 0.35×
- Total profit
- $-47,514
- Equity at exit
- $38,767
- IRR
- -7.6%
- Equity multiple
- 0.48×
- Total profit
- $-37,600
- Equity at exit
- $22,480
Cash invested: $72,800 (down + closing). Projections, not guarantees.
Landlord ↔ Tenant lean methodology
- Overall (STATE)
- 87 Strongly Landlord-Friendly
- State Tennessee
- 87 Strongly Landlord-Friendly · R+13
- County
- — inherits STATE
- City
- — inherits STATE
ZIP-level market 38401
- Home prices YoY
- -22.7%
- Rents YoY
- 5.0%
- Active inventory
- 1118
- Price-to-rent
- 11.9×
Monthly cashflow live
- Estimated rent
- $1,823 high interval (Pro) →
- Mortgage (P&I)
- −$1,363
- Tax from tax record
- −$109 /mo · $1,310/yr
- Insurance
- −$108
- HOA
- −$0
- Vacancy / Maint / Mgmt
- −$383
- Net cashflow
- $-141
Break-even live
UW: 25.0% down · 7.5% · 30yr · 1.5% tax · 5.0% vac · 8.0% maint · 8.0% mgmt
Financing live
Cash to close
- Down payment
- $65,000
- Closing costs
- $7,800
- Reserves months
- —
- Total cash needed
- —
Loan-product check · same deal, 3 products live
Conventional
25% down · 7.5% · 30yr
- Down + closing
- —
- Monthly P&I
- —
- Monthly cashflow
- —
- DSCR
- —
- Eligible?
- —
Personal DTI + credit; lowest rate.
DSCR
20% down · 8.5% · 30yr
- Down + closing
- —
- Monthly P&I
- —
- Monthly cashflow
- —
- DSCR
- —
- Eligible?
- —
No personal income docs; deal must DSCR.
Hard money
10% down · 12.0% · 12mo
- Down + closing
- —
- Monthly P&I
- —
- Monthly cashflow
- —
- DSCR
- —
- Eligible?
- —
Short-term bridge; refi at stabilization.
Rent comps 24 comps
| Address | Beds | Baths | Sqft | Rent | $/sqft | DOM | Units | Dist |
|---|---|---|---|---|---|---|---|---|
| 405 Fleming St Columbia, TN | 3.0 | 2.0 | 1470 | $1,700 | $1.16 | 44d | 1 | 0.25mi |
| 927 Sutton Cv Columbia, TN | 2.0 | 2.5 | 1230 | $1,400 | $1.14 | 23d | 1 | 0.48mi |
| 326 Seaton Way Columbia, TN | 3.0 | 2.5 | 1601 | $1,800 | $1.12 | 43d | 1 | 0.49mi |
| 202 3rd Ave Columbia, TN | 3.0 | 1.5 | 1600 | $2,000 | $1.25 | 2d | 1 | 0.50mi |
| 1415 Walker Way Columbia, TN | 3.0 | 2.5 | 1482 | $1,790 | $1.21 | 43d | 1 | 0.59mi |
| 1407 Walker Way Columbia, TN | 3.0 | 2.0 | 1394 | $1,675 | $1.20 | 3d | 1 | 0.60mi |
| 1406 Walker Way Columbia, TN | 3.0 | 3.0 | 1363 | $1,749 | $1.28 | 23d | 1 | 0.61mi |
| 1005 Marcy Lndg Columbia, TN | 3.0 | 2.5 | 1482 | $1,645 | $1.11 | 21d | 1 | 0.61mi |
| 1005 Marcy Lndg Unit 1 Columbia, TN | 3.0 | 2.0 | 1482 | $1,645 | $1.11 | 21d | 1 | 0.62mi |
| 610 Clifford Hts Columbia, TN | 3.0 | 2.5 | 1363 | $1,675 | $1.23 | 21d | 1 | 0.65mi |
| 608 Clifford Hts Columbia, TN | 3.0 | 2.5 | 1363 | $1,700 | $1.25 | 43d | 1 | 0.65mi |
| 656 Taylor Bend Rd Columbia, TN | 3.0 | 2.5 | 1993 | $2,300 | $1.15 | 12d | 1 | 0.65mi |
| 725 Prairie View Dr Unit 1 Columbia, TN | 3.0 | 2.5 | 1600 | $1,675 | $1.05 | 10d | 1 | 0.67mi |
| 741 Prairie View Dr Unit 1 Columbia, TN | 3.0 | 2.0 | 1577 | $1,675 | $1.06 | 10d | 1 | 0.67mi |
| 105 Creek Trl Unit A Columbia, TN | 2.0 | 1.0 | 1674 | $1,600 | $0.96 | 1d | 1 | 0.70mi |
| 105 Creek Trl Unit A Columbia, TN | 2.0 | 1.0 | 1674 | $1,650 | $0.99 | 43d | 1 | 0.70mi |
| 958 Oak Ridge Ln Columbia, TN | 3.0 | 2.5 | 1600 | $1,825 | $1.14 | 23d | 1 | 0.72mi |
| 908 Mapleash Ave Columbia, TN | 3.0 | 2.0 | 1112 | $1,750 | $1.57 | 17d | 1 | 1.04mi |
| 615 N High St Unit B Columbia, TN | 3.0 | 2.5 | 1200 | $1,300 | $1.08 | 23d | 1 | 1.06mi |
| 915 Mapleash Ave Columbia, TN | 4.0 | 2.0 | 1308 | $1,995 | $1.53 | 43d | 1 | 1.07mi |
| 107 E 9th St Unit D-7 Columbia, TN | 3.0 | 3.5 | 2060 | $2,550 | $1.24 | 17d | 1 | 1.17mi |
| 505 Washington St Columbia, TN | 3.0 | 2.0 | 1241 | $1,950 | $1.57 | 43d | 1 | 1.33mi |
| 721 Poplar St Unit B Columbia, TN | 4.0 | 2.5 | 1491 | $2,500 | $1.68 | 3d | 1 | 1.46mi |
| 721 Poplar St Unit A Columbia, TN | 4.0 | 2.5 | 1491 | $2,500 | $1.68 | 43d | 1 | 1.46mi |
Listing history 16 events
-
2026-06-18days on market $260,000 Active 104 DOM
-
2026-06-17days on market $260,000 Active 103 DOM
-
2026-06-16days on market $260,000 Active 102 DOM
-
2026-06-15days on market $260,000 Active 101 DOM
-
2026-06-13days on market $260,000 Active 99 DOM
-
2026-06-13days on market $260,000 Active 98 DOM
-
2026-06-09days on market $260,000 Active 95 DOM
-
2026-06-08days on market $260,000 Active 94 DOM
-
2026-06-07days on market $260,000 Active 93 DOM
-
2026-06-03days on market $260,000 Active 89 DOM
-
2026-06-02days on market $260,000 Active 88 DOM
-
2026-06-01days on market $260,000 Active 87 DOM
-
2026-05-31days on market $260,000 Active 86 DOM
-
2026-04-17price $260,000 246-char remark
Show marketing remark (246 chars)
Adorable Riverside neighborhood cottage. Amazing location. Hardwood flooring in all bedrooms, dining room, den, and living room. Appliances included. Covered front porch and side entry deck. Newer hvac system and newer roof. Not in a flood plain.
-
2026-03-24price $270,000 246-char remark
Show marketing remark (246 chars)
Adorable Riverside neighborhood cottage. Amazing location. Hardwood flooring in all bedrooms, dining room, den, and living room. Appliances included. Covered front porch and side entry deck. Newer hvac system and newer roof. Not in a flood plain.
-
2026-03-06$280,000 Active 246-char remark
Show marketing remark (246 chars)
Adorable Riverside neighborhood cottage. Amazing location. Hardwood flooring in all bedrooms, dining room, den, and living room. Appliances included. Covered front porch and side entry deck. Newer hvac system and newer roof. Not in a flood plain.
ⓘ Source: listings_history table (triggers on properties + properties_extension) + one-shot
backfill from property_details.listing_events for pre-trigger history.
Tax reassessment forecast TN · Resets to sale price
- Current annual tax
- $1,310 · $109/mo
- Projected year-2 tax
- $1,846 · $154/mo
- Expected delta
- +$536/yr (+$45/mo · 40.9%)
ⓘ Screening estimate from a state-policy table — verify with the county assessor before closing.
Climate risk First Street
- Flood 1/10 Low FEMA zone X (unshaded) · 0% chance over 30 yrs
- Wildfire 4/10 Moderate
- Heat 6/10 Major 7 d/yr ≥106°F today · 19 d/yr by 30 yrs out
- Wind 4/10 Moderate 13% chance of damaging wind over 30 yrs
- Air quality 1/10 Low 0 unhealthy d/yr today · 0 by 30 yrs out
Nearby sold comps map
Loading sold comps map…
Walkable amenities ~0.75 mi
Loading nearby amenities…
Taxation est. · year 1
- Rental income
- $21,877
- − Mortgage interest
- −$14,564
- − Property taxes
- −$1,310
- − Insurance
- −$1,300
- − Repairs & maintenance
- −$1,750
- − Management
- −$1,750
- − Depreciation
- −$7,564
- Taxable loss
- −$6,361
- Est. tax savings @ 24.0%
- +$1,527
- After-tax cash flow
- $-162/yr
For passive investors: Depreciation is non-cash, so a rental often shows a tax loss while cash-flowing — sheltering income. Rental losses are passive: they offset passive income freely, and up to $25,000/yr can offset ordinary (W-2) income if you actively participate and your MAGI is under $100k (phasing out to $0 by $150k); unused losses carry forward. On sale, claimed depreciation is recaptured at up to 25%, and gains may owe capital-gains tax (a 1031 exchange can defer both). Figures are a year-1 estimate at your 24.0% rate — not tax advice; consult a CPA.
Schools (NCES district)
- District
- Maury County
- NCES district ID
- 4702760
- Math proficiency
- 19% ▼ -5.00%
- Reading proficiency
- 21% ▼ -4.00%
- Median HH income
- $47,668
- Composite
- 17.69/100
- National rank
- #9024
- State rank
- #108 of 139 in TN
Livability — Columbia
- Score
- 63/100
- State rank
- #207
- US rank
- #16090
Category grades
Schools grade is shown separately in the Schools card above.
Census & demographics
- Census place
- Columbia, TN
- County
- Maury County · 121,382 people
- City population
- 67,482
- Metro
- Nashville-Davidson--Murfreesboro--Franklin, TN
- Population (ZIP)
- 67,482
- Household income
- $68,475
- Rent vs Own
- Severe rent burden
- 2026.0
Population outlook (Maury County) Hauer SSP2
- Today (2025)
- 102,894 people
- By 2030
- 110,269 · +7.2%
- By 2040
- 124,426 · +20.9%
- By 2050
- 137,543 · +33.7%
- By 2075
- 167,438 · +62.7%
- By 2100
- 184,489 · +79.3%
Race, ethnicity, and origin ACS 2023
- Neighborhood character
- Predominantly White (74%)
- Race & ethnicity
- White 74% Black 12% Hispanic / Latino 9% Two or more races 7%
- Hispanic origin (detail)
- Mexican 7%
- Common ancestry
- Slovak 1% Serbian 1% Romanian 1%
- Foreign-born
- 4% · Canada
- Languages at home
- 94% English-only · Spanish 5%
Political lean MEDSL · Maury
- 2024 margin
- Solid R (+44.6) · D 27.1% · R 71.8% · Other 1.1%
- 2008→2024 swing
- -6.2pp toward R · 2008: -38.4pp · 2024: -44.6pp
- All cycles
- 2024: R+44.6 2020: R+36.5 2016: R+39.2 2012: R+26.9 2008: R+38.4
Not yet ingested
- Civics
- —
Market trends
- HPI YoY
- ▼ -100.75%
- Current HPI
- 343.0362
- Rent YoY
- ▲ 4.97%
- Metro
- Nashville-Davidson--Murfreesboro--Franklin, TN
- State GDP YoY
- ▲ 2.78%
- F500 in state
- 22
Industry mix (Fortune 500 HQ in TN)
| Industry | F500 HQs | Revenue |
|---|---|---|
| Healthcare | 3 | $91B |
|
||
| Retail | 3 | $72B |
|
||
| Transportation / Logistics | 1 | $88B |
|
||
| Paper / Packaging | 1 | $19B |
|
||
| Insurance | 1 | $13B |
|
||
| Energy | 1 | $12B |
|
||
Price history
-7.1% since first listed3 events — show timeline
- 2026-04-17 Price Changed $260,000 REALTRACS as Distributed by MLS Grid
- 2026-03-24 Price Changed $270,000 REALTRACS as Distributed by MLS Grid
- 2026-03-06 Listed $280,000 REALTRACS as Distributed by MLS Grid
Property tax history
+4.3%/yrLatest (2025): $1,310 · +0.0% YoY. Source: county tax records.
Cash-flow waterfall
monthlySold comps — $/sqft
last 12 mo · ≤1 miLoading sold comps…