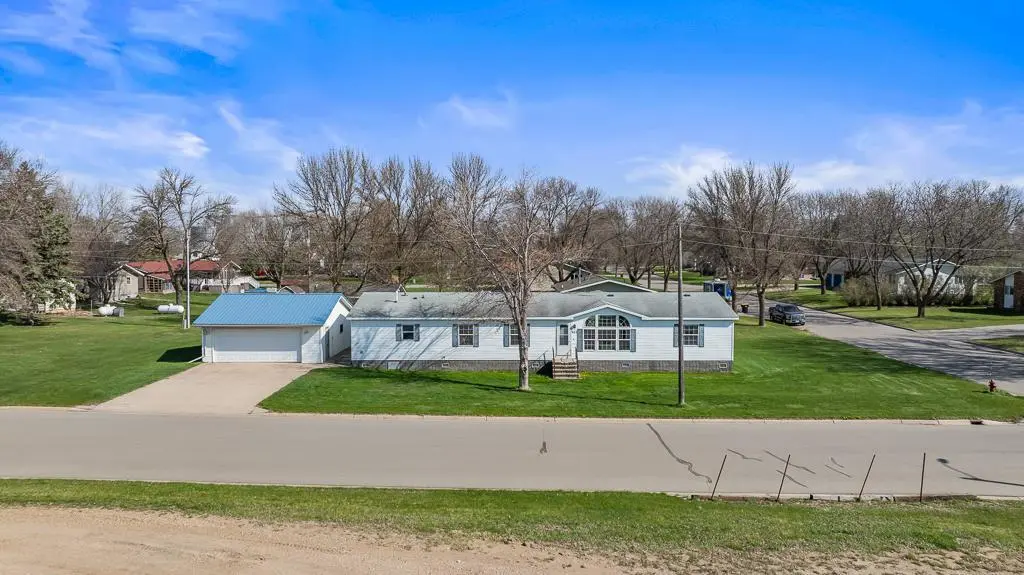
501 Cedar St · Milroy, MN
Flood risk No data
- FEMA flood zone
- —
- Chance of flooding over 30 yrs
- —
- Est. flood insurance / yr
- —
Fire risk No data
- Est. fire insurance / yr
- —
Heat risk No data
- Hot days now (above threshold)
- —
- Hot days in 30 yrs
- —
Wind risk No data
- Chance of severe wind over 30 yrs
- —
Air-quality risk No data
- Unhealthy air days now
- —
- Unhealthy air days in 30 yrs
- —
Risk factors via First Street. Map © Google.
Why this score? — see what drove the D+ grade
The composite is a weighted blend of 9 inputs, each scored 0–100. Each bar is that input's sub-score; the figure is the points it added to the 100-point composite (weight × sub-score).
- Cash flow +14.1/30.0
- ARV discount +7.5/15.0
- 1% rule +5.3/10.0
- Appreciation +5.0/10.0
- DSCR +4.3/10.0
- Schools +3.7/10.0
- Livability +3.4/5.0
- Rent growth +2.5/5.0
- Condition / age +2.5/5.0
$125,000
🖨 Deal sheet (PDF) 📄 Offer letter ✓ Due diligence
Listing remarks MLS
Complete main level living with split bedroom floor plan. Like new home has hardly been lived in. Refrigerator, Stove, Washer & Dryer are included. $6,000 invested in permanent block skirting around home.
Key facts
- 0.24 acre lot
- 2 garage spots
- Built 2000
Property features AI
Exterior
- Parking: 2-car garage (approx. 24'x26'); Concrete parking surfaces
- Utilities: City water; City sewer; Electric service with circuit breakers; Fuel: Electric and propane
- Home design: Residential single-level home; One story; Main entry on main level
- Construction: Asphalt roof; Block foundation; Foundation dimensions approximately 76' x 30'; Built with vinyl siding
- Exterior features: Vinyl exterior; Corner lot; 140 x 75 lot dimensions; City street frontage on paved roads; Publicly maintained roads; Garage(s) on property
Interior
- Kitchen: Kitchen center island; Eat-in kitchen / informal dining
- Bedrooms: 3 bedrooms (all on the main level); Primary bedroom with walk-in closet
- Bathrooms: Primary 3/4 bath with double sink and private setting; Main floor full bath
- Heating & cooling: Forced air heating; Central air conditioning
- Interior features: Ceiling fans; Vaulted ceilings; Primary bedroom suite; Main floor primary bedroom; All living facilities on one level; Main floor laundry; No internal stairs
- Laundry & utility: Main level laundry; Washer/dryer hookup; Washer and Dryer included
Neighborhood map
What this means for you Summary
Snapshot
- This is a 3-bed/2.0-bath single-family listed at $125k.
Deal economics
- At list price, monthly cash flow is $17 ($209/yr) — positive.
- The deal already cash-flows at list — no discount required.
- Meets the 1% rule at list price ($1k rent vs $125k).
Location & tenants
- Location reads 67/100 on livability (#449 in MN) — a middle-class / working-renter tenant base. Strengths: cost of living A+, housing A+; Watch: crime D+, health & safety D+, amenities F.
- Milroy Public School District (rural): math 40% / reading 40% proficiency, ranked #352 of 467 in MN (top 75%) — families likely to look elsewhere, expect single-tenant / working-renter base with shorter leases.
- Zoned schools: Milroy Elementary (math 50% / reading 50%, grade D, #423 of 857 statewide, top 55%, 32 students, 50% FRL) — zoned schools average 50% FRL vs 27% district-wide (23 pts higher); higher-poverty schools than district average — tighter screening recommended.
- Market conditions: 7 active listings in the ZIP; 25 units permitted in Redwood County in 2024 (0 in 5+ unit buildings).
Forward outlook
- In year one you build about $5k of equity ($864 loan paydown + $4k appreciation (3.0% local appreciation)).
- Redwood County population projected at -16% by 2050 — secular population decline; favor cash flow + early exit over multi-decade hold.
- At projected returns (3.0% appreciation + 3.0% rent growth), your $35k cash investment doubles in ~6 years — after that, you're playing with house money.
- By year 8, paydown + projected appreciation supports a ~$34k cash-out refi (75% LTV) — recoverable capital for the next deal without selling this one.
Negotiation context
- Only 1 days on market — expect competitive offers; lowballing is unlikely to land.
- 5 sale attempts since 19y ago with the ask held roughly flat each time — persistent listings suggest the price (not the market) is what's stuck; bring a comps-based counter.
- Current owner paid $35k; list at $125k implies a 257% gain — meaningful room to come down on a strong offer.
Risks & watch-outs
- Watch-outs: property tax is 2.8% of price.
Questions for the listing agent
- Property tax is high relative to price — has the assessment been appealed recently, and will the sale trigger a re-assessment?
- Is there a deadline driving the sale (1031 exchange, divorce, estate, relocation)? That informs how much negotiation room exists.
- Crime grade is D in this area — have there been break-ins, vandalism, or insurance claims at this property in the last 3 years? What carrier currently insures it and at what premium?
- The area grade is low — what's the realistic commute time and amenity access for the typical tenant pool here? Any planned neighborhood developments (good or bad) we should know about?
- What's the average days-on-market for RENTAL listings here right now (not sales)? A rising rental-DOM trend means longer vacancies and softer asking-rent achievability than the comps imply.
- What's the recent tenant-quality profile in this submarket — average credit score on applications, eviction rate, late-payment / NSF rate, and stable-employment percentage? A property-management company in the area should have these aggregated.
- How much new for-sale + rental construction is in the pipeline within 1–3 miles? Heavy new supply typically softens prices + rents 12–24 months out; constrained supply supports both.
Investment metrics
- 1% rule
- 1.03% ✓
- Cap rate
- 6.46%
- Cash-on-cash
- 0.60%
- DSCR
- 1.03
- GRM
- 8.1
CMA / ARV
No comps found within radius.
Projected returns pro-forma
3.0% appreciation · 3.0% rent growth · sell at horizon
- IRR
- 8.1%
- Equity multiple
- 1.46×
- Total profit
- $16,270
- Equity at exit
- $56,205
- IRR
- 10.8%
- Equity multiple
- 2.61×
- Total profit
- $56,523
- Equity at exit
- $86,619
Cash invested: $35,000 (down + closing). Projections, not guarantees.
Landlord ↔ Tenant lean methodology
- Overall (STATE)
- 46 Balanced
- State Minnesota
- 46 Balanced · D+2
- County
- — inherits STATE
- City
- — inherits STATE
ZIP-level market 56263
- Active inventory
- 7
- Price-to-rent
- 8.1×
Monthly cashflow live
- Estimated rent
- $1,285 medium interval (Pro) →
- Mortgage (P&I)
- −$656
- Tax from tax record
- −$290 /mo · $3,482/yr
- Insurance
- −$52
- HOA
- −$0
- Vacancy / Maint / Mgmt
- −$270
- Net cashflow
- $17
Break-even live
Sensitivity live
| Price | -10% $88 | -5% $53 | +0% $17 | +5% $-18 | +10% $-53 |
|---|---|---|---|---|---|
| Rent | -10% $-84 | -5% $-33 | +0% $17 | +5% $68 | +10% $119 |
| Rate | -1.0pp $80 | -0.5pp $49 | base $17 | +0.5pp $-15 | +1.0pp $-48 |
UW: 25.0% down · 7.5% · 30yr · 1.5% tax · 5.0% vac · 8.0% maint · 8.0% mgmt
Financing live
Cash to close
- Down payment
- $31,250
- Closing costs
- $3,750
- Reserves months
- —
- Total cash needed
- —
Loan-product check · same deal, 3 products live
Conventional
25% down · 7.5% · 30yr
- Down + closing
- —
- Monthly P&I
- —
- Monthly cashflow
- —
- DSCR
- —
- Eligible?
- —
Personal DTI + credit; lowest rate.
DSCR
20% down · 8.5% · 30yr
- Down + closing
- —
- Monthly P&I
- —
- Monthly cashflow
- —
- DSCR
- —
- Eligible?
- —
No personal income docs; deal must DSCR.
Hard money
10% down · 12.0% · 12mo
- Down + closing
- —
- Monthly P&I
- —
- Monthly cashflow
- —
- DSCR
- —
- Eligible?
- —
Short-term bridge; refi at stabilization.
Listing history 12 events
-
2026-04-29status Pending
-
2026-04-29$125,000 Active
-
2020-11-19soldstatus $35,000
-
2019-02-02historical 208-char remark
Show marketing remark (208 chars)
Complete main level living with split bedroom floor plan. Like new home has hardly been lived in. Refrigerator, Stove, Washer & Dryer are included. $6,000 invested in permanent block skirting around home.
-
2019-02-02historical
Show marketing remark (208 chars)
Complete main level living with split bedroom floor plan. Like new home has hardly been lived in. Refrigerator, Stove, Washer & Dryer are included. $6,000 invested in permanent block skirting around home.
-
2009-10-20soldstatus $67,500 208-char remark
Show marketing remark (208 chars)
Complete main level living with split bedroom floor plan. Like new home has hardly been lived in. Refrigerator, Stove, Washer & Dryer are included. $6,000 invested in permanent block skirting around home.
-
2009-10-20soldstatus $67,500
Show marketing remark (208 chars)
Complete main level living with split bedroom floor plan. Like new home has hardly been lived in. Refrigerator, Stove, Washer & Dryer are included. $6,000 invested in permanent block skirting around home.
-
2009-10-20soldstatus $67,500
Show marketing remark (208 chars)
Complete main level living with split bedroom floor plan. Like new home has hardly been lived in. Refrigerator, Stove, Washer & Dryer are included. $6,000 invested in permanent block skirting around home.
-
2009-05-16$74,900 208-char remark
Show marketing remark (208 chars)
Complete main level living with split bedroom floor plan. Like new home has hardly been lived in. Refrigerator, Stove, Washer & Dryer are included. $6,000 invested in permanent block skirting around home.
-
2009-05-16$74,900
Show marketing remark (208 chars)
Complete main level living with split bedroom floor plan. Like new home has hardly been lived in. Refrigerator, Stove, Washer & Dryer are included. $6,000 invested in permanent block skirting around home.
-
2007-02-21$79,900
-
2007-02-21$79,900
ⓘ Source: listings_history table (triggers on properties + properties_extension) + one-shot
backfill from property_details.listing_events for pre-trigger history.
Tax reassessment forecast MN · Partial reset (capped growth)
- Current annual tax
- $3,482 · $290/mo
- Projected year-2 tax
- $3,482 · $290/mo
- Expected delta
- $0/yr ($0/mo · 0.0%)
ⓘ Screening estimate from a state-policy table — verify with the county assessor before closing.
Nearby sold comps map
Loading sold comps map…
Walkable amenities ~0.75 mi
Loading nearby amenities…
Taxation est. · year 1
- Rental income
- $15,421
- − Mortgage interest
- −$7,002
- − Property taxes
- −$3,482
- − Insurance
- −$625
- − Repairs & maintenance
- −$1,234
- − Management
- −$1,234
- − Depreciation
- −$3,636
- Taxable loss
- −$1,792
- Est. tax savings @ 24.0%
- +$430
- After-tax cash flow
- $639/yr
For passive investors: Depreciation is non-cash, so a rental often shows a tax loss while cash-flowing — sheltering income. Rental losses are passive: they offset passive income freely, and up to $25,000/yr can offset ordinary (W-2) income if you actively participate and your MAGI is under $100k (phasing out to $0 by $150k); unused losses carry forward. On sale, claimed depreciation is recaptured at up to 25%, and gains may owe capital-gains tax (a 1031 exchange can defer both). Figures are a year-1 estimate at your 24.0% rate — not tax advice; consult a CPA.
Schools (NCES district)
- District
- Milroy Public School District
- NCES district ID
- 2721210
- Math proficiency
- 40% ▲ 19.00%
- Reading proficiency
- 40% ▬ 0.00%
- Median HH income
- $53,824
- Composite
- 37.29/100
- National rank
- #8961
- State rank
- #352 of 467 in MN
Livability — Milroy
- Score
- 67/100
- State rank
- #449
- US rank
- #10645
Category grades
Schools grade is shown separately in the Schools card above.
Census & demographics
- Census place
- Milroy, MN
- Population (ZIP)
- 452
Population outlook (Redwood County) Hauer SSP2
- Today (2025)
- 14,504 people
- By 2030
- 13,983 · -3.6%
- By 2040
- 13,056 · -10.0%
- By 2050
- 12,225 · -15.7%
- By 2075
- 11,051 · -23.8%
- By 2100
- 9,786 · -32.5%
Race, ethnicity, and origin ACS 2023
- Neighborhood character
- Predominantly White (92%)
- Race & ethnicity
- White 92% Two or more races 5% Asian 2%
- Common ancestry
- Portuguese 12% English 9% Romanian 6%
- Languages at home
- 99% English-only · Other Asian/Pacific 1%
Political lean MEDSL · Redwood
- 2024 margin
- Solid R (+43.3) · D 27.7% · R 71.0% · Other 1.2%
- 2008→2024 swing
- -29.8pp toward R · 2008: -13.6pp · 2024: -43.3pp
- All cycles
- 2024: R+43.3 2020: R+41.2 2016: R+43.0 2012: R+20.1 2008: R+13.6
Not yet ingested
- Civics
- —
Market trends
- HPI YoY
- —
- Current HPI
- —
- Rent YoY
- —
- Metro
- —
- State GDP YoY
- ▲ 2.41%
- F500 in state
- 34
Industry mix (Fortune 500 HQ in MN)
| Industry | F500 HQs | Revenue |
|---|---|---|
| Healthcare | 2 | $407B |
|
||
| Retail | 2 | $150B |
|
||
| Consumer Goods | 2 | $32B |
|
||
| Industrial Machinery | 2 | $6B |
|
||
| Agriculture | 1 | $40B |
|
||
| Healthcare / Medical Devices | 1 | $32B |
|
||
Price history
+56.4% since first listed12 events — show timeline
- 2026-04-29 Pending — NORTHSTARMLS as Distributed by MLS Grid
- 2026-04-29 Listed $125,000 NORTHSTARMLS as Distributed by MLS Grid
- 2020-11-19 Sold (Public Records) $35,000 Public Records
- 2019-02-02 Listing Removed — NORTHSTARMLS as Distributed by MLS Grid
- 2019-02-02 Listing Removed — NORTHSTARMLS as Distributed by MLS Grid
- 2009-10-20 Sold (Public Records) $67,500 Public Records
- 2009-10-20 Sold (MLS) $67,500 NORTHSTARMLS as Distributed by MLS Grid
- 2009-10-20 Sold (MLS) $67,500 NORTHSTARMLS as Distributed by MLS Grid
- 2009-05-16 Listed $74,900 NORTHSTARMLS as Distributed by MLS Grid
- 2009-05-16 Listed $74,900 NORTHSTARMLS as Distributed by MLS Grid
- 2007-02-21 Listed $79,900 NORTHSTARMLS as Distributed by MLS Grid
- 2007-02-21 Listed $79,900 NORTHSTARMLS as Distributed by MLS Grid
Property tax history
+11.3%/yrLatest (2025): $3,482 · +10.8% YoY. Source: county tax records.
Cash-flow waterfall
monthlySold comps — $/sqft
last 12 mo · ≤1 miLoading sold comps…