3718 N 23rd St · Omaha, NE
Flood risk 1/10 · Minimal
- FEMA flood zone
- X (unshaded)
- Chance of flooding over 30 yrs
- 0.0%
- Est. flood insurance / yr
- $473 – $860
Fire risk 1/10 · Minimal
- Est. fire insurance / yr
- $1,161 – $2,155
Heat risk 3/10 · Minor
- Hot days now (above 105°F)
- 7 days/yr
- Hot days in 30 yrs
- 15 days/yr
Wind risk 2/10 · Minimal
- Chance of severe wind over 30 yrs
- —
Air-quality risk 2/10 · Minimal
- Unhealthy air days now
- 1 days/yr
- Unhealthy air days in 30 yrs
- 1 days/yr
Risk factors via First Street. Map © Google.
Why this score? — see what drove the B grade
The composite is a weighted blend of 9 inputs, each scored 0–100. Each bar is that input's sub-score; the figure is the points it added to the 100-point composite (weight × sub-score).
- Cash flow +28.9/30.0
- ARV discount +15.0/15.0
- DSCR +10.0/10.0
- 1% rule +8.1/10.0
- Livability +4.2/5.0
- Rent growth +2.5/5.0
- Condition / age +2.5/5.0
- Schools +2.1/10.0
- Appreciation +0.0/10.0
$115,000
🖨 Deal sheet 📄 Offer letter ✓ Due diligence
Listing remarks
INVESTOR SPECIAL! Looking for your next opportunity? This could be the diamond in the rough you’ve been waiting for. Located in an evolving pocket of North Omaha, this property offers strong potential for investors or buyers ready to bring new life into a home. The 1.5 story layout includes three bedrooms upstairs plus a main-level bedroom, offering optimal living space. Enjoy quick access to Highway 75 and an easy drive to Downtown Omaha, making commuting and rental appeal a major plus. Close to neighborhood green spaces, including Kountze Park and Florence Park, with larger outdoor recreation at Hummel Park — all contributing to consistent rental demand and long-term investmen
Key facts
- 6,098 sq ft lot
- Built 1905
- Listed 56 days
Tags
Property features AI
Exterior
- Parking: No garage
- Utilities: Electricity available; Natural gas available; Public water; Public sewer
- Home design: Single-family residence; One and one-half stories; Not new (originally built in 1905)
- Construction: Vinyl siding; Block foundation; Composition roof; Built in 1905
- Exterior features: Porch; Deck; City lot with alley access; Lot approximately 50 x 124 (about 0.14 acre)
Interior
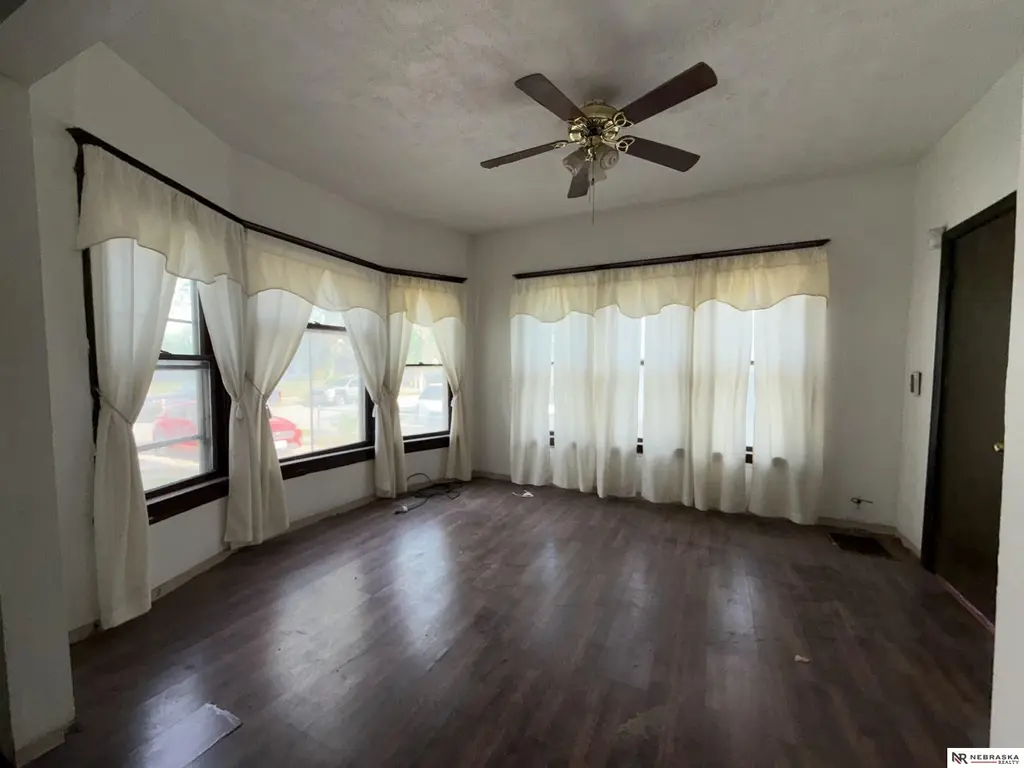
- Bedrooms: Master bedroom on 2nd floor; Additional bedrooms on 2nd floor and main floor
- Flooring: Carpet; Wood
- Bathrooms: One full bathroom; Master bathroom with 3/4 bath
- Heating & cooling: Natural gas forced-air heating; Central air conditioning
- Interior features: Unfinished basement (about 832 below-grade area); No fireplaces; Carpet and wood flooring
Neighborhood map
What this means for you Summary
Snapshot
- This is a 4-bed/1.0-bath other listed at $115k.
Deal economics
- At list price, monthly cash flow is $388 ($5k/yr) — positive.
- The deal already cash-flows at list — no discount required.
- Meets the 1% rule at list price ($2k rent vs $115k).
- Recommended offer: $112k (3.0% below list) — sets the bar for market timing.
- Cap rate 10.3% vs local median 3.6% in Omaha — top-decile yield for the area; either an underpriced asset or a hidden risk that comps aren't pricing in. Stress-test before assuming the spread holds.
Location & tenants
- Location reads 84/100 on livability (#7 in NE, #663 nationally) — a professional / high-income tenant draw. Strengths: amenities A+, commute A+, cost of living A+; Watch: crime F.
- Omaha Public Schools (urban): math 20% / reading 28% proficiency, ranked #110 of 111 in NE (top 99%) — low school quality limits family demand, transient renter base, plan for 1-2y turnover; 62% free/reduced lunch — lower-income household profile, screen leases tightly.
- Zoned schools: Lothrop Magnet Center (math 17% / reading 27%, grade F, #459 of 502 statewide, top 93%, 349 students, 0% FRL); King Science/Tech Magnet Middle School (math 15% / reading 24%, grade F, #121 of 128 statewide, top 95%, 667 students, 0% FRL); North High School (math 21% / reading 25%, grade F, #247 of 261 statewide, top 95%, 1,796 students, 0% FRL) — zoned schools average 0% FRL vs 62% district-wide (62 pts lower); this property's tenant base skews higher-income than the district average.
- Market conditions: 45 active listings in the ZIP; 8 comparable units currently listed for rent nearby; rentals lingering (median 44d on market — plan ~5-8 weeks vacancy on turnover, expect pricing pressure); 62% of comp listings sitting > 30 days — soft ceiling on asking rent; 4,539 units permitted in Douglas County in 2024 (2,583 in 5+ unit buildings).
Forward outlook
- Local home prices are declining (-3.0%/yr); year-one equity from $795 of loan paydown is wiped out by about $3k of value loss. Plan a longer hold.
- Douglas County population projected at +28% by 2050 — long-run rental-demand tailwind backs the buy-and-hold thesis.
- At projected returns (-3.0% appreciation + 3.0% rent growth), your $32k cash investment doubles in ~9 years — after that, you're playing with house money.
Negotiation context
- It's been on market 56 days — a 3% lower offer ($112k) is reasonable based on typical stale-listing flexibility.
- 2 sale attempts with the ask held roughly flat each time — persistent listings suggest the price (not the market) is what's stuck; bring a comps-based counter.
- Current owner paid $54k; list at $115k implies a 114% gain — meaningful room to come down on a strong offer.
Risks & watch-outs
- Watch-outs: built in 1905 — expect roof / HVAC / electrical / plumbing capex.
Questions for the listing agent
- It's been on market 56 days. Have you received any prior offers? Is the seller open to a 3% concession, seller financing, or rate buy-down credit?
- Built in 1905 — when were the roof, HVAC, electrical panel, plumbing, and water heater last replaced?
- Is there a deadline driving the sale (1031 exchange, divorce, estate, relocation)? That informs how much negotiation room exists.
- Crime grade is F in this area — have there been break-ins, vandalism, or insurance claims at this property in the last 3 years? What carrier currently insures it and at what premium?
- What's the average days-on-market for RENTAL listings here right now (not sales)? A rising rental-DOM trend means longer vacancies and softer asking-rent achievability than the comps imply.
- What's the recent tenant-quality profile in this submarket — average credit score on applications, eviction rate, late-payment / NSF rate, and stable-employment percentage? A property-management company in the area should have these aggregated.
- How much new for-sale + rental construction is in the pipeline within 1–3 miles? Heavy new supply typically softens prices + rents 12–24 months out; constrained supply supports both.
Investment metrics
- 1% rule
- 1.31% ✓
- Cap rate
- 10.35%
- Cash-on-cash
- 14.47%
- DSCR
- 1.64
- GRM
- 6.4
CMA / ARV
- ARV (median comp)
- $143,074
- List price
- $115,000
- Delta
- -19.62%
- Verdict
- UNDERPRICED
- Comps
- 20 within 1.0 mi
Projected returns pro-forma
-3.0% appreciation · 3.0% rent growth · sell at horizon
- IRR
- 4.9%
- Equity multiple
- 1.19×
- Total profit
- $6,130
- Equity at exit
- $17,147
- IRR
- 14.4%
- Equity multiple
- 2.16×
- Total profit
- $37,304
- Equity at exit
- $9,943
Cash invested: $32,200 (down + closing). Projections, not guarantees.
Landlord ↔ Tenant lean methodology
- Overall (STATE)
- 83 Strongly Landlord-Friendly
- State Nebraska
- 83 Strongly Landlord-Friendly · R+13
- County
- — inherits STATE
- City
- — inherits STATE
ZIP-level market 68110
- Home prices YoY
- -9.5%
- Active inventory
- 45
- Price-to-rent
- 6.4×
Monthly cashflow live
- Estimated rent
- $1,509 high interval (Pro) →
- Mortgage (P&I)
- −$603
- Tax from tax record
- −$153 /mo · $1,831/yr
- Insurance
- −$48
- HOA
- −$0
- Vacancy / Maint / Mgmt
- −$317
- Net cashflow
- $388
Break-even live
UW: 25.0% down · 7.5% · 30yr · 1.5% tax · 5.0% vac · 8.0% maint · 8.0% mgmt
Financing live
Cash to close
- Down payment
- $28,750
- Closing costs
- $3,450
- Reserves months
- —
- Total cash needed
- —
Loan-product check · same deal, 3 products live
Conventional
25% down · 7.5% · 30yr
- Down + closing
- —
- Monthly P&I
- —
- Monthly cashflow
- —
- DSCR
- —
- Eligible?
- —
Personal DTI + credit; lowest rate.
DSCR
20% down · 8.5% · 30yr
- Down + closing
- —
- Monthly P&I
- —
- Monthly cashflow
- —
- DSCR
- —
- Eligible?
- —
No personal income docs; deal must DSCR.
Hard money
10% down · 12.0% · 12mo
- Down + closing
- —
- Monthly P&I
- —
- Monthly cashflow
- —
- DSCR
- —
- Eligible?
- —
Short-term bridge; refi at stabilization.
Rent comps 8 comps
| Address | Beds | Baths | Sqft | Rent | $/sqft | DOM | Units | Dist |
|---|---|---|---|---|---|---|---|---|
| 3708 Florence Blvd Omaha, NE | 3.0 | 1.0 | 1102 | $1,395 | $1.27 | 21d | 1 | 0.23mi |
| 4201 N 22nd St Omaha, NE | 3.0 | 1.0 | 1380 | $1,545 | $1.12 | 43d | 1 | 0.30mi |
| 4125 N 19th St Omaha, NE | 3.0 | 1.0 | 1266 | $1,532 | $1.21 | 43d | 1 | 0.38mi |
| 2416 Fowler Ave Omaha, NE | 4.0 | 2.0 | 2169 | $1,950 | $0.90 | 14d | 1 | 0.58mi |
| 1820 Miami St Omaha, NE | 4.0 | 1.5 | 1306 | $1,050 | $0.80 | 43d | 1 | 0.71mi |
| 5348 N 25th St Omaha, NE | 4.0 | 1.0 | 1446 | $1,600 | $1.11 | 43d | 1 | 1.07mi |
| 2436 Laurel Ave Omaha, NE | 3.0 | 1.0 | 1582 | $1,495 | $0.95 | 23d | 1 | 1.35mi |
| 3510 N 9th St Lot 47 Carter Lake, IA | 3.0 | 2.0 | 1152 | $1,479 | $1.28 | 43d | 1 | 1.36mi |
Listing history 18 events
-
2026-06-18days on market $115,000 Active 56 DOM
-
2026-06-17days on market $115,000 Active 55 DOM
-
2026-06-16days on market $115,000 Active 54 DOM
-
2026-06-15days on market $115,000 Active 53 DOM
-
2026-06-13days on market $115,000 Active 51 DOM
-
2026-06-10days on market $115,000 Active 48 DOM
-
2026-06-09days on market $115,000 Active 47 DOM
-
2026-06-08days on market $115,000 Active 46 DOM
-
2026-06-07days on market $115,000 Active 45 DOM
-
2026-06-03days on market $115,000 Active 41 DOM
-
2026-06-03days on market $115,000 Active 40 DOM
-
2026-06-01days on market $115,000 Active 39 DOM
-
2026-06-01days on market $115,000 Active 38 DOM
-
2026-05-11price $115,000 895-char remark
-
2026-04-23$120,000 New 895-char remark
-
2026-04-23historical
-
2026-03-21$130,000 New
-
2026-03-20soldstatus $53,618
ⓘ Source: listings_history table (triggers on properties + properties_extension) + one-shot
backfill from property_details.listing_events for pre-trigger history.
Tax reassessment forecast NE · Resets to sale price
- Current annual tax
- $1,831 · $153/mo
- Projected year-2 tax
- $1,990 · $166/mo
- Expected delta
- +$159/yr (+$13/mo · 8.7%)
ⓘ Screening estimate from a state-policy table — verify with the county assessor before closing.
Climate risk First Street
- Flood 1/10 Low FEMA zone X (unshaded) · 0% chance over 30 yrs
- Wildfire 1/10 Low
- Heat 3/10 Moderate 7 d/yr ≥105°F today · 15 d/yr by 30 yrs out
- Wind 2/10 Low
- Air quality 2/10 Low 1 unhealthy d/yr today · 1 by 30 yrs out
Nearby sold comps map
Loading sold comps map…
Walkable amenities ~0.75 mi
Loading nearby amenities…
Taxation est. · year 1
- Rental income
- $18,106
- − Mortgage interest
- −$6,442
- − Property taxes
- −$1,831
- − Insurance
- −$575
- − Repairs & maintenance
- −$1,448
- − Management
- −$1,448
- − Depreciation
- −$3,345
- Taxable income
- $3,016
- Est. tax owed @ 24.0%
- −$724
- After-tax cash flow
- $3,937/yr
For passive investors: Depreciation is non-cash, so a rental often shows a tax loss while cash-flowing — sheltering income. Rental losses are passive: they offset passive income freely, and up to $25,000/yr can offset ordinary (W-2) income if you actively participate and your MAGI is under $100k (phasing out to $0 by $150k); unused losses carry forward. On sale, claimed depreciation is recaptured at up to 25%, and gains may owe capital-gains tax (a 1031 exchange can defer both). Figures are a year-1 estimate at your 24.0% rate — not tax advice; consult a CPA.
Schools (NCES district)
- District
- Omaha Public Schools
- NCES district ID
- 3174820
- Math proficiency
- 20% ▼ -10.00%
- Reading proficiency
- 28% ▼ -5.00%
- Median HH income
- $46,039
- Composite
- 20.83/100
- National rank
- #8502
- State rank
- #110 of 111 in NE
Livability — Omaha
- Score
- 84/100
- State rank
- #7
- US rank
- #663
Category grades
Schools grade is shown separately in the Schools card above.
Census & demographics
- Census place
- Omaha, NE
- City population
- 552,986
- Population (ZIP)
- 9,403
Population outlook (Douglas County) Hauer SSP2
- Today (2025)
- 625,245 people
- By 2030
- 661,613 · +5.8%
- By 2040
- 732,395 · +17.1%
- By 2050
- 801,988 · +28.3%
- By 2075
- 968,637 · +54.9%
- By 2100
- 1,101,871 · +76.2%
Race, ethnicity, and origin ACS 2023
- Neighborhood character
- Highly diverse neighborhood (Simpson 0.72)
- Race & ethnicity
- Black 40% White 29% Hispanic / Latino 17% Asian 9% Two or more races 8% Native American 2%
- Hispanic origin (detail)
- Mexican 15%
- Common ancestry
- Ukrainian 2% Romanian 1% Portuguese 1%
- Foreign-born
- 18% · Canada, India, Philippines
- Languages at home
- 73% English-only · Spanish 12% Other Indo-European 6% Other Asian/Pacific 3%
Political lean MEDSL · Douglas
- 2024 margin
- D (+10.2) · D 54.4% · R 44.2% · Other 1.4%
- 2008→2024 swing
- +5.5pp toward D · 2008: 4.6pp · 2024: 10.2pp
- All cycles
- 2024: D+10.2 2020: D+11.3 2016: D+1.4 2012: R+4.3 2008: D+4.6
Not yet ingested
- Civics
- —
Market trends
- HPI YoY
- ▼ -23.25%
- Current HPI
- 220.8647
- Rent YoY
- —
- Metro
- —
- State GDP YoY
- ▲ 0.68%
- F500 in state
- 2
Industry mix (Fortune 500 HQ in NE)
| Industry | F500 HQs | Revenue |
|---|---|---|
| Conglomerate | 1 | $371B |
|
||
Price history
+114.5% since first listed5 events — show timeline
- 2026-05-11 Price Changed $115,000 GPRMLS
- 2026-04-23 Listing Removed — GPRMLS
- 2026-04-23 Listed $120,000 GPRMLS
- 2026-03-21 Listed $130,000 GPRMLS
- 2026-03-20 Sold (Public Records) $53,618 Public Records
Property tax history
+8.4%/yrLatest (2025): $1,831 · -0.5% YoY. Source: county tax records.
Cash-flow waterfall
monthlySold comps — $/sqft
last 12 mo · ≤1 miLoading sold comps…