124 White Oak Dr N · Woodbranch, TX
Flood risk 7/10 · Major
- FEMA flood zone
- AE
- Chance of flooding over 30 yrs
- 0.74%
- Est. flood insurance / yr
- $1,737 – $8,500
Fire risk 4/10 · Minor
- Est. fire insurance / yr
- $1,222 – $2,270
Heat risk 9/10 · Severe
- Hot days now (above 111°F)
- 7 days/yr
- Hot days in 30 yrs
- 24 days/yr
Wind risk 9/10 · Severe
- Chance of severe wind over 30 yrs
- 99.0%
Air-quality risk 2/10 · Minimal
- Unhealthy air days now
- 2 days/yr
- Unhealthy air days in 30 yrs
- 2 days/yr
Risk factors via First Street. Map © Google.
Why this score? — see what drove the B- grade
The composite is a weighted blend of 9 inputs, each scored 0–100. Each bar is that input's sub-score; the figure is the points it added to the 100-point composite (weight × sub-score).
- Cash flow +30.0/30.0
- 1% rule +10.0/10.0
- DSCR +10.0/10.0
- ARV discount +7.5/15.0
- Livability +3.3/5.0
- Schools +2.8/10.0
- Rent growth +2.6/5.0
- Condition / age +2.5/5.0
- Appreciation +0.0/10.0
$95,000
🖨 Deal sheet 📄 Offer letter ✓ Due diligence
Listing remarks
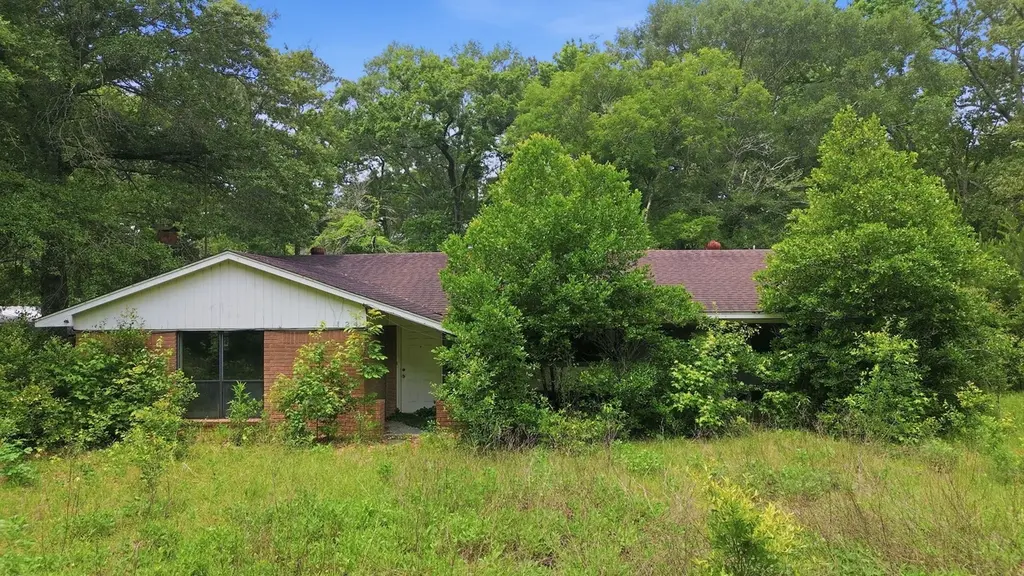
Investor special with endless potential in New Caney! Situated on a spacious lot, 124 White Oak Dr presents a prime opportunity for investors, flippers, or those looking to build new. The existing home is in need of major rehabilitation or possible tear-down, offering a blank canvas to bring your vision to life. A small warehouse/shop on the property adds additional value and only requires minor repairs, making it ideal for storage, workspace, or future use. Surrounded by growing development and conveniently located near major roadways, shopping, and local amenities, this property offers excellent potential for redevelopment or investment. Being sold as-is. Don’t miss this opportunity
Key facts
- Growing development
- Major roadways
- Spacious lot
Tags
Property features AI
Finance
- Financial info: Lease not considered
Exterior
- Parking: Detached garage
- Utilities: Public water; Public sewer
- Home design: Residential property; Built in 1964; Slab foundation
- Construction: Composition roof; Construction materials: Unknown
- Exterior features: Deck; Patio; Paved driveway; Private yard; Workshop; Backs to greenbelt/park; Wooded lot; Located in a subdivision
Interior
- Kitchen: Gas range; Oven
- Bedrooms: Primary bedroom on the first floor; Two additional bedrooms on the first floor (three bedrooms possible)
- Bathrooms: Two full bathrooms
- Heating & cooling: Central heating (gas); Central air conditioning (gas)
- Interior features: Kitchen/family room combo; Window treatments; Window coverings; One fireplace; Three total rooms
Neighborhood map
What this means for you Summary
Snapshot
- This is a 3-bed/2.0-bath single-family listed at $95k.
Deal economics
- At list price, monthly cash flow is $239 ($3k/yr) — positive.
- The deal already cash-flows at list — no discount required.
- Meets the 1% rule at list price ($2k rent vs $95k).
- Recommended offer: $94k (1.5% below list) — sets the bar for market timing.
- Cap rate 14.7% vs local median 4.4% in Woodbranch — top-decile yield for the area; either an underpriced asset or a hidden risk that comps aren't pricing in. Stress-test before assuming the spread holds.
Location & tenants
- Location reads 66/100 on livability (#646 in TX) — a middle-class / working-renter tenant base. Strengths: crime A+, cost of living A+, housing A+; Watch: amenities F, commute F, health & safety F.
- New Caney ISD (suburban): math 31% / reading 32% proficiency, ranked #570 of 826 in TX (top 69%) — families likely to look elsewhere, expect single-tenant / working-renter base with shorter leases.
- Zoned schools: Keefer Crossing Middle (math 35% / reading 31%, grade F, #930 of 1,662 statewide, top 57%, 1,213 students, 81% FRL); New Caney H S (math 24% / reading 31%, grade F, #1,183 of 1,632 statewide, top 73%, 2,428 students, 78% FRL) — zoned schools average 79% FRL vs 57% district-wide (23 pts higher); higher-poverty schools than district average — tighter screening recommended.
- Market conditions: Rents flat; 979 active listings in the ZIP; 3 comparable units currently listed for rent nearby; rentals at typical pace (median 25d on market — plan ~3-4 weeks tenant-placement turnaround); solid renter incomes; 13,259 units permitted in Montgomery County in 2024 (1,402 in 5+ unit buildings).
Forward outlook
- Local home prices are declining (-3.0%/yr); year-one equity from $657 of loan paydown is wiped out by about $3k of value loss. Plan a longer hold.
- Montgomery County population projected at +65% by 2050 — long-run rental-demand tailwind backs the buy-and-hold thesis.
Negotiation context
- It's been on market 26 days — a 2% lower offer ($94k) is reasonable based on typical stale-listing flexibility.
- 3 sale attempts with the ask held roughly flat each time — persistent listings suggest the price (not the market) is what's stuck; bring a comps-based counter.
Risks & watch-outs
- Watch-outs: flood insurance adds $427/mo.
- Climate carrying-cost: in FEMA flood zone AE (mandatory federal flood insurance); severe wind risk, 99% chance of damaging wind over 30y; extreme-heat days projected 7→24/yr by 2055 (HVAC capex compounding) — expect insurance premiums to compound above CPI over the hold.
Questions for the listing agent
- Built in 1964 — when were the roof, HVAC, electrical panel, plumbing, and water heater last replaced?
- What's the actual annual flood-insurance premium (NFIP or private), and is the property in a SFHA with mandatory coverage?
- Is there a deadline driving the sale (1031 exchange, divorce, estate, relocation)? That informs how much negotiation room exists.
- Schools are F-rated, which usually means shorter tenancies and higher turnover. Who's the typical renter profile here, and what's been the actual vacancy rate?
- What's the average days-on-market for RENTAL listings here right now (not sales)? A rising rental-DOM trend means longer vacancies and softer asking-rent achievability than the comps imply.
- What's the recent tenant-quality profile in this submarket — average credit score on applications, eviction rate, late-payment / NSF rate, and stable-employment percentage? A property-management company in the area should have these aggregated.
- How much new for-sale + rental construction is in the pipeline within 1–3 miles? Heavy new supply typically softens prices + rents 12–24 months out; constrained supply supports both.
Investment metrics
- 1% rule
- 1.85% ✓
- Cap rate
- 14.69%
- Cash-on-cash
- 30.00%
- DSCR
- 2.33
- GRM
- 4.5
CMA / ARV
- ARV (median comp)
- $284,690
- List price
- $95,000
- Delta
- -66.63%
- Verdict
- UNDERPRICED
- Comps
- 20 within 1.0 mi
Show comp detail 12 sales within ~0.75 mi
| Address | Dist | Beds/Ba | Sqft | Sold | Price | $/sf | Match |
|---|---|---|---|---|---|---|---|
| 19079 Pinewood Grove Trl | 0.40mi | 3/2.0 | 1,691 (+0%) | 5mo | $295,000 | $174 | 77 |
| 23846 Via Leoni Dr | 0.28mi | 3/2.0 | 1,801 (+7%) | 3mo | $259,990 | $144 | 73 |
| 218 Chariot Ln | 0.37mi | 4/2.0 (+1) | 1,672 (-1%) | 11mo | $254,900 | $152 | 67 |
| 350 Chariot Ln | 0.37mi | 3/2.0 | 1,600 (-5%) | 11mo | $699,900 | $437 | 65 |
| 23906 Olivenza Trl | 0.41mi | 3/2.0 | 1,525 (-10%) | 4mo | $225,700 | $148 | 61 |
| 18840 Palmetto Hills Dr | 0.47mi | 3/2.0 | 1,786 (+6%) | 9mo | $259,900 | $146 | 61 |
| 402 Eastwood Dr | 0.70mi | 3/2.0 | 1,678 (-1%) | 11mo | $299,000 | $178 | 57 |
| 1914 Southwood Dr | 0.50mi | 3/2.0 | 1,470 (-13%) | 2mo | $248,000 | $169 | 54 |
| 18934 Sorrento Point Dr | 0.69mi | 3/2.0 | 1,636 (-3%) | 11mo | $266,900 | $163 | 53 |
| 442 Eastwood Dr | 0.70mi | 3/2.0 | 1,780 (+6%) | 12mo | $343,000 | $193 | 48 |
| 322 Linnwood Dr | 0.70mi | 3/2.0 | 1,859 (+10%) | 10mo | $350,000 | $188 | 42 |
| 2111 Woodway Dr | 0.63mi | 3/2.0 | 1,446 (-14%) | 7mo | $235,000 | $163 | 41 |
Match score weights: distance 35% · size 25% · config 20% · recency 20%. Top-matched comps best support the ARV.
Projected returns pro-forma
-3.0% appreciation · 0.21% rent growth · sell at horizon
- IRR
- -4.9%
- Equity multiple
- 0.82×
- Total profit
- $-4,672
- Equity at exit
- $14,165
- IRR
- -1.2%
- Equity multiple
- 0.93×
- Total profit
- $-1,795
- Equity at exit
- $8,214
Cash invested: $26,600 (down + closing). Projections, not guarantees.
Landlord ↔ Tenant lean methodology
- Overall (STATE)
- 87 Strongly Landlord-Friendly
- State Texas
- 87 Strongly Landlord-Friendly · R+5
- County
- — inherits STATE
- City
- — inherits STATE
ZIP-level market 77357
- Home prices YoY
- -24.7%
- Rents YoY
- 0.2%
- Active inventory
- 979
- Price-to-rent
- 4.5×
Monthly cashflow live
- Estimated rent
- $1,758 medium interval (Pro) →
- Mortgage (P&I)
- −$498
- Tax from tax record
- −$186 /mo · $2,229/yr
- Insurance
- −$40
- Flood insurance flood zone
- −$427 /mo · $5,118/yr
- HOA
- −$0
- Vacancy / Maint / Mgmt
- −$369
- Net cashflow
- $239
Break-even live
UW: 25.0% down · 7.5% · 30yr · 1.5% tax · 5.0% vac · 8.0% maint · 8.0% mgmt
Financing live
Cash to close
- Down payment
- $23,750
- Closing costs
- $2,850
- Reserves months
- —
- Total cash needed
- —
Loan-product check · same deal, 3 products live
Conventional
25% down · 7.5% · 30yr
- Down + closing
- —
- Monthly P&I
- —
- Monthly cashflow
- —
- DSCR
- —
- Eligible?
- —
Personal DTI + credit; lowest rate.
DSCR
20% down · 8.5% · 30yr
- Down + closing
- —
- Monthly P&I
- —
- Monthly cashflow
- —
- DSCR
- —
- Eligible?
- —
No personal income docs; deal must DSCR.
Hard money
10% down · 12.0% · 12mo
- Down + closing
- —
- Monthly P&I
- —
- Monthly cashflow
- —
- DSCR
- —
- Eligible?
- —
Short-term bridge; refi at stabilization.
Rent comps 3 comps
| Address | Beds | Baths | Sqft | Rent | $/sqft | DOM | Units | Dist |
|---|---|---|---|---|---|---|---|---|
| 100 Artesian Way Roman Forest, TX | 3.0 | 3.0 | 1569 | $1,495 | $0.95 | 44d | 1 | 1.23mi |
| 630 Magnolia Bnd Roman Forest, TX | 3.0 | 2.5 | 1450 | $1,545 | $1.07 | 24d | 1 | 1.41mi |
| 634 Magnolia Bnd New Caney, TX | 3.0 | 2.5 | 1450 | $1,485 | $1.02 | 21d | 1 | 1.41mi |
Listing history 9 events
-
2026-06-18days on market $95,000 Active 26 DOM
-
2026-06-17days on market $95,000 Active 25 DOM
-
2026-06-16days on market $95,000 Active 24 DOM
-
2026-06-15days on market $95,000 Active 23 DOM
-
2026-06-13statusdays on market $95,000 Active 21 DOM
-
2026-05-31days on market $95,000 Pending 20 DOM
-
2026-05-18status Pending 744-char remark
-
2026-05-11$95,000 Active 744-char remark
-
1995-05-24soldstatus $88,312
ⓘ Source: listings_history table (triggers on properties + properties_extension) + one-shot
backfill from property_details.listing_events for pre-trigger history.
Tax reassessment forecast TX · Resets to sale price
- Current annual tax
- $2,229 · $186/mo
- Projected year-2 tax
- $2,229 · $186/mo
- Expected delta
- $0/yr ($0/mo · 0.0%)
ⓘ Screening estimate from a state-policy table — verify with the county assessor before closing.
Climate risk First Street
- Flood 7/10 Severe FEMA zone AE · 74% chance over 30 yrs
- Wildfire 4/10 Moderate
- Heat 9/10 Extreme 7 d/yr ≥111°F today · 24 d/yr by 30 yrs out
- Wind 9/10 Extreme 99% chance of damaging wind over 30 yrs
- Air quality 2/10 Low 2 unhealthy d/yr today · 2 by 30 yrs out
Nearby sold comps map
Loading sold comps map…
Walkable amenities ~0.75 mi
Loading nearby amenities…
Taxation est. · year 1
- Rental income
- $21,093
- − Mortgage interest
- −$5,321
- − Property taxes
- −$2,229
- − Insurance
- −$5,594
- − Repairs & maintenance
- −$1,687
- − Management
- −$1,687
- − Depreciation
- −$2,764
- Taxable income
- $1,810
- Est. tax owed @ 24.0%
- −$434
- After-tax cash flow
- $2,428/yr
For passive investors: Depreciation is non-cash, so a rental often shows a tax loss while cash-flowing — sheltering income. Rental losses are passive: they offset passive income freely, and up to $25,000/yr can offset ordinary (W-2) income if you actively participate and your MAGI is under $100k (phasing out to $0 by $150k); unused losses carry forward. On sale, claimed depreciation is recaptured at up to 25%, and gains may owe capital-gains tax (a 1031 exchange can defer both). Figures are a year-1 estimate at your 24.0% rate — not tax advice; consult a CPA.
Schools (NCES district)
- District
- New Caney ISD
- NCES district ID
- 4832400
- Math proficiency
- 31% ▼ -16.00%
- Reading proficiency
- 32% ▼ -6.00%
- Median HH income
- $55,380
- Composite
- 27.97/100
- National rank
- #6857
- State rank
- #570 of 826 in TX
Livability — Woodbranch
- Score
- 66/100
- State rank
- #646
- US rank
- #12243
Category grades
Schools grade is shown separately in the Schools card above.
Census & demographics
- Census place
- Woodbranch, TX
- County
- Montgomery County · 663,713 people
- Metro
- Houston-The Woodlands-Sugar Land, TX
- Population (ZIP)
- 37,592
- Household income
- $76,050
- Rent vs Own
- Severe rent burden
- 487.0
Population outlook (Montgomery County) Hauer SSP2
- Today (2025)
- 713,896 people
- By 2030
- 805,263 · +12.8%
- By 2040
- 992,708 · +39.1%
- By 2050
- 1,179,590 · +65.2%
- By 2075
- 1,628,084 · +128.1%
- By 2100
- 1,937,880 · +171.5%
Race, ethnicity, and origin ACS 2023
- Neighborhood character
- Diverse neighborhood (Simpson 0.56)
- Race & ethnicity
- Hispanic / Latino 49% White 45% Two or more races 31% Black 3%
- Hispanic origin (detail)
- Mexican 40%
- Common ancestry
- Lithuanian 2% Romanian 1% Iranian 1%
- Foreign-born
- 23% · Canada, Jamaica
- Languages at home
- 58% English-only · Spanish 40% Other Indo-European 1%
Political lean MEDSL · Montgomery
- 2024 margin
- Solid R (+45.5) · D 26.8% · R 72.3%
- 2008→2024 swing
- +7.2pp toward D · 2008: -52.7pp · 2024: -45.5pp
- All cycles
- 2024: R+45.5 2020: R+43.8 2016: R+51.4 2012: R+60.7 2008: R+52.7
Not yet ingested
- Civics
- —
Market trends
- HPI YoY
- ▼ -87.71%
- Current HPI
- 266.8315
- Rent YoY
- ▲ 0.21%
- Metro
- Houston-The Woodlands-Sugar Land, TX
- State GDP YoY
- ▲ 3.95%
- F500 in state
- 110
Industry mix (Fortune 500 HQ in TX)
| Industry | F500 HQs | Revenue |
|---|---|---|
| Energy | 16 | $1,198B |
|
||
| Technology | 5 | $198B |
|
||
| Engineering / Construction | 4 | $72B |
|
||
| Energy Services | 3 | $60B |
|
||
| Utilities | 3 | $41B |
|
||
| Healthcare | 2 | $330B |
|
||
Price history
+7.6% since first listed7 events — show timeline
- 2026-06-12 Relisted — HARMLS
- 2026-06-01 Pending — HARMLS
- 2026-05-26 Pending — HARMLS
- 2026-05-20 Relisted — HARMLS
- 2026-05-18 Pending — HARMLS
- 2026-05-11 Listed $95,000 HARMLS
- 1995-05-24 Sold (Public Records) $88,312 Public Records
Property tax history
+0.6%/yrLatest (2025): $2,229 · -7.9% YoY. Source: county tax records.
Cash-flow waterfall
monthlySold comps — $/sqft
last 12 mo · ≤1 miLoading sold comps…