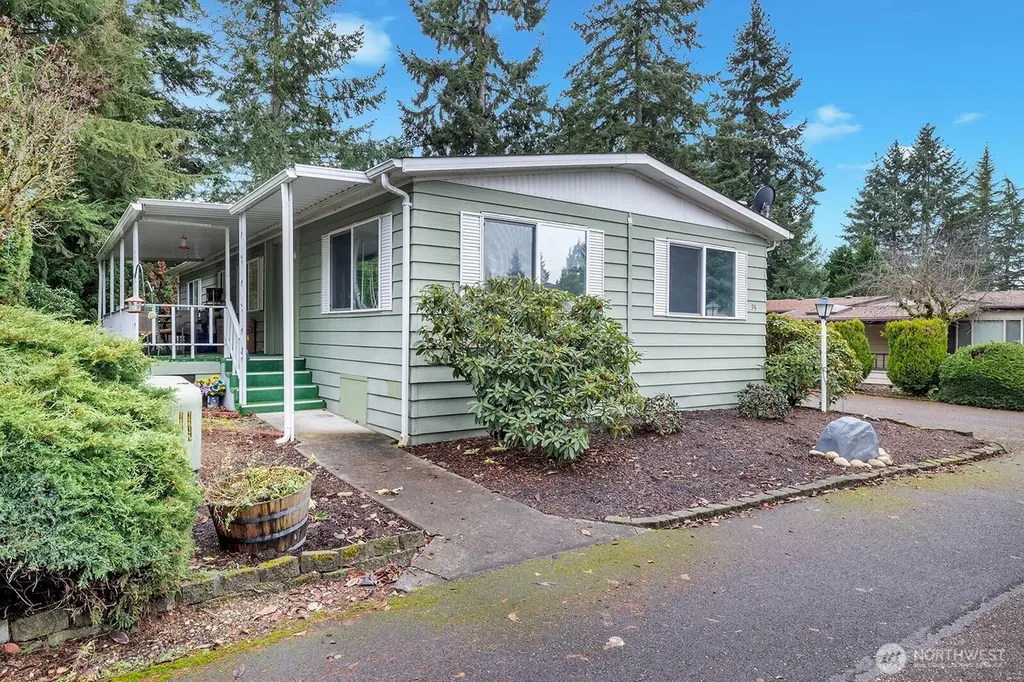
12502 123rd Street Ct E #35 · South Hill, WA
Flood risk 1/10 · Minimal
- FEMA flood zone
- X (unshaded)
- Chance of flooding over 30 yrs
- 0.0%
- Est. flood insurance / yr
- $507 – $1,088
Fire risk 1/10 · Minimal
- Est. fire insurance / yr
- $604 – $1,122
Heat risk 3/10 · Minor
- Hot days now (above 88°F)
- 7 days/yr
- Hot days in 30 yrs
- 15 days/yr
Wind risk 1/10 · Minimal
- Chance of severe wind over 30 yrs
- —
Air-quality risk 7/10 · Major
- Unhealthy air days now
- 10 days/yr
- Unhealthy air days in 30 yrs
- 10 days/yr
Risk factors via First Street. Map © Google.
Why this score? — see what drove the B grade
The composite is a weighted blend of 9 inputs, each scored 0–100. Each bar is that input's sub-score; the figure is the points it added to the 100-point composite (weight × sub-score).
- Cash flow +30.0/30.0
- DSCR +10.0/10.0
- 1% rule +9.1/10.0
- ARV discount +7.7/15.0
- Schools +5.4/10.0
- Livability +4.0/5.0
- Rent growth +2.9/5.0
- Condition / age +2.5/5.0
- Appreciation +0.0/10.0
$149,250
🖨 Deal sheet 📄 Offer letter ✓ Due diligence
Listing remarks
Affordable fees are hard to find in 55+ communities. Country Dale is a 55+ communitys that is tucked back in a private country setting Enjoy the peaceful atmosphere where you can truly relax. This home is perfectly positioned on the lot, so you have street presence & a backyard w/ room for outdoor entertaining/projects or place for Fido to play. Mature landscaping borders the home w/ year-round greenery. Warm Inviting and well designed & comfortable interior, Casual & formal spaces for everyday living. Light & open living room has plenty of natural lighting. No doom & gloom here. Large, open kitchen with tons of storge and prep space and a/breakfast bar for the
Key facts
- Community club house
- Easy commute
- Mature landscaping
Tags
Neighborhood map
What this means for you Summary
Snapshot
- This is a 2-bed/2.0-bath manufactured listed at $149k.
Deal economics
- At list price, monthly cash flow is $636 ($8k/yr) — positive.
- The deal already cash-flows at list — no discount required.
- Meets the 1% rule at list price ($2k rent vs $149k).
- Recommended offer: $131k (12.0% below list) — sets the bar for market timing.
- Cap rate 11.4% vs local median 3.0% in South Hill — top-decile yield for the area; either an underpriced asset or a hidden risk that comps aren't pricing in. Stress-test before assuming the spread holds.
Location & tenants
- Location reads 80/100 on livability (#84 in WA, #1,620 nationally) — a professional / high-income tenant draw. Strengths: employment A+, housing A+, health & safety A+; Watch: crime C-, schools D+, cost of living F.
- Puyallup School District (suburban): math 53% / reading 66% proficiency, ranked #52 of 291 in WA (top 18%) — acceptable for families but not a draw, mixed tenant base, ~2y average lease.
- Market conditions: Rents rising (+1.7%/yr); 440 active listings in the ZIP; 15 comparable units currently listed for rent nearby; rentals at typical pace (median 17d on market — plan ~3-4 weeks tenant-placement turnaround); high-income renter base; 3,209 units permitted in Pierce County in 2024 (1,269 in 5+ unit buildings).
Forward outlook
- Local home prices are declining (-3.0%/yr); year-one equity from $1k of loan paydown is wiped out by about $4k of value loss. Plan a longer hold.
- Pierce County population projected at +26% by 2050 — long-run rental-demand tailwind backs the buy-and-hold thesis.
- At projected returns (-3.0% appreciation + 1.7% rent growth), your $42k cash investment doubles in ~8 years — after that, you're playing with house money.
Negotiation context
- It's been on market 192 days — a 12% lower offer ($131k) is reasonable based on typical stale-listing flexibility.
- 4 sale attempts since 7y ago with the ask held roughly flat each time — persistent listings suggest the price (not the market) is what's stuck; bring a comps-based counter.
- Current owner paid $80k; list at $149k implies a 88% gain — meaningful room to come down on a strong offer.
Questions for the listing agent
- It's been on market 192 days. Have you received any prior offers? Is the seller open to a 12% concession, seller financing, or rate buy-down credit?
- Built in 1979 — when were the roof, HVAC, electrical panel, plumbing, and water heater last replaced?
- Why hasn't it sold? Are there any deal-killer items the seller is aware of (foundation, flood, title, zoning, code violations)?
- Is there a deadline driving the sale (1031 exchange, divorce, estate, relocation)? That informs how much negotiation room exists.
- Schools are D-rated, which usually means shorter tenancies and higher turnover. Who's the typical renter profile here, and what's been the actual vacancy rate?
- What's the average days-on-market for RENTAL listings here right now (not sales)? A rising rental-DOM trend means longer vacancies and softer asking-rent achievability than the comps imply.
- What's the recent tenant-quality profile in this submarket — average credit score on applications, eviction rate, late-payment / NSF rate, and stable-employment percentage? A property-management company in the area should have these aggregated.
- How much new for-sale + rental construction is in the pipeline within 1–3 miles? Heavy new supply typically softens prices + rents 12–24 months out; constrained supply supports both.
Investment metrics
- 1% rule
- 1.41% ✓
- Cap rate
- 11.41%
- Cash-on-cash
- 18.27%
- DSCR
- 1.81
- GRM
- 5.9
CMA / ARV
- ARV (median comp)
- $150,000
- List price
- $149,250
- Delta
- -0.50%
- Verdict
- FAIR
- Comps
- 15 within 1.0 mi
Show comp detail 12 sales within ~0.75 mi
| Address | Dist | Beds/Ba | Sqft | Sold | Price | $/sf | Match |
|---|---|---|---|---|---|---|---|
| 4116 20th Pl SE | 0.58mi | 3/2.0 (+1) | 1,238 (-0%) | 0mo | $406,000 | $328 | 67 |
| 12420 123rd St E #56 | 0.05mi | 3/2.0 (+1) | 1,388 (+12%) | 11mo | $185,000 | $133 | 64 |
| 12719 121st Avenue Ct E #14 | 0.34mi | 3/2.0 (+1) | 1,188 (-4%) | 12mo | $160,000 | $135 | 62 |
| 11429 124th Street Ct E #121 | 0.66mi | 2/2.0 | 1,244 (+0%) | 8mo | $115,000 | $92 | 62 |
| 11415 127th St E #186 | 0.66mi | 2/2.0 | 1,339 (+8%) | 3mo | $80,000 | $60 | 53 |
| 11615 121st Avenue Ct E | 0.45mi | 3/2.0 (+1) | 1,188 (-4%) | 21mo | $451,000 | $380 | 49 |
| 12516 115th Avenue Ct E #194 | 0.59mi | 3/2.0 (+1) | 1,080 (-13%) | 2mo | $150,000 | $139 | 44 |
| 11328 126th St E #228 | 0.69mi | 2/1.0 | 1,120 (-10%) | 8mo | $40,000 | $36 | 41 |
| 12624 121st Avenue Ct E #22 | 0.31mi | 3/1.0 (+1) | 1,080 (-13%) | 18mo | $142,000 | $131 | 39 |
| 12416 114th Ave E #105 | 0.68mi | 2/2.0 | 1,056 (-15%) | 6mo | $20,000 | $19 | 38 |
| 11401 125th Street Ct E #218 | 0.67mi | 3/2.0 (+1) | 1,404 (+13%) | 8mo | $139,950 | $100 | 35 |
| 13315 126th Ave E | 0.65mi | 2/2.0 | 1,056 (-15%) | 21mo | $395,000 | $374 | 27 |
Match score weights: distance 35% · size 25% · config 20% · recency 20%. Top-matched comps best support the ARV.
Projected returns pro-forma
-3.0% appreciation · 1.72% rent growth · sell at horizon
- IRR
- 8.5%
- Equity multiple
- 1.33×
- Total profit
- $13,689
- Equity at exit
- $22,254
- IRR
- 16.6%
- Equity multiple
- 2.28×
- Total profit
- $53,498
- Equity at exit
- $12,904
Cash invested: $41,790 (down + closing). Projections, not guarantees.
Landlord ↔ Tenant lean methodology
- Overall (STATE)
- 28 Tenant-Leaning
- State Washington
- 28 Tenant-Leaning · D+8
- County
- — inherits STATE
- City
- — inherits STATE
ZIP-level market 98374
- Rents YoY
- 1.7%
- Active inventory
- 440
- Price-to-rent
- 5.9×
Monthly cashflow live
- Estimated rent
- $2,111 high interval (Pro) →
- Mortgage (P&I)
- −$783
- Tax est. 1.5%
- −$187 /mo · $2,239/yr
- Insurance
- −$62
- HOA
- −$0
- Vacancy / Maint / Mgmt
- −$443
- Net cashflow
- $636
Break-even live
UW: 25.0% down · 7.5% · 30yr · 1.5% tax · 5.0% vac · 8.0% maint · 8.0% mgmt
Financing live
Cash to close
- Down payment
- $37,312
- Closing costs
- $4,478
- Reserves months
- —
- Total cash needed
- —
Loan-product check · same deal, 3 products live
Conventional
25% down · 7.5% · 30yr
- Down + closing
- —
- Monthly P&I
- —
- Monthly cashflow
- —
- DSCR
- —
- Eligible?
- —
Personal DTI + credit; lowest rate.
DSCR
20% down · 8.5% · 30yr
- Down + closing
- —
- Monthly P&I
- —
- Monthly cashflow
- —
- DSCR
- —
- Eligible?
- —
No personal income docs; deal must DSCR.
Hard money
10% down · 12.0% · 12mo
- Down + closing
- —
- Monthly P&I
- —
- Monthly cashflow
- —
- DSCR
- —
- Eligible?
- —
Short-term bridge; refi at stabilization.
Rent comps 15 comps
| Address | Beds | Baths | Sqft | Rent | $/sqft | DOM | Units | Dist |
|---|---|---|---|---|---|---|---|---|
| 12123 125th Avenue Ct E Puyallup, WA | 2.0 | 2.0 | 1110 | $2,100 | $1.89 | 43d | 1 | 0.15mi |
| 12317 121st Avenue Ct E Puyallup, WA | 2.0 | 2.0 | 1034 | $2,400 | $2.32 | 17d | 1 | 0.17mi |
| 12317 121st Avenue Ct E Puyallup, WA | 2.0 | 2.0 | 1034 | $2,400 | $2.32 | 2d | 1 | 0.17mi |
| 12815 123rd St Ct E Puyallup, WA | 1.0 | 1.0 | 720 | $1,599 | $2.22 | 17d | 2 | 0.24mi |
| 12113 122nd St E Puyallup, WA | 1.0 | 1.0 | 700 | $1,350 | $1.93 | 3d | 1 | 0.24mi |
| 12821 123rd Street Ct E Unit 21-8 Puyallup, WA | 1.0 | 1.0 | 720 | $1,525 | $2.12 | 43d | 1 | 0.26mi |
| 12311 112th Avenue Ct E Apt 3 Puyallup, WA | 2.0 | 1.0 | 700 | $1,800 | $2.57 | 23d | 1 | 0.74mi |
| 11020 122nd St E Puyallup, WA | 2.0 | 1.0 | 850 | $1,650 | $1.94 | 43d | 1 | 0.87mi |
| 12006 108th Avenue Ct E Puyallup, WA | 3.0 | 1.0 | 1000 | $2,000 | $2.00 | 2d | 1 | 1.05mi |
| 502 43rd Ave SE Puyallup, WA | 2.0 | 2.0 | 1100 | $2,810 | $2.55 | 3d | 1 | 1.21mi |
| 12724 104th Avenue Ct E Puyallup, WA | 1.0–3.0 | 1.0–2.0 | 910 | $1,995 | $2.19 | 4d | 8 | 1.27mi |
| 12111 104th Ave E Puyallup, WA | 1.0–3.0 | 1.0–2.0 | 902 | $1,610 | $1.78 | 4d | 1 | 1.29mi |
| 13404 106th Ave E Puyallup, WA | 3.0 | 2.0 | 1404 | $2,650 | $1.89 | 24d | 1 | 1.30mi |
| 13523 106th Ave E Puyallup, WA | 3.0 | 2.0 | 1404 | $2,650 | $1.89 | 24d | 1 | 1.37mi |
| 13011 Meridian E Puyallup, WA | 1.0–3.0 | 1.0–2.0 | 942 | $1,912 | $2.03 | 2d | 19 | 1.39mi |
Listing history 25 events
-
2026-06-18days on market $149,250 Active 192 DOM
-
2026-06-17days on market $149,250 Active 191 DOM
-
2026-06-16days on market $149,250 Active 190 DOM
-
2026-06-15days on market $149,250 Active 189 DOM
-
2026-06-13days on market $149,250 Active 187 DOM
-
2026-06-13days on market $149,250 Active 186 DOM
-
2026-06-09days on market $149,250 Active 183 DOM
-
2026-06-08days on market $149,250 Active 182 DOM
-
2026-06-07days on market $149,250 Active 181 DOM
-
2026-06-04days on market $149,250 Active 178 DOM
-
2026-06-03days on market $149,250 Active 177 DOM
-
2026-06-02days on market $149,250 Active 176 DOM
-
2026-06-01days on market $149,250 Active 175 DOM
-
2026-05-31days on market $149,250 Active 174 DOM
-
2026-05-07price $149,250
-
2026-03-14status Active
-
2026-03-07price $152,500
-
2025-12-06$155,250 Active
-
2021-06-28soldstatus $79,500 Closed
-
2021-05-24status Pending
-
2021-05-20$79,500 Active
-
2019-03-22soldstatus $44,000 Sold
-
2019-03-06status Pending
-
2019-02-27status Pending Inspection
-
2019-02-22$44,000 Active
ⓘ Source: listings_history table (triggers on properties + properties_extension) + one-shot
backfill from property_details.listing_events for pre-trigger history.
Climate risk First Street
- Flood 1/10 Low FEMA zone X (unshaded) · 0% chance over 30 yrs
- Wildfire 1/10 Low
- Heat 3/10 Moderate 7 d/yr ≥88°F today · 15 d/yr by 30 yrs out
- Wind 1/10 Low
- Air quality 7/10 Severe 10 unhealthy d/yr today · 10 by 30 yrs out
Nearby sold comps map
Loading sold comps map…
Walkable amenities ~0.75 mi
Loading nearby amenities…
Taxation est. · year 1
- Rental income
- $25,333
- − Mortgage interest
- −$8,360
- − Property taxes
- −$2,239
- − Insurance
- −$746
- − Repairs & maintenance
- −$2,027
- − Management
- −$2,027
- − Depreciation
- −$4,342
- Taxable income
- $5,592
- Est. tax owed @ 24.0%
- −$1,342
- After-tax cash flow
- $6,294/yr
For passive investors: Depreciation is non-cash, so a rental often shows a tax loss while cash-flowing — sheltering income. Rental losses are passive: they offset passive income freely, and up to $25,000/yr can offset ordinary (W-2) income if you actively participate and your MAGI is under $100k (phasing out to $0 by $150k); unused losses carry forward. On sale, claimed depreciation is recaptured at up to 25%, and gains may owe capital-gains tax (a 1031 exchange can defer both). Figures are a year-1 estimate at your 24.0% rate — not tax advice; consult a CPA.
Schools (NCES district)
- District
- Puyallup School District
- NCES district ID
- 5306960
- Math proficiency
- 53% ▬ 0.00%
- Reading proficiency
- 66% ▬ 0.00%
- Median HH income
- $68,291
- Composite
- 54.01/100
- National rank
- #3006
- State rank
- #52 of 291 in WA
Livability — South Hill
- Score
- 80/100
- State rank
- #84
- US rank
- #1620
Category grades
Schools grade is shown separately in the Schools card above.
Census & demographics
- Census place
- South Hill, WA
- County
- Pierce County · 788,257 people
- City population
- 76,707
- Metro
- Seattle-Tacoma-Bellevue, WA
- Population (ZIP)
- 49,007
- Household income
- $112,662
- Rent vs Own
- Severe rent burden
- 1171.0
Population outlook (Pierce County) Hauer SSP2
- Today (2025)
- 956,648 people
- By 2030
- 1,010,862 · +5.7%
- By 2040
- 1,113,170 · +16.4%
- By 2050
- 1,206,524 · +26.1%
- By 2075
- 1,436,425 · +50.2%
- By 2100
- 1,563,654 · +63.5%
Race, ethnicity, and origin ACS 2023
- Neighborhood character
- Diverse neighborhood (Simpson 0.56)
- Race & ethnicity
- White 64% Two or more races 16% Hispanic / Latino 13% Asian 7% Black 4% Native American 1% Pacific Islander 1%
- Hispanic origin (detail)
- Mexican 9% Puerto Rican 2%
- Common ancestry
- Portuguese 6% Italian 3% Slovak 2%
- Foreign-born
- 11% · Canada, South Korea, Vietnam
- Languages at home
- 86% English-only · Spanish 7% Other Asian/Pacific 2% Other Indo-European 2%
Political lean MEDSL · Pierce
- 2024 margin
- D (+10.8) · D 53.9% · R 43.1% · Other 3.0%
- 2008→2024 swing
- -1.4pp toward R · 2008: 12.2pp · 2024: 10.8pp
- All cycles
- 2024: D+10.8 2020: D+11.2 2016: D+7.5 2012: D+11.0 2008: D+12.2
Not yet ingested
- Civics
- —
Market trends
- HPI YoY
- ▼ -431.48%
- Current HPI
- 286.6617
- Rent YoY
- ▲ 1.72%
- Metro
- Seattle-Tacoma-Bellevue, WA
- State GDP YoY
- ▲ 4.65%
- F500 in state
- 22
Industry mix (Fortune 500 HQ in WA)
| Industry | F500 HQs | Revenue |
|---|---|---|
| Retail | 2 | $269B |
|
||
| Technology / Retail | 1 | $638B |
|
||
| Technology | 1 | $245B |
|
||
| Telecommunications | 1 | $38B |
|
||
| Food / Beverage | 1 | $36B |
|
||
| Automotive / Trucks | 1 | $34B |
|
||
Price history
+239.2% since first listed11 events — show timeline
- 2026-05-07 Price Changed $149,250 NWMLS as Distributed by MLS Grid
- 2026-03-14 Relisted — NWMLS as Distributed by MLS Grid
- 2026-03-07 Price Changed $152,500 NWMLS as Distributed by MLS Grid
- 2025-12-06 Listed $155,250 NWMLS as Distributed by MLS Grid
- 2021-06-28 Sold (MLS) $79,500 NWMLS as Distributed by MLS Grid
- 2021-05-24 Pending — NWMLS as Distributed by MLS Grid
- 2021-05-20 Listed $79,500 NWMLS as Distributed by MLS Grid
- 2019-03-22 Sold (MLS) $44,000 NWMLS as Distributed by MLS Grid
- 2019-03-06 Pending — NWMLS as Distributed by MLS Grid
- 2019-02-27 Pending — NWMLS as Distributed by MLS Grid
- 2019-02-22 Listed $44,000 NWMLS as Distributed by MLS Grid
Property tax history
-1.3%/yrLatest (2026): $255 · -79.2% YoY. Source: county tax records.
Cash-flow waterfall
monthlySold comps — $/sqft
last 12 mo · ≤1 miLoading sold comps…