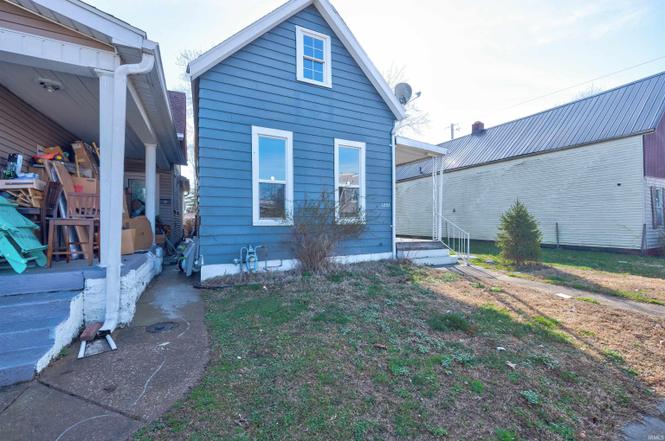
1203 Edgar St · Evansville, IN
Flood risk 1/10 · Minimal
- FEMA flood zone
- X (unshaded)
- Chance of flooding over 30 yrs
- 0.0%
- Est. flood insurance / yr
- $507 – $1,088
Fire risk 1/10 · Minimal
- Est. fire insurance / yr
- $717 – $1,331
Heat risk 5/10 · Moderate
- Hot days now (above 106°F)
- 7 days/yr
- Hot days in 30 yrs
- 19 days/yr
Wind risk 2/10 · Minimal
- Chance of severe wind over 30 yrs
- 4.0%
Air-quality risk 4/10 · Minor
- Unhealthy air days now
- 3 days/yr
- Unhealthy air days in 30 yrs
- 5 days/yr
Risk factors via First Street. Map © Google.
Why this score? — see what drove the C+ grade
The composite is a weighted blend of 9 inputs, each scored 0–100. Each bar is that input's sub-score; the figure is the points it added to the 100-point composite (weight × sub-score).
- Cash flow +28.3/30.0
- DSCR +10.0/10.0
- 1% rule +7.3/10.0
- ARV discount +5.5/15.0
- Schools +3.3/10.0
- Livability +3.2/5.0
- Rent growth +2.5/5.0
- Condition / age +2.5/5.0
- Appreciation +0.0/10.0
$90,000
🖨 Deal sheet 📄 Offer letter ✓ Due diligence
Listing remarks MLS
Looking for move-in ready? Look no further! This 3 bedroom home has all the updates you can ask for! Virtually everything is new. From the front door, step into the spacious living room with lots of natural light that makes for a warm welcoming. 10'+ ceilings throughout the first floor, as well as new LVT flooring. The kitchen features new cabinetry, countertops, and stainless steel appliances. You will appreciate the main level laundry room conveniently located off the kitchen! New windows throughout the majority of the home. The remodeled bath features a tub/shower combo and new vanity. Don't miss out on this beautifully remodeled home!
Key facts
- 10 ceilings
- New carpeting
- Natural light
Tags
Property features AI
Exterior
- Parking: Detached 1-car garage
- Utilities: Public water; Public sewer
- Home design: Single-family residence; Site-built home; Two stories
- Construction: Aluminum siding; Brick/mortar foundation; Built as site-built construction
- Exterior features: Level lot; Lot dimensions approximately 25 x 162
Interior
- Bathrooms: One full bathroom (main level)
- Heating & cooling: Natural gas heating; Central air conditioning
- Interior features: Five total rooms; Main-level laundry
- Laundry & utility: Laundry on the main level
Neighborhood map
What this means for you Summary
Snapshot
- This is a 3-bed/1.0-bath single-family listed at $90k.
Deal economics
- At list price, monthly cash flow is $287 ($3k/yr) — positive.
- The deal already cash-flows at list — no discount required.
- Meets the 1% rule at list price ($1k rent vs $90k).
- Recommended offer: $85k (6.0% below list) — sets the bar for market timing.
- Cap rate 10.1% vs local median 4.6% in Evansville — top-decile yield for the area; either an underpriced asset or a hidden risk that comps aren't pricing in. Stress-test before assuming the spread holds.
Location & tenants
- Location reads 63/100 on livability (#416 in IN) — a middle-class / working-renter tenant base. Strengths: cost of living A+, housing A+, health & safety A+; Watch: crime F, commute F, employment D-.
- Evansville Vanderburgh School Corporation (urban): math 36% / reading 43% proficiency, ranked #153 of 301 in IN (top 51%) — families likely to look elsewhere, expect single-tenant / working-renter base with shorter leases.
- Zoned schools: Delaware Elementary School (math 22% / reading 16%, grade F, #829 of 994 statewide, top 84%, 338 students, 90% FRL); North Junior High School (math 44% / reading 57%, grade C, #43 of 330 statewide, top 14%, 929 students, 42% FRL); North High School (math 57% / reading 74%, grade B, #29 of 369 statewide, top 8%, 1,674 students, 35% FRL).
- Market conditions: 88 active listings in the ZIP; 11 comparable units currently listed for rent nearby; rentals at typical pace (median 21d on market — plan ~3-4 weeks tenant-placement turnaround); 508 units permitted in Vanderburgh County in 2024 (32 in 5+ unit buildings).
Forward outlook
- Local home prices are declining (-3.0%/yr); year-one equity from $622 of loan paydown is wiped out by about $3k of value loss. Plan a longer hold.
- At projected returns (-3.0% appreciation + 3.0% rent growth), your $25k cash investment doubles in ~9 years — after that, you're playing with house money.
Negotiation context
- It's been on market 73 days — a 6% lower offer ($85k) is reasonable based on typical stale-listing flexibility.
- 2 sale attempts since 5y ago; this cycle's ask has dropped $25k (22%) from the opening price — seller is motivated, your offer sets the floor, not the list.
Risks & watch-outs
- Watch-outs: built in 1904 — expect roof / HVAC / electrical / plumbing capex.
- Climate carrying-cost: extreme-heat days projected 7→19/yr by 2055 (HVAC capex compounding) — expect insurance premiums to compound above CPI over the hold.
Questions for the listing agent
- It's been on market 73 days. Have you received any prior offers? Is the seller open to a 6% concession, seller financing, or rate buy-down credit?
- Built in 1904 — when were the roof, HVAC, electrical panel, plumbing, and water heater last replaced?
- Why hasn't it sold? Are there any deal-killer items the seller is aware of (foundation, flood, title, zoning, code violations)?
- Is there a deadline driving the sale (1031 exchange, divorce, estate, relocation)? That informs how much negotiation room exists.
- Schools are D-rated, which usually means shorter tenancies and higher turnover. Who's the typical renter profile here, and what's been the actual vacancy rate?
- Crime grade is F in this area — have there been break-ins, vandalism, or insurance claims at this property in the last 3 years? What carrier currently insures it and at what premium?
- What's the average days-on-market for RENTAL listings here right now (not sales)? A rising rental-DOM trend means longer vacancies and softer asking-rent achievability than the comps imply.
- What's the recent tenant-quality profile in this submarket — average credit score on applications, eviction rate, late-payment / NSF rate, and stable-employment percentage? A property-management company in the area should have these aggregated.
- How much new for-sale + rental construction is in the pipeline within 1–3 miles? Heavy new supply typically softens prices + rents 12–24 months out; constrained supply supports both.
Investment metrics
- 1% rule
- 1.23% ✓
- Cap rate
- 10.12%
- Cash-on-cash
- 13.67%
- DSCR
- 1.61
- GRM
- 6.8
CMA / ARV
- ARV (on-the-fly)
- $86,184
- Comps found
- 12
Show comp detail 12 sales within ~0.75 mi
| Address | Dist | Beds/Ba | Sqft | Sold | Price | $/sf | Match |
|---|---|---|---|---|---|---|---|
| 1203 Edgar St | 0.00mi | 3/1.0 | 1,512 (0%) | 0mo | $86,000 | $57 | 100 |
| 1321 Oakley St | 0.13mi | 3/1.0 | 1,506 (-0%) | 4mo | $14,000 | $9 | 90 |
| 1112 1114 Read St | 0.22mi | 2/2.0 (-1) | 1,456 (-4%) | 2mo | $17,500 | $12 | 73 |
| 1110 W Delaware St | 0.55mi | 3/1.0 | 1,529 (+1%) | 5mo | $20,000 | $13 | 68 |
| 20 W Eichel Ave | 0.43mi | 2/2.0 (-1) | 1,552 (+3%) | 6mo | $134,000 | $86 | 62 |
| 29 E Oregon St | 0.55mi | 3/2.0 | 1,544 (+2%) | 7mo | $40,000 | $26 | 61 |
| 316 W Maryland St | 0.28mi | 3/1.0 | 1,296 (-14%) | 10mo | $60,000 | $46 | 55 |
| 202 W Missouri St | 0.30mi | 3/3.0 | 1,346 (-11%) | 8mo | $135,000 | $100 | 53 |
| 212 E Delaware St | 0.71mi | 3/2.0 | 1,600 (+6%) | 1mo | $213,250 | $133 | 52 |
| 112 W Missouri St | 0.33mi | 3/2.0 | 1,704 (+13%) | 12mo | $30,000 | $18 | 50 |
| 1023 W Franklin St | 0.68mi | 3/1.0 | 1,648 (+9%) | 5mo | $107,000 | $65 | 49 |
| 104 E Tennessee St | 0.57mi | 4/2.0 (+1) | 1,710 (+13%) | 4mo | $145,500 | $85 | 39 |
Match score weights: distance 35% · size 25% · config 20% · recency 20%. Top-matched comps best support the ARV.
Projected returns pro-forma
-3.0% appreciation · 3.0% rent growth · sell at horizon
- IRR
- 3.8%
- Equity multiple
- 1.15×
- Total profit
- $3,701
- Equity at exit
- $13,419
- IRR
- 13.3%
- Equity multiple
- 2.06×
- Total profit
- $26,758
- Equity at exit
- $7,782
Cash invested: $25,200 (down + closing). Projections, not guarantees.
Landlord ↔ Tenant lean methodology
- Overall (STATE)
- 90 Strongly Landlord-Friendly
- State Indiana
- 90 Strongly Landlord-Friendly · R+11
- County
- — inherits STATE
- City
- — inherits STATE
ZIP-level market 47710
- Home prices YoY
- -29.7%
- Active inventory
- 88
- Price-to-rent
- 6.8×
Monthly cashflow live
- Estimated rent
- $1,110 high interval (Pro) →
- Mortgage (P&I)
- −$472
- Tax from tax record
- −$80 /mo · $962/yr
- Insurance
- −$38
- HOA
- −$0
- Vacancy / Maint / Mgmt
- −$233
- Net cashflow
- $287
Break-even live
UW: 25.0% down · 7.5% · 30yr · 1.5% tax · 5.0% vac · 8.0% maint · 8.0% mgmt
Financing live
Cash to close
- Down payment
- $22,500
- Closing costs
- $2,700
- Reserves months
- —
- Total cash needed
- —
Loan-product check · same deal, 3 products live
Conventional
25% down · 7.5% · 30yr
- Down + closing
- —
- Monthly P&I
- —
- Monthly cashflow
- —
- DSCR
- —
- Eligible?
- —
Personal DTI + credit; lowest rate.
DSCR
20% down · 8.5% · 30yr
- Down + closing
- —
- Monthly P&I
- —
- Monthly cashflow
- —
- DSCR
- —
- Eligible?
- —
No personal income docs; deal must DSCR.
Hard money
10% down · 12.0% · 12mo
- Down + closing
- —
- Monthly P&I
- —
- Monthly cashflow
- —
- DSCR
- —
- Eligible?
- —
Short-term bridge; refi at stabilization.
Rent comps 11 comps
| Address | Beds | Baths | Sqft | Rent | $/sqft | DOM | Units | Dist |
|---|---|---|---|---|---|---|---|---|
| 1317 Harriet St Evansville, IN | 3.0 | 2.0 | 2000 | $995 | $0.50 | 13d | 1 | 0.16mi |
| 109 E Eichel Ave Unit B Evansville, IN | 4.0 | 2.0 | 1228 | $1,257 | $1.02 | 21d | 1 | 0.58mi |
| 121 E Florida St Evansville, IN | 4.0 | 2.0 | 1702 | $100 | $0.06 | 21d | 1 | 0.59mi |
| 200 N Main St Evansville, IN | 2.0 | 1.0–2.0 | 857 | $1,599 | $1.86 | 13d | 7 | 0.74mi |
| 1319 Uhlhorn St Evansville, IN | 3.0 | 2.0 | 1424 | $1,350 | $0.95 | 13d | 1 | 0.75mi |
| 41 W Division St Apt 200 Evansville, IN | 2.0 | 2.0 | 1083 | $1,500 | $1.39 | 21d | 1 | 0.85mi |
| 313 NW Martin Luther King Junior Blvd Unit 311 Evansville, IN | 2.0 | 1.0 | 1200 | $950 | $0.79 | 21d | 1 | 0.89mi |
| 706 Court St Evansville, IN | 2.0 | 1.5 | 1100 | $850 | $0.77 | 21d | 1 | 0.90mi |
| 1008 Allens Ln Evansville, IN | 2.0 | 1.0 | 1081 | $750 | $0.69 | 21d | 1 | 1.31mi |
| 2102 W Delaware St Evansville, IN | 3.0 | 1.0 | 1083 | $925 | $0.85 | 13d | 1 | 1.34mi |
| 202 SE 1st St Evansville, IN | 1.0–2.0 | 1.0 | 926 | $2,449 | $2.64 | 21d | 4 | 1.43mi |
Listing history 8 events
-
2026-05-22status Pending
-
2026-05-21price $90,000
-
2026-04-29price $99,500
-
2026-04-09price $104,500
-
2026-03-19price $109,500
-
2026-03-09$115,000 Active
-
2021-04-30soldstatus $79,000 646-char remark
Show marketing remark (646 chars)
Looking for move-in ready? Look no further! This 3 bedroom home has all the updates you can ask for! Virtually everything is new. From the front door, step into the spacious living room with lots of natural light that makes for a warm welcoming. 10'+ ceilings throughout the first floor, as well as new LVT flooring. The kitchen features new cabinetry, countertops, and stainless steel appliances. You will appreciate the main level laundry room conveniently located off the kitchen! New windows throughout the majority of the home. The remodeled bath features a tub/shower combo and new vanity. Don't miss out on this beautifully remodeled home!
-
2021-02-25$84,900 646-char remark
Show marketing remark (646 chars)
Looking for move-in ready? Look no further! This 3 bedroom home has all the updates you can ask for! Virtually everything is new. From the front door, step into the spacious living room with lots of natural light that makes for a warm welcoming. 10'+ ceilings throughout the first floor, as well as new LVT flooring. The kitchen features new cabinetry, countertops, and stainless steel appliances. You will appreciate the main level laundry room conveniently located off the kitchen! New windows throughout the majority of the home. The remodeled bath features a tub/shower combo and new vanity. Don't miss out on this beautifully remodeled home!
ⓘ Source: listings_history table (triggers on properties + properties_extension) + one-shot
backfill from property_details.listing_events for pre-trigger history.
Tax reassessment forecast IN · Partial reset (capped growth)
- Current annual tax
- $962 · $80/mo
- Projected year-2 tax
- $962 · $80/mo
- Expected delta
- $0/yr ($0/mo · 0.0%)
ⓘ Screening estimate from a state-policy table — verify with the county assessor before closing.
Climate risk First Street
- Flood 1/10 Low FEMA zone X (unshaded) · 0% chance over 30 yrs
- Wildfire 1/10 Low
- Heat 5/10 Major 7 d/yr ≥106°F today · 19 d/yr by 30 yrs out
- Wind 2/10 Low 4% chance of damaging wind over 30 yrs
- Air quality 4/10 Moderate 3 unhealthy d/yr today · 5 by 30 yrs out
Nearby sold comps map
Loading sold comps map…
Walkable amenities ~0.75 mi
Loading nearby amenities…
Taxation est. · year 1
- Rental income
- $13,319
- − Mortgage interest
- −$5,041
- − Property taxes
- −$962
- − Insurance
- −$450
- − Repairs & maintenance
- −$1,065
- − Management
- −$1,065
- − Depreciation
- −$2,618
- Taxable income
- $2,116
- Est. tax owed @ 24.0%
- −$508
- After-tax cash flow
- $2,938/yr
For passive investors: Depreciation is non-cash, so a rental often shows a tax loss while cash-flowing — sheltering income. Rental losses are passive: they offset passive income freely, and up to $25,000/yr can offset ordinary (W-2) income if you actively participate and your MAGI is under $100k (phasing out to $0 by $150k); unused losses carry forward. On sale, claimed depreciation is recaptured at up to 25%, and gains may owe capital-gains tax (a 1031 exchange can defer both). Figures are a year-1 estimate at your 24.0% rate — not tax advice; consult a CPA.
Schools (NCES district)
- District
- Evansville Vanderburgh School Corporation
- NCES district ID
- 1803450
- Math proficiency
- 36% ▼ -7.00%
- Reading proficiency
- 43% ▼ -3.00%
- Median HH income
- $43,270
- Composite
- 33.41/100
- National rank
- #5471
- State rank
- #153 of 301 in IN
Livability — Evansville
- Score
- 63/100
- State rank
- #416
- US rank
- #15047
Category grades
Schools grade is shown separately in the Schools card above.
Census & demographics
- Census place
- Evansville, IN
- County
- Vanderburgh County · 146,793 people
- City population
- 146,793
- Metro
- Evansville, IN-KY
- Population (ZIP)
- 18,309
- Household income
- $47,292
- Rent vs Own
- Severe rent burden
- 722.0
Population outlook (Vanderburgh County) Hauer SSP2
- Today (2025)
- 187,038 people
- By 2030
- 188,907 · +1.0%
- By 2040
- 190,272 · +1.7%
- By 2050
- 188,871 · +1.0%
- By 2075
- 180,751 · -3.4%
- By 2100
- 163,015 · -12.8%
Race, ethnicity, and origin ACS 2023
- Neighborhood character
- Predominantly White (83%)
- Race & ethnicity
- White 83% Two or more races 7% Black 6% Hispanic / Latino 4%
- Common ancestry
- Scotch-Irish 2% Lithuanian 1% Slovak 1%
- Foreign-born
- 2% · Canada, China
- Languages at home
- 97% English-only · Spanish 3%
Political lean MEDSL · Vanderburgh
- 2024 margin
- R (+12.7) · D 43.0% · R 55.6% · Other 1.4%
- 2008→2024 swing
- -15.1pp toward R · 2008: 2.5pp · 2024: -12.7pp
- All cycles
- 2024: R+12.7 2020: R+9.6 2016: R+16.9 2012: R+10.8 2008: D+2.5
Not yet ingested
- Civics
- —
Market trends
- HPI YoY
- ▼ -91.84%
- Current HPI
- 217.586
- Rent YoY
- —
- Metro
- Evansville, IN-KY
- State GDP YoY
- ▲ 2.90%
- F500 in state
- 18
Industry mix (Fortune 500 HQ in IN)
| Industry | F500 HQs | Revenue |
|---|---|---|
| Industrial Machinery | 2 | $37B |
|
||
| Healthcare | 1 | $177B |
|
||
| Pharmaceuticals | 1 | $45B |
|
||
| Metals / Steel | 1 | $18B |
|
||
| Agriculture | 1 | $17B |
|
||
| Packaging | 1 | $12B |
|
||
Price history
+6.0% since first listed8 events — show timeline
- 2026-05-22 Pending — IRMLS
- 2026-05-21 Price Changed $90,000 IRMLS
- 2026-04-29 Price Changed $99,500 IRMLS
- 2026-04-09 Price Changed $104,500 IRMLS
- 2026-03-19 Price Changed $109,500 IRMLS
- 2026-03-09 Listed $115,000 IRMLS
- 2021-04-30 Sold (MLS) $79,000 IRMLS
- 2021-02-25 Listed $84,900 IRMLS
Property tax history
-0.3%/yrLatest (2024): $962 · +2.6% YoY. Source: county tax records.
Cash-flow waterfall
monthlySold comps — $/sqft
last 12 mo · ≤1 miLoading sold comps…