 Triplex
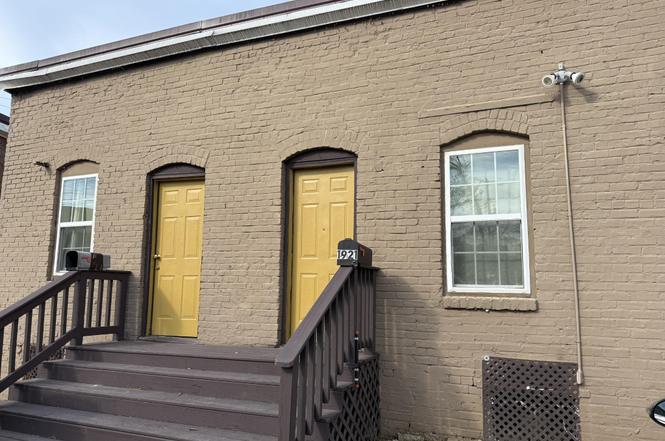
1921 Emerson Dr · Chattanooga, TN
Flood risk 10/10 · Severe
- FEMA flood zone
- X (unshaded)
- Chance of flooding over 30 yrs
- 0.99%
- Est. flood insurance / yr
- $507 – $1,088
Fire risk 2/10 · Minimal
- Est. fire insurance / yr
- $949 – $1,763
Heat risk 7/10 · Major
- Hot days now (above 105°F)
- 7 days/yr
- Hot days in 30 yrs
- 21 days/yr
Wind risk 4/10 · Minor
- Chance of severe wind over 30 yrs
- 10.0%
Air-quality risk 3/10 · Minor
- Unhealthy air days now
- 2 days/yr
- Unhealthy air days in 30 yrs
- 2 days/yr
Risk factors via First Street. Map © Google.
Why this score? — see what drove the D grade
The composite is a weighted blend of 9 inputs, each scored 0–100. Each bar is that input's sub-score; the figure is the points it added to the 100-point composite (weight × sub-score).
- Appreciation +10.0/10.0
- Cash flow +9.6/30.0
- ARV discount +7.5/15.0
- Livability +3.9/5.0
- Rent growth +3.2/5.0
- DSCR +2.7/10.0
- Schools +2.7/10.0
- Condition / age +2.5/5.0
- 1% rule +2.4/10.0
$850,000
🖨 Deal sheet (PDF) 📄 Offer letter ✓ Due diligence
Multi-family units
County records classify this as Multi-Family (2-4 Unit). Listing-text estimate: 3 units. confirmed
Listing remarks
PRIME INVESTMENT OPPORTUNITY in the Heart of the Southside! Value confirmed by recent appraisal. LOCATION, LOCATION, LOCATION! This exceptional multi-family investment property sits in the vibrant Southside district—one of Chattanooga's fastest-growing neighborhoods. The property includes four buildings: three duplexes (each featuring a two-room studio) and one standalone unit offering 3 bedrooms and 1 bathroom. Situated within a federally designated OPPORTUNITY ZONE, this property provides substantial tax advantages for investors. With MIXED-USE COMMERCIAL ZONING, you'll have the flexibility to: Continue operating as a multi-family rental property Reposition for higher-yield reside
Key facts
- Opportunity zone
- 9,147 sq ft lot
- Built 1910
Tags
Neighborhood map
What this means for you Summary
Snapshot
- This is a 3 × 3-bed/2.3-bath units multifamily listed at $850k.
Deal economics
- At list price, monthly cash flow is $-639 ($-8k/yr) — negative. Per door: $-213/mo.
- To cash-flow at today's rent, offer at most $737k (13.3% below list).
- To meet the 1% rule (rent ≥ 1% of price), the offer needs to be $629k (26.0% below list).
- Recommended offer: $629k (26.0% below list) — sets the bar for 1% rule.
Location & tenants
- Location reads 78/100 on livability (#3 in TN, #2,582 nationally) — a middle-class / working-renter tenant base. Strengths: amenities A+, commute A+, cost of living A+; Watch: employment D+, crime F.
- Hamilton County (urban): math 31% / reading 31% proficiency, ranked #42 of 139 in TN (top 30%) — families likely to look elsewhere, expect single-tenant / working-renter base with shorter leases.
- Zoned schools: Battle Academy For Teaching Learning (math 42% / reading 42%, grade F, #191 of 952 statewide, top 22%, 487 students, 0% FRL); Orchard Knob Middle (math 5% / reading 6%, grade F, #291 of 333 statewide, top 88%, 334 students, 0% FRL); The Howard School (math 3% / reading 8%, grade F, #309 of 332 statewide, top 93%, 1,485 students, 0% FRL) — zoned schools average 0% FRL vs 52% district-wide (52 pts lower); this property's tenant base skews higher-income than the district average.
- Zoned-school proficiency averages 18% at this address vs 31% district-wide (-13 pts) — the specific schools serving this property underperform the Hamilton County average; the district grade overstates school quality for this exact location.
- Market conditions: Rents rising (+2.8%/yr); 109 active listings in the ZIP; solid renter incomes; 2,133 units permitted in Hamilton County in 2024 (405 in 5+ unit buildings).
Forward outlook
- In year one you build about $91k of equity ($6k loan paydown + $85k appreciation (10.0% local appreciation)).
- Hamilton County population projected at +23% by 2050 — long-run rental-demand tailwind backs the buy-and-hold thesis.
- By year 2, paydown + projected appreciation supports a ~$146k cash-out refi (75% LTV) — recoverable capital for the next deal without selling this one.
Negotiation context
- It's been on market 140 days — a 12% lower offer ($748k) is reasonable based on typical stale-listing flexibility.
- 2 sale attempts; this cycle's ask is 94344% above the opening price — seller raised mid-cycle; expect resistance to lowballs.
- Current owner paid $150k; list at $850k implies a 467% gain — meaningful room to come down on a strong offer.
Risks & watch-outs
- Watch-outs: flood insurance adds $66/mo; built in 1910 — expect roof / HVAC / electrical / plumbing capex.
- Climate carrying-cost: severe flood risk; extreme-heat days projected 7→21/yr by 2055 (HVAC capex compounding) — expect insurance premiums to compound above CPI over the hold.
Questions for the listing agent
- What do current leases actually rent for vs. the listed asking? Can we see a recent rent roll and the last 12 months of T-12 income?
- It's been on market 140 days. Have you received any prior offers? Is the seller open to a 26% concession, seller financing, or rate buy-down credit?
- Can we see the unit-by-unit rent roll, current vacancy, and any below-market leases? What's the average tenancy length?
- What capital expenditures (roof, boiler, parking lot, exteriors) have been made in the last 5 years, and what's planned in the next 2?
- Built in 1910 — when were the roof, HVAC, electrical panel, plumbing, and water heater last replaced?
- What's the actual annual flood-insurance premium (NFIP or private), and is the property in a SFHA with mandatory coverage?
- Why hasn't it sold? Are there any deal-killer items the seller is aware of (foundation, flood, title, zoning, code violations)?
- Is there a deadline driving the sale (1031 exchange, divorce, estate, relocation)? That informs how much negotiation room exists.
- Schools are F-rated, which usually means shorter tenancies and higher turnover. Who's the typical renter profile here, and what's been the actual vacancy rate?
- Crime grade is F in this area — have there been break-ins, vandalism, or insurance claims at this property in the last 3 years? What carrier currently insures it and at what premium?
- The area grade is low — what's the realistic commute time and amenity access for the typical tenant pool here? Any planned neighborhood developments (good or bad) we should know about?
- What's the average days-on-market for RENTAL listings here right now (not sales)? A rising rental-DOM trend means longer vacancies and softer asking-rent achievability than the comps imply.
- What's the recent tenant-quality profile in this submarket — average credit score on applications, eviction rate, late-payment / NSF rate, and stable-employment percentage? A property-management company in the area should have these aggregated.
- How much new apartment / multifamily construction is in the pipeline within 1–3 miles? Heavy new supply (>2% of stock underway) typically softens rents 12–24 months out; light construction supports rent growth.
Investment metrics
- 1% rule
- 0.74% ✗
- Cap rate
- 5.48%
- Cash-on-cash
- -2.89%
- DSCR
- 0.87
- GRM
- 11.3
CMA / ARV
No comps found within radius.
Projected returns pro-forma
10.0% appreciation · 2.84% rent growth · sell at horizon
- IRR
- 21.9%
- Equity multiple
- 2.77×
- Total profit
- $421,158
- Equity at exit
- $765,747
- IRR
- 19.7%
- Equity multiple
- 6.34×
- Total profit
- $1,270,066
- Equity at exit
- $1,651,363
Cash invested: $238,000 (down + closing). Projections, not guarantees.
Landlord ↔ Tenant lean methodology
- Overall (STATE)
- 87 Strongly Landlord-Friendly
- State Tennessee
- 87 Strongly Landlord-Friendly · R+13
- County
- — inherits STATE
- City
- — inherits STATE
ZIP-level market 37408
- Home prices YoY
- 10.0%
- Rents YoY
- 2.8%
- Active inventory
- 109
- Price-to-rent
- 33.8×
Monthly cashflow live
- Estimated rent
- $6,287 high interval (Pro) →
- Mortgage (P&I)
- −$4,457
- Tax from tax record
- −$728 /mo · $8,730/yr
- Insurance
- −$354
- Flood insurance flood zone
- −$66 /mo · $798/yr
- HOA
- −$0
- Vacancy / Maint / Mgmt
- −$1,320
- Net cashflow
- $-639
Break-even live
Sensitivity live
| Price | -10% $-158 | -5% $-398 | +0% $-639 | +5% $-880 | +10% $-1,120 |
|---|---|---|---|---|---|
| Rent | -10% $-1,136 | -5% $-887 | +0% $-639 | +5% $-391 | +10% $-142 |
| Rate | -1.0pp $-211 | -0.5pp $-423 | base $-639 | +0.5pp $-859 | +1.0pp $-1,083 |
3-unit breakdown (identical units grouped — click to expand)
| Units | Beds | Baths | Est. rent |
|---|---|---|---|
| 3× units | 3 | 2.3 | $6,288 |
| #1 | 3 | 2.3 | $2,096 |
| #2 | 3 | 2.3 | $2,096 |
| #3 | 3 | 2.3 | $2,096 |
| Total (3 units) | $6,287 | ||
UW: 25.0% down · 7.5% · 30yr · 1.5% tax · 5.0% vac · 8.0% maint · 8.0% mgmt
Financing live
Cash to close
- Down payment
- $212,500
- Closing costs
- $25,500
- Reserves months
- —
- Total cash needed
- —
Loan-product check · same deal, 3 products live
Conventional
25% down · 7.5% · 30yr
- Down + closing
- —
- Monthly P&I
- —
- Monthly cashflow
- —
- DSCR
- —
- Eligible?
- —
Personal DTI + credit; lowest rate.
DSCR
20% down · 8.5% · 30yr
- Down + closing
- —
- Monthly P&I
- —
- Monthly cashflow
- —
- DSCR
- —
- Eligible?
- —
No personal income docs; deal must DSCR.
Hard money
10% down · 12.0% · 12mo
- Down + closing
- —
- Monthly P&I
- —
- Monthly cashflow
- —
- DSCR
- —
- Eligible?
- —
Short-term bridge; refi at stabilization.
Listing history 7 events
-
2026-04-25$900
-
2026-03-28status Pending
-
2026-03-16price $850,000
-
2025-11-08$999,000 Active
-
2014-04-02soldstatus $150,000
-
2006-07-27soldstatus $293,270
-
2003-08-05soldstatus $50,000
ⓘ Source: listings_history table (triggers on properties + properties_extension) + one-shot
backfill from property_details.listing_events for pre-trigger history.
Tax reassessment forecast TN · Resets to sale price
- Current annual tax
- $8,730 · $728/mo
- Projected year-2 tax
- $8,730 · $728/mo
- Expected delta
- $0/yr ($0/mo · 0.0%)
ⓘ Screening estimate from a state-policy table — verify with the county assessor before closing.
Climate risk First Street
- Flood 10/10 Extreme FEMA zone X (unshaded) · 99% chance over 30 yrs
- Wildfire 2/10 Low
- Heat 7/10 Severe 7 d/yr ≥105°F today · 21 d/yr by 30 yrs out
- Wind 4/10 Moderate 10% chance of damaging wind over 30 yrs
- Air quality 3/10 Moderate 2 unhealthy d/yr today · 2 by 30 yrs out
Nearby sold comps map
Loading sold comps map…
Walkable amenities ~0.75 mi
Loading nearby amenities…
Taxation est. · year 1
- Rental income
- $75,444
- − Mortgage interest
- −$47,613
- − Property taxes
- −$8,730
- − Insurance
- −$5,048
- − Repairs & maintenance
- −$6,036
- − Management
- −$6,036
- − Depreciation
- −$24,727
- Taxable loss
- −$22,745
- Est. tax savings @ 24.0%
- +$5,459
- After-tax cash flow
- $-2,208/yr
For passive investors: Depreciation is non-cash, so a rental often shows a tax loss while cash-flowing — sheltering income. Rental losses are passive: they offset passive income freely, and up to $25,000/yr can offset ordinary (W-2) income if you actively participate and your MAGI is under $100k (phasing out to $0 by $150k); unused losses carry forward. On sale, claimed depreciation is recaptured at up to 25%, and gains may owe capital-gains tax (a 1031 exchange can defer both). Figures are a year-1 estimate at your 24.0% rate — not tax advice; consult a CPA.
Schools (NCES district)
- District
- Hamilton County
- NCES district ID
- 4701590
- Math proficiency
- 31% ▼ -10.00%
- Reading proficiency
- 31% ▼ -3.00%
- Median HH income
- $47,456
- Composite
- 26.8/100
- National rank
- #7122
- State rank
- #42 of 139 in TN
Livability — Chattanooga
- Score
- 78/100
- State rank
- #3
- US rank
- #2582
Category grades
Schools grade is shown separately in the Schools card above.
Census & demographics
- Census place
- Chattanooga, TN
- County
- Hamilton County · 312,777 people
- City population
- 131,999
- Metro
- Chattanooga, TN-GA
- Population (ZIP)
- 3,502
- Household income
- $81,250
- Rent vs Own
- Severe rent burden
- 220.0
Population outlook (Hamilton County) Hauer SSP2
- Today (2025)
- 393,784 people
- By 2030
- 412,983 · +4.9%
- By 2040
- 449,502 · +14.1%
- By 2050
- 484,341 · +23.0%
- By 2075
- 565,746 · +43.7%
- By 2100
- 618,394 · +57.0%
Race, ethnicity, and origin ACS 2023
- Neighborhood character
- Majority White (63%)
- Race & ethnicity
- White 63% Black 28% Hispanic / Latino 6% Two or more races 5% Asian 2%
- Hispanic origin (detail)
- Mexican 2%
- Common ancestry
- Ukrainian 8% Romanian 4% Slovak 3%
- Foreign-born
- 8% · Canada
- Languages at home
- 91% English-only · Spanish 3% Other Indo-European 1% Other Asian/Pacific 1%
Political lean MEDSL · Hamilton
- 2024 margin
- R (+13.1) · D 42.7% · R 55.7% · Other 1.6%
- 2008→2024 swing
- -1.2pp toward R · 2008: -11.8pp · 2024: -13.1pp
- All cycles
- 2024: R+13.1 2020: R+9.7 2016: R+16.6 2012: R+14.8 2008: R+11.8
Not yet ingested
- Civics
- —
Market trends
- HPI YoY
- ▲ 29.73%
- Current HPI
- 326.5006
- Rent YoY
- ▲ 2.84%
- Metro
- Chattanooga, TN-GA
- State GDP YoY
- ▲ 2.78%
- F500 in state
- 22
Industry mix (Fortune 500 HQ in TN)
| Industry | F500 HQs | Revenue |
|---|---|---|
| Healthcare | 3 | $91B |
|
||
| Retail | 3 | $72B |
|
||
| Transportation / Logistics | 1 | $88B |
|
||
| Paper / Packaging | 1 | $19B |
|
||
| Insurance | 1 | $13B |
|
||
| Energy | 1 | $12B |
|
||
Price history
+1600.0% since first listed7 events — show timeline
- 2026-04-25 Listed for Rent $900 GCAR
- 2026-03-28 Pending — GCAR
- 2026-03-16 Price Changed $850,000 GCAR
- 2025-11-08 Listed $999,000 GCAR
- 2014-04-02 Sold (Public Records) $150,000 Public Records
- 2006-07-27 Sold (Public Records) $293,270 Public Records
- 2003-08-05 Sold (Public Records) $50,000 Public Records
Property tax history
+17.7%/yrLatest (2025): $8,730 · +287.1% YoY. Source: county tax records.
Cash-flow waterfall
monthlySold comps — $/sqft
last 12 mo · ≤1 miLoading sold comps…