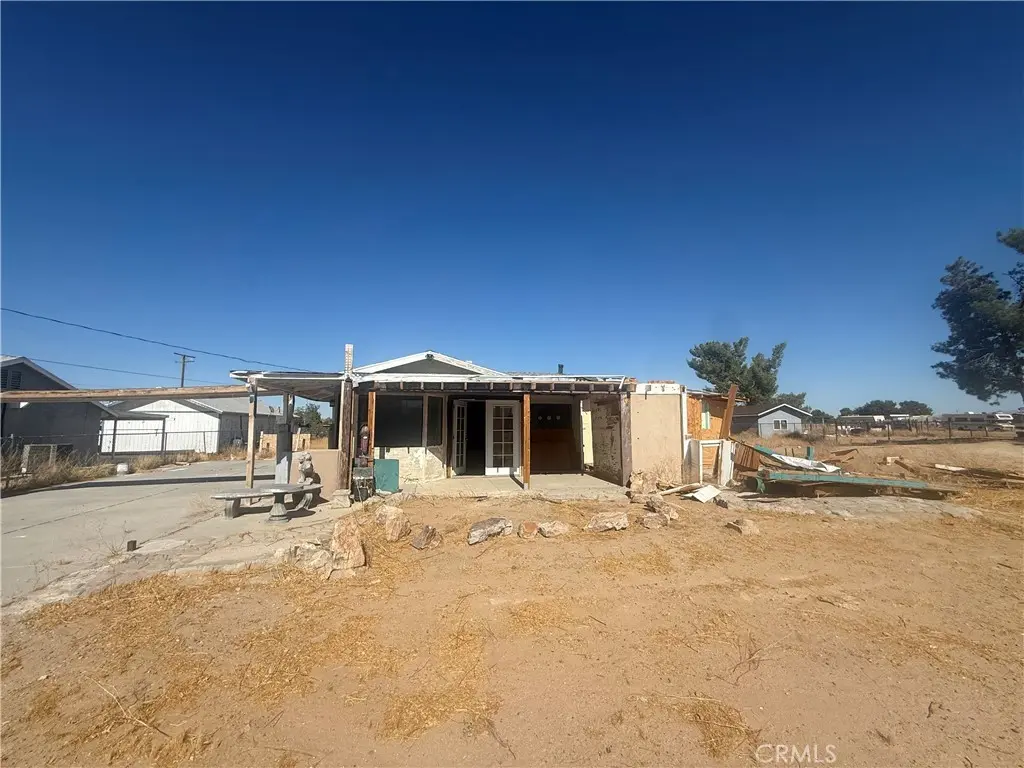
36827 Hillview Rd · Barstow, CA
Flood risk 1/10 · Minimal
- FEMA flood zone
- D
- Chance of flooding over 30 yrs
- 0.0%
- Est. flood insurance / yr
- $544 – $1,084
Fire risk 4/10 · Minor
- Est. fire insurance / yr
- $659 – $1,223
Heat risk 8/10 · Major
- Hot days now (above 103°F)
- 7 days/yr
- Hot days in 30 yrs
- 20 days/yr
Wind risk 1/10 · Minimal
- Chance of severe wind over 30 yrs
- —
Air-quality risk 7/10 · Major
- Unhealthy air days now
- 12 days/yr
- Unhealthy air days in 30 yrs
- 15 days/yr
Risk factors via First Street. Map © Google.
Why this score? — see what drove the A- grade
The composite is a weighted blend of 9 inputs, each scored 0–100. Each bar is that input's sub-score; the figure is the points it added to the 100-point composite (weight × sub-score).
- Cash flow +30.0/30.0
- ARV discount +15.0/15.0
- 1% rule +10.0/10.0
- DSCR +10.0/10.0
- Appreciation +6.4/10.0
- Livability +3.2/5.0
- Rent growth +2.5/5.0
- Condition / age +2.5/5.0
- Schools +1.4/10.0
$79,999
🖨 Deal sheet (PDF) 📄 Offer letter ✓ Due diligence
Listing remarks MLS
Discover the potential of this fixer-upper property in Hinkley, CA, priced to sell and ready for your creative touch! This home offers a fantastic opportunity for investors or DIY enthusiasts looking to transform a space into something special. Enjoy the serene surroundings while being just a short drive from local amenities and major highways. The property requires significant work, making it ideal for those with a vision and the skills to transform it into a charming residence. Bring your creativity and renovation expertise to breathe new life into this hidden gem. Don’t miss out on this opportunity to invest in a property with great potential!
Key facts
- Convenient access
- Blank canvas
- Desert setting
Tags
Property features AI
Finance
- HOA & community: Rural community
Exterior
- Parking: Attached garage with 2 parking spaces (2 garage spaces)
- Utilities: Public (district) water; No sewer or septic listed
- Home design: Single-story house; No ADU; Has a view
- Construction: Structure type: House; Year built source: Assessor
- Exterior features: House with rural setting; No pool
Interior
- Kitchen: No appliances included
- Bedrooms: 1 bedroom on the main level
- Bathrooms: 1 full bathroom
- Interior features: Laminate counters; One-level living; All bedrooms on the main floor; Main floor has 1 bedroom and 1 full bathroom
- Laundry & utility: No laundry hookups listed
Neighborhood map
What this means for you Summary
Snapshot
- This is a 3-bed/1.0-bath single-family listed at $80k.
Deal economics
- At list price, monthly cash flow is $618 ($7k/yr) — positive.
- The deal already cash-flows at list — no discount required.
- Meets the 1% rule at list price ($1k rent vs $80k).
- Cap rate 15.6% vs local median 4.6% in Barstow — top-decile yield for the area; either an underpriced asset or a hidden risk that comps aren't pricing in. Stress-test before assuming the spread holds.
Location & tenants
- Location reads 63/100 on livability (#444 in CA) — a middle-class / working-renter tenant base. Strengths: commute A+, housing A+; Watch: amenities C-, health & safety C-, schools F.
- Barstow Unified (town): math 11% / reading 22% proficiency, ranked #482 of 517 in CA (top 93%) — low school quality limits family demand, transient renter base, plan for 1-2y turnover; 68% free/reduced lunch — lower-income household profile, screen leases tightly.
- Market conditions: 100 active listings in the ZIP; 5,458 units permitted in San Bernardino County in 2024 (1,500 in 5+ unit buildings).
Forward outlook
- In year one you build about $3k of equity ($553 loan paydown + $2k appreciation (2.9% local appreciation)).
- San Bernardino County population projected at +15% by 2050 — modest demand growth; plan on rents tracking national, not racing it.
- At projected returns (2.9% appreciation + 3.0% rent growth), your $22k cash investment doubles in ~3 years — after that, you're playing with house money.
Negotiation context
- Only 8 days on market — expect competitive offers; lowballing is unlikely to land.
- 5 sale attempts since 6y ago with the ask held roughly flat each time — persistent listings suggest the price (not the market) is what's stuck; bring a comps-based counter.
Risks & watch-outs
- Watch-outs: built in 1952 — expect roof / HVAC / electrical / plumbing capex.
- Climate carrying-cost: extreme-heat days projected 7→20/yr by 2055 (HVAC capex compounding) — expect insurance premiums to compound above CPI over the hold.
Questions for the listing agent
- Built in 1952 — when were the roof, HVAC, electrical panel, plumbing, and water heater last replaced?
- Is there a deadline driving the sale (1031 exchange, divorce, estate, relocation)? That informs how much negotiation room exists.
- Schools are F-rated, which usually means shorter tenancies and higher turnover. Who's the typical renter profile here, and what's been the actual vacancy rate?
- Crime grade is F in this area — have there been break-ins, vandalism, or insurance claims at this property in the last 3 years? What carrier currently insures it and at what premium?
- What's the average days-on-market for RENTAL listings here right now (not sales)? A rising rental-DOM trend means longer vacancies and softer asking-rent achievability than the comps imply.
- What's the recent tenant-quality profile in this submarket — average credit score on applications, eviction rate, late-payment / NSF rate, and stable-employment percentage? A property-management company in the area should have these aggregated.
- How much new for-sale + rental construction is in the pipeline within 1–3 miles? Heavy new supply typically softens prices + rents 12–24 months out; constrained supply supports both.
Investment metrics
- 1% rule
- 1.85% ✓
- Cap rate
- 15.56%
- Cash-on-cash
- 33.11%
- DSCR
- 2.47
- GRM
- 4.5
CMA / ARV
- ARV (on-the-fly)
- $109,654
- Comps found
- 2
Show comp detail 2 sales within ~0.75 mi
| Address | Dist | Beds/Ba | Sqft | Sold | Price | $/sf | Match |
|---|---|---|---|---|---|---|---|
| 36827 Hillview Rd | 0.00mi | 3/1.0 | 1,006 (0%) | 19mo | $79,000 | $79 | 84 |
| 36721 Hillview Rd | 0.13mi | 3/2.0 | 1,104 (+10%) | 22mo | $120,000 | $109 | 55 |
Match score weights: distance 35% · size 25% · config 20% · recency 20%. Top-matched comps best support the ARV.
Projected returns pro-forma
2.88% appreciation · 3.0% rent growth · sell at horizon
- IRR
- 38.6%
- Equity multiple
- 3.17×
- Total profit
- $48,497
- Equity at exit
- $35,415
- IRR
- 38.8%
- Equity multiple
- 6.28×
- Total profit
- $118,175
- Equity at exit
- $54,150
Cash invested: $22,400 (down + closing). Projections, not guarantees.
Landlord ↔ Tenant lean methodology
- Overall (STATE)
- 18 Strongly Tenant-Friendly
- State California
- 18 Strongly Tenant-Friendly · D+13
- County
- — inherits STATE
- City
- — inherits STATE
ZIP-level market 92347
- Home prices YoY
- 2.4%
- Active inventory
- 100
- Price-to-rent
- 4.5×
Monthly cashflow live
- Estimated rent
- $1,479 medium interval (Pro) →
- Mortgage (P&I)
- −$420
- Tax from tax record
- −$98 /mo · $1,174/yr
- Insurance
- −$33
- HOA
- −$0
- Vacancy / Maint / Mgmt
- −$311
- Net cashflow
- $618
Break-even live
Sensitivity live
| Price | -10% $663 | -5% $641 | +0% $618 | +5% $595 | +10% $573 |
|---|---|---|---|---|---|
| Rent | -10% $501 | -5% $560 | +0% $618 | +5% $676 | +10% $735 |
| Rate | -1.0pp $658 | -0.5pp $638 | base $618 | +0.5pp $597 | +1.0pp $576 |
UW: 25.0% down · 7.5% · 30yr · 1.5% tax · 5.0% vac · 8.0% maint · 8.0% mgmt
Financing live
Cash to close
- Down payment
- $20,000
- Closing costs
- $2,400
- Reserves months
- —
- Total cash needed
- —
Loan-product check · same deal, 3 products live
Conventional
25% down · 7.5% · 30yr
- Down + closing
- —
- Monthly P&I
- —
- Monthly cashflow
- —
- DSCR
- —
- Eligible?
- —
Personal DTI + credit; lowest rate.
DSCR
20% down · 8.5% · 30yr
- Down + closing
- —
- Monthly P&I
- —
- Monthly cashflow
- —
- DSCR
- —
- Eligible?
- —
No personal income docs; deal must DSCR.
Hard money
10% down · 12.0% · 12mo
- Down + closing
- —
- Monthly P&I
- —
- Monthly cashflow
- —
- DSCR
- —
- Eligible?
- —
Short-term bridge; refi at stabilization.
Listing history 7 events
-
2026-06-18days on market $79,999 Active 8 DOM
-
2026-06-17days on market $79,999 Active 7 DOM
-
2026-06-16days on market $79,999 Active 6 DOM
-
2026-06-15days on market $79,999 Active 5 DOM
-
2026-06-13days on market $79,999 Active 3 DOM
-
2026-06-13remarks 573-char remark
-
2026-06-13$79,999 Active 2 DOM
ⓘ Source: listings_history table (triggers on properties + properties_extension) + one-shot
backfill from property_details.listing_events for pre-trigger history.
Tax reassessment forecast CA · Resets to sale price
- Current annual tax
- $1,174 · $98/mo
- Projected year-2 tax
- $1,174 · $98/mo
- Expected delta
- $0/yr ($0/mo · 0.0%)
ⓘ Screening estimate from a state-policy table — verify with the county assessor before closing.
Climate risk First Street
- Flood 1/10 Low FEMA zone D · 0% chance over 30 yrs
- Wildfire 4/10 Moderate
- Heat 8/10 Severe 7 d/yr ≥103°F today · 20 d/yr by 30 yrs out
- Wind 1/10 Low
- Air quality 7/10 Severe 12 unhealthy d/yr today · 15 by 30 yrs out
Nearby sold comps map
Loading sold comps map…
Walkable amenities ~0.75 mi
Loading nearby amenities…
Taxation est. · year 1
- Rental income
- $17,752
- − Mortgage interest
- −$4,481
- − Property taxes
- −$1,174
- − Insurance
- −$400
- − Repairs & maintenance
- −$1,420
- − Management
- −$1,420
- − Depreciation
- −$2,327
- Taxable income
- $6,530
- Est. tax owed @ 24.0%
- −$1,567
- After-tax cash flow
- $5,849/yr
For passive investors: Depreciation is non-cash, so a rental often shows a tax loss while cash-flowing — sheltering income. Rental losses are passive: they offset passive income freely, and up to $25,000/yr can offset ordinary (W-2) income if you actively participate and your MAGI is under $100k (phasing out to $0 by $150k); unused losses carry forward. On sale, claimed depreciation is recaptured at up to 25%, and gains may owe capital-gains tax (a 1031 exchange can defer both). Figures are a year-1 estimate at your 24.0% rate — not tax advice; consult a CPA.
Schools (NCES district)
- District
- Barstow Unified
- NCES district ID
- 0604020
- Math proficiency
- 11% ▼ -7.00%
- Reading proficiency
- 22% ▼ -7.00%
- Median HH income
- $44,505
- Composite
- 14.44/100
- National rank
- #9430
- State rank
- #482 of 517 in CA
Livability — Barstow
- Score
- 63/100
- State rank
- #444
- US rank
- #15099
Category grades
Schools grade is shown separately in the Schools card above.
Census & demographics
- City population
- 33,954
- Population (ZIP)
- 630
Population outlook (San Bernardino County) Hauer SSP2
- Today (2025)
- 2,300,329 people
- By 2030
- 2,378,907 · +3.4%
- By 2040
- 2,523,137 · +9.7%
- By 2050
- 2,642,388 · +14.9%
- By 2075
- 2,880,769 · +25.2%
- By 2100
- 2,909,436 · +26.5%
Race, ethnicity, and origin ACS 2023
- Neighborhood character
- Predominantly White (84%)
- Race & ethnicity
- White 84% Two or more races 14% Hispanic / Latino 10% Black 1%
- Hispanic origin (detail)
- Mexican 10%
- Common ancestry
- Romanian 3% Italian 1%
- Foreign-born
- 10% · Canada
- Languages at home
- 90% English-only · Spanish 10%
Political lean MEDSL · San Bernardino
- 2024 margin
- Toss-up / Even · D 47.5% · R 49.7% · Other 2.8%
- 2008→2024 swing
- -8.5pp toward R · 2008: 6.3pp · 2024: -2.1pp
- All cycles
- 2024: R+2.1 2020: D+10.7 2016: D+9.8 2012: D+5.4 2008: D+6.3
Not yet ingested
- Civics
- —
Market trends
- HPI YoY
- ▲ 2.88%
- Current HPI
- 121.7739
- Rent YoY
- —
- Metro
- —
- State GDP YoY
- ▲ 3.21%
- F500 in state
- 116
Industry mix (Fortune 500 HQ in CA)
| Industry | F500 HQs | Revenue |
|---|---|---|
| Technology | 27 | $1,492B |
|
||
| Financial Services | 3 | $174B |
|
||
| Retail | 3 | $44B |
|
||
| Insurance | 3 | $26B |
|
||
| Media / Entertainment | 2 | $115B |
|
||
| Pharmaceuticals / Biotech | 2 | $62B |
|
||
Price history
+90.5% since first listed16 events — show timeline
- 2026-06-10 Listed $79,999 CRMLS
- 2024-11-13 Sold (Public Records) $79,000 Public Records
- 2024-11-13 Sold (MLS) $79,000 CRMLS
- 2024-10-28 Pending — CRMLS
- 2024-10-24 Listed $79,000 CRMLS
- 2023-02-09 Listing Removed — CRMLS
- 2022-12-14 Price Changed $135,000 CRMLS
- 2022-08-27 Price Changed $150,000 CRMLS
- 2022-08-17 Price Changed $170,000 CRMLS
- 2022-08-09 Listed $220,000 CRMLS
- 2020-12-23 Sold (Public Records) $120,000 Public Records
- 2020-12-22 Sold (MLS) $120,000 bridgeMLS, Bay East AOR, or Contra Costa AOR
- 2020-12-22 Sold (MLS) $120,000 CRMLS
- 2020-05-21 Listed $115,000 bridgeMLS, Bay East AOR, or Contra Costa AOR
- 2020-05-21 Listed $115,000 CRMLS
- 1987-01-15 Sold (Public Records) $42,000 Public Records
Property tax history
+2.2%/yrLatest (2025): $1,174 · -31.9% YoY. Source: county tax records.
Cash-flow waterfall
monthlySold comps — $/sqft
last 12 mo · ≤1 miLoading sold comps…