 🏗️ New Construction
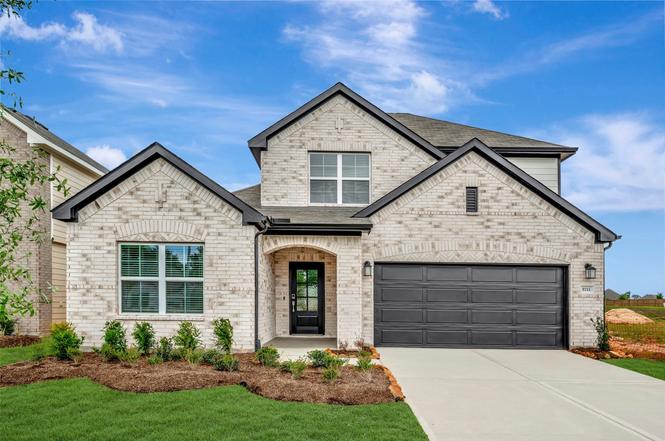
5711 Sunland Trl · Fulshear, TX
Flood risk No data
- FEMA flood zone
- —
- Chance of flooding over 30 yrs
- —
- Est. flood insurance / yr
- —
Fire risk No data
- Est. fire insurance / yr
- —
Heat risk No data
- Hot days now (above threshold)
- —
- Hot days in 30 yrs
- —
Wind risk No data
- Chance of severe wind over 30 yrs
- —
Air-quality risk No data
- Unhealthy air days now
- —
- Unhealthy air days in 30 yrs
- —
Risk factors via First Street. Map © Google.
Why this score? — see what drove the D+ grade
The composite is a weighted blend of 9 inputs, each scored 0–100. Each bar is that input's sub-score; the figure is the points it added to the 100-point composite (weight × sub-score).
- Cash flow +15.8/30.0
- ARV discount +7.5/15.0
- DSCR +4.9/10.0
- 1% rule +4.6/10.0
- Schools +4.6/10.0
- Condition / age +4.0/5.0
- Livability +3.5/5.0
- Rent growth +2.1/5.0
- Appreciation +0.0/10.0
$391,990
🖨 Deal sheet (PDF) 📄 Offer letter ✓ Due diligence
Listing remarks
READY NOW! The luxury vinyl plank flooring throughout the home is perfect for entertaining or relaxing with your loved ones. The high ceilings and large family room make for a great entertainment space. The owner's suite is the perfect place to unwind and relax. A bay window and sloped ceilings allow plenty of natural light into the room. The en-suite bathroom has a spa-like feel with a walk-in shower, a soaking tub, and a walk-in closet! You'll also have a private office to work or study in. The first-floor guest suite is ideal for visiting family and friends. Upstairs you have the game room, a bathroom and 2 bedrooms. The backyard is partially fenced, providing plenty of room to play and
Key facts
- Large family room
- Natural light
- Bay window
Tags
Neighborhood map
What this means for you Summary
Snapshot
- This is a 4-bed/3.0-bath single-family listed at $392k. Condition is rated good.
Deal economics
- At list price, monthly cash flow is $165 ($2k/yr) — positive.
- To cash-flow at today's rent, offer at most $379k (3.2% below list).
- To meet the 1% rule (rent ≥ 1% of price), the offer needs to be $340k (13.4% below list).
- Recommended offer: $340k (13.4% below list) — sets the bar for 1% rule.
- Cap rate 6.8% vs local median 3.2% in Fulshear — top-decile yield for the area; either an underpriced asset or a hidden risk that comps aren't pricing in. Stress-test before assuming the spread holds.
Location & tenants
- Location reads 69/100 on livability (#430 in TX) — a middle-class / working-renter tenant base. Strengths: crime A+, employment A+, housing A+; Watch: amenities F, commute F, cost of living F.
- Lamar CISD (suburban): math 50% / reading 53% proficiency, ranked #116 of 826 in TX (top 14%) — acceptable for families but not a draw, mixed tenant base, ~2y average lease.
- Zoned schools: Huggins El (math 61% / reading 63%, grade B, #321 of 4,322 statewide, top 8%, 893 students, 23% FRL); Dean Leaman J H School (math 59% / reading 56%, grade B, #206 of 1,662 statewide, top 13%, 2,191 students, 32% FRL); Fulshear H S (math 52% / reading 70%, grade C+, #258 of 1,632 statewide, top 16%, 2,464 students, 30% FRL).
- Market conditions: Rents soft (-1.6%/yr); 1242 active listings in the ZIP; 6 comparable units currently listed for rent nearby; rentals at typical pace (median 14d on market — plan ~3-4 weeks tenant-placement turnaround); high-income renter base; 12,093 units permitted in Fort Bend County in 2024 (815 in 5+ unit buildings).
Forward outlook
- Local home prices are declining (-3.0%/yr); year-one equity from $2k of loan paydown is wiped out by about $11k of value loss. Plan a longer hold.
- Fort Bend County population projected at +75% by 2050 — long-run rental-demand tailwind backs the buy-and-hold thesis.
Negotiation context
- It's been on market 70 days — a 6% lower offer ($368k) is reasonable based on typical stale-listing flexibility.
Questions for the listing agent
- It's been on market 70 days. Have you received any prior offers? Is the seller open to a 13% concession, seller financing, or rate buy-down credit?
- What does the HOA fee cover, when was the last increase, and are there any pending special assessments or reserve-fund shortfalls?
- Why hasn't it sold? Are there any deal-killer items the seller is aware of (foundation, flood, title, zoning, code violations)?
- Is there a deadline driving the sale (1031 exchange, divorce, estate, relocation)? That informs how much negotiation room exists.
- Schools are A-rated — typically a magnet for longer-tenancy family renters. What's the average tenant stay here, and is there a school-zone premium baked into asking?
- The area grade is low — what's the realistic commute time and amenity access for the typical tenant pool here? Any planned neighborhood developments (good or bad) we should know about?
- What's the average days-on-market for RENTAL listings here right now (not sales)? A rising rental-DOM trend means longer vacancies and softer asking-rent achievability than the comps imply.
- What's the recent tenant-quality profile in this submarket — average credit score on applications, eviction rate, late-payment / NSF rate, and stable-employment percentage? A property-management company in the area should have these aggregated.
- How much new for-sale + rental construction is in the pipeline within 1–3 miles? Heavy new supply typically softens prices + rents 12–24 months out; constrained supply supports both.
Investment metrics
- 1% rule
- 0.96% ✗
- Cap rate
- 6.85%
- Cash-on-cash
- 1.98%
- DSCR
- 1.09
- GRM
- 8.7
CMA / ARV
- ARV (on-the-fly)
- $355,496
- Comps found
- 12
Show comp detail 12 sales within ~0.75 mi
| Address | Dist | Beds/Ba | Sqft | Sold | Price | $/sf | Match |
|---|---|---|---|---|---|---|---|
| 5711 Sunland Trl | 0.00mi | 4/3.0 | 2,402 (0%) | 1mo | $391,990 | $163 | 99 |
| 32215 Sunbeam Dr | 0.06mi | 4/3.0 | 2,417 (+1%) | 1mo | $364,990 | $151 | 95 |
| 32107 Morning Luster Ct | 0.19mi | 4/3.0 | 2,402 (0%) | 1mo | $369,990 | $154 | 91 |
| 5727 Daylight Cv | 0.23mi | 4/3.0 | 2,412 (+0%) | 3mo | $310,000 | $129 | 86 |
| 32407 Sunbeam Dr | 0.22mi | 4/3.0 | 2,353 (-2%) | 2mo | $352,990 | $150 | 85 |
| 32503 Midsummer Dr | 0.23mi | 4/2.5 | 2,342 (-2%) | 1mo | $324,990 | $139 | 82 |
| 32511 Midsummer Dr | 0.23mi | 4/2.5 | 2,342 (-2%) | 1mo | $350,990 | $150 | 82 |
| 32447 Sunbeam Dr | 0.29mi | 4/2.5 | 2,342 (-2%) | 2mo | $326,990 | $140 | 79 |
| 32455 Sunbeam Dr | 0.30mi | 4/2.5 | 2,342 (-2%) | 2mo | $329,990 | $141 | 78 |
| 32127 Morning Luster Ct | 0.17mi | 5/3.0 (+1) | 2,677 (+11%) | 1mo | $389,990 | $146 | 67 |
| 32223 Sunbeam Dr | 0.08mi | 5/4.0 (+1) | 2,697 (+12%) | 0mo | $379,990 | $141 | 66 |
| 32919 Turning Springs Dr | 0.67mi | 4/2.5 | 2,260 (-6%) | 4mo | $334,900 | $148 | 54 |
Match score weights: distance 35% · size 25% · config 20% · recency 20%. Top-matched comps best support the ARV.
Projected returns pro-forma
-3.0% appreciation · 0.0% rent growth · sell at horizon
- IRR
- -16.6%
- Equity multiple
- 0.43×
- Total profit
- $-56,983
- Equity at exit
- $53,006
- IRR
- -15.3%
- Equity multiple
- 0.25×
- Total profit
- $-74,214
- Equity at exit
- $30,737
Cash invested: $99,539 (down + closing). Projections, not guarantees.
Landlord ↔ Tenant lean methodology
- Overall (STATE)
- 87 Strongly Landlord-Friendly
- State Texas
- 87 Strongly Landlord-Friendly · R+5
- County
- — inherits STATE
- City
- — inherits STATE
ZIP-level market 77441
- Rents YoY
- -1.6%
- Active inventory
- 1242
- Price-to-rent
- 9.6×
Monthly cashflow live
- Estimated rent
- $3,395 high interval (Pro) →
- Mortgage (P&I)
- −$1,864
- Tax est. 1.5%
- −$444 /mo · $5,332/yr
- Insurance
- −$148
- HOA
- −$61
- Vacancy / Maint / Mgmt
- −$713
- Net cashflow
- $165
Break-even live
Sensitivity live
| Price | -10% $410 | -5% $287 | +0% $165 | +5% $42 | +10% $-81 |
|---|---|---|---|---|---|
| Rent | -10% $-104 | -5% $30 | +0% $165 | +5% $299 | +10% $433 |
| Rate | -1.0pp $344 | -0.5pp $255 | base $165 | +0.5pp $72 | +1.0pp $-21 |
UW: 25.0% down · 7.5% · 30yr · 1.5% tax · 5.0% vac · 8.0% maint · 8.0% mgmt
Financing live
Cash to close
- Down payment
- $88,874
- Closing costs
- $10,665
- Reserves months
- —
- Total cash needed
- —
Loan-product check · same deal, 3 products live
Conventional
25% down · 7.5% · 30yr
- Down + closing
- —
- Monthly P&I
- —
- Monthly cashflow
- —
- DSCR
- —
- Eligible?
- —
Personal DTI + credit; lowest rate.
DSCR
20% down · 8.5% · 30yr
- Down + closing
- —
- Monthly P&I
- —
- Monthly cashflow
- —
- DSCR
- —
- Eligible?
- —
No personal income docs; deal must DSCR.
Hard money
10% down · 12.0% · 12mo
- Down + closing
- —
- Monthly P&I
- —
- Monthly cashflow
- —
- DSCR
- —
- Eligible?
- —
Short-term bridge; refi at stabilization.
Rent comps 6 comps
| Address | Beds | Baths | Sqft | Rent | $/sqft | DOM | Units | Dist |
|---|---|---|---|---|---|---|---|---|
| 5462 Grand View Dr Unit 1568482P Pattison, TX | 5.0 | 3.5 | 2992 | $3,732 | $1.25 | 0d | 1 | 0.35mi |
| 5222 Wyatt James Ln Brookshire, TX | 4.0 | 2.5 | 2487 | $3,250 | $1.31 | 13d | 1 | 0.79mi |
| 33002 Franklin Brooks Dr Pattison, TX | 4.0 | 3.5 | 3255 | $4,385 | $1.35 | 0d | 1 | 0.84mi |
| 7302 New Pecan Dr Fulshear, TX | 4.0 | 4.0 | 2844 | $3,299 | $1.16 | 45d | 1 | 0.97mi |
| 31043 Vintage Creek Ln Fulshear, TX | 4.0 | 3.5 | 2800 | $3,300 | $1.18 | 23d | 1 | 1.15mi |
| 31123 Brightwell Bnd Fulshear, TX | 4.0 | 3.0 | 2400 | $2,400 | $1.00 | 14d | 1 | 1.30mi |
HOA detail
- Monthly dues
- $61 · $732/yr
Listing history 5 events
-
2026-04-27status Pending
-
2026-04-20price $391,990
-
2026-03-16price $399,990
-
2026-03-02price $407,990
-
2026-02-16$399,990 Active
ⓘ Source: listings_history table (triggers on properties + properties_extension) + one-shot
backfill from property_details.listing_events for pre-trigger history.
Nearby sold comps map
Loading sold comps map…
Walkable amenities ~0.75 mi
Loading nearby amenities…
Taxation est. · year 1
- Rental income
- $40,745
- − Mortgage interest
- −$19,913
- − Property taxes
- −$5,332
- − Insurance
- −$1,777
- − Repairs & maintenance
- −$3,260
- − Management
- −$3,260
- − HOA
- −$732
- − Depreciation
- −$10,342
- Taxable loss
- −$3,871
- Est. tax savings @ 24.0%
- +$929
- After-tax cash flow
- $2,904/yr
For passive investors: Depreciation is non-cash, so a rental often shows a tax loss while cash-flowing — sheltering income. Rental losses are passive: they offset passive income freely, and up to $25,000/yr can offset ordinary (W-2) income if you actively participate and your MAGI is under $100k (phasing out to $0 by $150k); unused losses carry forward. On sale, claimed depreciation is recaptured at up to 25%, and gains may owe capital-gains tax (a 1031 exchange can defer both). Figures are a year-1 estimate at your 24.0% rate — not tax advice; consult a CPA.
Condition & rehab AI · 3 photos
The home is in good condition with a good exterior and interior. It has a good curb appeal and is ready for minor cosmetic upgrades to enhance its value.
Value-add opportunities
- Both Painting the exterior and interior walls — Painting can enhance the curb appeal and interior aesthetics, making the home more attractive to potential buyers and renters.
- Both Landscaping improvements — Enhancing the landscaping can improve the curb appeal and make the home more attractive to potential buyers and renters.
- Both Upgrading the kitchen and bathrooms — Upgrading the kitchen and bathrooms can significantly increase the home's value, as these are key selling points for both buyers and renters.
Renovation cost estimate screening
Value-add ROI direction
- Both Painting the exterior and interior walls — Painting can enhance the curb appeal and interior aesthetics, making the home more attractive to potential buyers and renters. ↑
- Both Landscaping improvements — Enhancing the landscaping can improve the curb appeal and make the home more attractive to potential buyers and renters. ↑
- Both Upgrading the kitchen and bathrooms — Upgrading the kitchen and bathrooms can significantly increase the home's value, as these are key selling points for both buyers and renters. ↑
ⓘ Cost ranges are severity-bucket heuristics (US national rule-of-thumb). Get contractor quotes + a written scope before underwriting a rehab budget.
Schools (NCES district)
- District
- Lamar CISD
- NCES district ID
- 4826580
- Math proficiency
- 50% ▼ -12.00%
- Reading proficiency
- 53% ▼ -4.00%
- Median HH income
- $75,213
- Composite
- 46.43/100
- National rank
- #2452
- State rank
- #116 of 826 in TX
Livability — Fulshear
- Score
- 69/100
- State rank
- #430
- US rank
- #8901
Category grades
Schools grade is shown separately in the Schools card above.
Census & demographics
- County
- Fort Bend County · 836,777 people
- City population
- 41,324
- Metro
- Houston-The Woodlands-Sugar Land, TX
- Population (ZIP)
- 41,324
- Household income
- $184,390
- Rent vs Own
- Severe rent burden
- 301.0
Population outlook (Fort Bend County) Hauer SSP2
- Today (2025)
- 1,004,526 people
- By 2030
- 1,153,104 · +14.8%
- By 2040
- 1,453,718 · +44.7%
- By 2050
- 1,753,781 · +74.6%
- By 2075
- 2,455,772 · +144.5%
- By 2100
- 2,930,528 · +191.7%
Race, ethnicity, and origin ACS 2023
- Neighborhood character
- Diverse neighborhood (Simpson 0.62)
- Race & ethnicity
- White 57% Hispanic / Latino 20% Two or more races 15% Asian 12% Black 6%
- Hispanic origin (detail)
- Mexican 10%
- Common ancestry
- Lithuanian 5% Romanian 2% Italian 1%
- Foreign-born
- 26% · Canada, China, Jamaica
- Languages at home
- 68% English-only · Spanish 17% German/W. Germanic 4% Chinese 4%
Political lean MEDSL · Fort Bend
- 2024 margin
- Toss-up / Even · D 49.5% · R 47.9% · Other 2.6%
- 2008→2024 swing
- +4.0pp toward D · 2008: -2.4pp · 2024: 1.6pp
- All cycles
- 2024: D+1.6 2020: D+10.6 2016: D+6.6 2012: R+6.8 2008: R+2.4
Not yet ingested
- Civics
- —
Market trends
- HPI YoY
- ▼ -154.74%
- Current HPI
- 275.8798
- Rent YoY
- ▼ -1.63%
- Metro
- Houston-The Woodlands-Sugar Land, TX
- State GDP YoY
- ▲ 3.95%
- F500 in state
- 110
Industry mix (Fortune 500 HQ in TX)
| Industry | F500 HQs | Revenue |
|---|---|---|
| Energy | 16 | $1,198B |
|
||
| Technology | 5 | $198B |
|
||
| Engineering / Construction | 4 | $72B |
|
||
| Energy Services | 3 | $60B |
|
||
| Utilities | 3 | $41B |
|
||
| Healthcare | 2 | $330B |
|
||
Price history
-2.0% since first listed5 events — show timeline
- 2026-04-27 Pending — HARMLS
- 2026-04-20 Price Changed $391,990 HARMLS
- 2026-03-16 Price Changed $399,990 HARMLS
- 2026-03-02 Price Changed $407,990 HARMLS
- 2026-02-16 Listed $399,990 HARMLS
Cash-flow waterfall
monthlySold comps — $/sqft
last 12 mo · ≤1 miLoading sold comps…