 Duplex
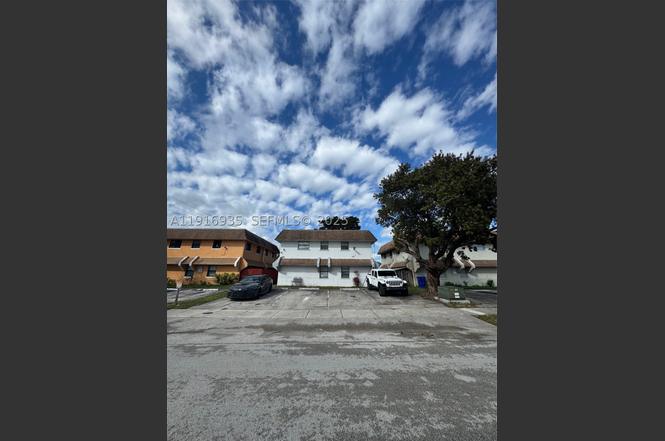
1741 SW 40th Ter · Broadview Park, FL
Flood risk 1/10 · Minimal
- FEMA flood zone
- X (unshaded)
- Chance of flooding over 30 yrs
- 0.0%
- Est. flood insurance / yr
- $507 – $1,088
Fire risk 1/10 · Minimal
- Est. fire insurance / yr
- $947 – $1,759
Heat risk 10/10 · Severe
- Hot days now (above 105°F)
- 7 days/yr
- Hot days in 30 yrs
- 28 days/yr
Wind risk 10/10 · Severe
- Chance of severe wind over 30 yrs
- 99.0%
Air-quality risk 2/10 · Minimal
- Unhealthy air days now
- 2 days/yr
- Unhealthy air days in 30 yrs
- 2 days/yr
Risk factors via First Street. Map © Google.
Why this score? — see what drove the C- grade
The composite is a weighted blend of 9 inputs, each scored 0–100. Each bar is that input's sub-score; the figure is the points it added to the 100-point composite (weight × sub-score).
- Cash flow +19.5/30.0
- ARV discount +7.5/15.0
- DSCR +6.1/10.0
- 1% rule +4.8/10.0
- Schools +4.1/10.0
- Livability +3.9/5.0
- Rent growth +3.2/5.0
- Condition / age +2.5/5.0
- Appreciation +0.0/10.0
$629,999
🖨 Deal sheet (PDF) 📄 Offer letter ✓ Due diligence
Multi-family units
County records classify this as Multi-Family (2-4 Unit). Listing-text estimate: 2 units. confirmed
Listing remarks MLS
Could be bought with 1751 SW 40 Terr. Great income property . Drive by, DO NOT DISTURBE TENANTS!!!!!! MAKE OFFER CONTINGENT ON VIEWING. !!! Don't miss opportunity!!!!!
Key facts
- 2023 roof
- Cbs duplex
- 4 parking spots
Tags
Property features AI
Finance
- Other:
- Financial info: Two separate units with listed rents: one unit rented at $2,500, the other on month-to-month at $2,300
- HOA & community:
Exterior
- Parking: Total of 4 parking spaces; Each unit lists parking space
- Security:
- Utilities: Cable available; Public sewer
- Home design: Two-story building; Zoned RD-10; Effective year built
- Construction: Block construction
- Exterior features: Less than quarter-acre lot
Interior
- Kitchen:
- Bedrooms: Two 3-bedroom units (each unit: 3 bedrooms)
- Flooring: Ceramic tile; Laminate
- Bathrooms: Each unit has 3 total bathrooms (2 full, 1 half)
- Heating & cooling: Central heating; Central air conditioning
- Interior features: Ceramic tile and laminate flooring
- Laundry & utility: Each unit includes a laundry room
Neighborhood map
What this means for you Summary
Snapshot
- This is a 2 × 3.0-bed/2.5-bath units multifamily listed at $630k.
Deal economics
- At list price, monthly cash flow is $709 ($9k/yr) — positive. Per door: $355/mo.
- The deal already cash-flows at list — no discount required.
- To meet the 1% rule (rent ≥ 1% of price), the offer needs to be $617k (2.0% below list).
- Recommended offer: $554k (12.0% below list) — sets the bar for market timing.
Location & tenants
- Location reads 77/100 on livability (#185 in FL, #2,922 nationally) — a middle-class / working-renter tenant base. Strengths: commute A+, housing A+, cost of living A; Watch: amenities F, employment D-.
- Broward (suburban): math 42% / reading 53% proficiency, ranked #46 of 73 in FL (top 63%) — families likely to look elsewhere, expect single-tenant / working-renter base with shorter leases.
- Zoned schools: Nova Blanche Forman Elementary (math 35% / reading 55%, grade D-, #1,271 of 2,144 statewide, top 60%, 769 students, 72% FRL); New River Middle School (math 36% / reading 44%, grade F, #368 of 571 statewide, top 65%, 1,587 students, 70% FRL); Nova High School (math 22% / reading 56%, grade F, #312 of 667 statewide, top 48%, 2,227 students, 59% FRL) — zoned schools average 67% FRL vs 51% district-wide (16 pts higher); higher-poverty schools than district average — tighter screening recommended.
- Market conditions: Rents rising (+2.8%/yr); 217 active listings in the ZIP; 5 comparable units currently listed for rent nearby; rentals leasing fast (median 8d on market — plan ~1-2 weeks tenant-placement turnaround); solid renter incomes; 2,111 units permitted in Broward County in 2024 (1,265 in 5+ unit buildings).
- At $6,171/mo this rent would consume 79% of the median local household income ($94k/yr) (locally 953% of renters already pay >50% of income on rent) — very limited rent-growth headroom before tenants either downsize or default.
Forward outlook
- Local home prices are declining (-3.0%/yr); year-one equity from $4k of loan paydown is wiped out by about $19k of value loss. Plan a longer hold.
- Broward County population projected at +34% by 2050 — long-run rental-demand tailwind backs the buy-and-hold thesis.
Negotiation context
- It's been on market 214 days — a 12% lower offer ($554k) is reasonable based on typical stale-listing flexibility.
- Current owner paid $87k; list at $630k implies a 624% gain — meaningful room to come down on a strong offer.
Risks & watch-outs
- Climate carrying-cost: severe wind risk, 99% chance of damaging wind over 30y; extreme-heat days projected 7→28/yr by 2055 (HVAC capex compounding) — expect insurance premiums to compound above CPI over the hold.
Questions for the listing agent
- It's been on market 214 days. Have you received any prior offers? Is the seller open to a 12% concession, seller financing, or rate buy-down credit?
- Can we see the unit-by-unit rent roll, current vacancy, and any below-market leases? What's the average tenancy length?
- What capital expenditures (roof, boiler, parking lot, exteriors) have been made in the last 5 years, and what's planned in the next 2?
- Why hasn't it sold? Are there any deal-killer items the seller is aware of (foundation, flood, title, zoning, code violations)?
- Is there a deadline driving the sale (1031 exchange, divorce, estate, relocation)? That informs how much negotiation room exists.
- What's the average days-on-market for RENTAL listings here right now (not sales)? A rising rental-DOM trend means longer vacancies and softer asking-rent achievability than the comps imply.
- What's the recent tenant-quality profile in this submarket — average credit score on applications, eviction rate, late-payment / NSF rate, and stable-employment percentage? A property-management company in the area should have these aggregated.
- How much new apartment / multifamily construction is in the pipeline within 1–3 miles? Heavy new supply (>2% of stock underway) typically softens rents 12–24 months out; light construction supports rent growth.
Investment metrics
- 1% rule
- 0.98% ✗
- Cap rate
- 7.64%
- Cash-on-cash
- 4.83%
- DSCR
- 1.21
- GRM
- 8.5
CMA / ARV
No comps found within radius.
Projected returns pro-forma
-3.0% appreciation · 2.8% rent growth · sell at horizon
- IRR
- -9.0%
- Equity multiple
- 0.67×
- Total profit
- $-58,174
- Equity at exit
- $93,935
- IRR
- 0.2%
- Equity multiple
- 1.01×
- Total profit
- $2,356
- Equity at exit
- $54,471
Cash invested: $176,400 (down + closing). Projections, not guarantees.
Landlord ↔ Tenant lean methodology
- Overall (STATE)
- 87 Strongly Landlord-Friendly
- State Florida
- 87 Strongly Landlord-Friendly · R+3
- County
- — inherits STATE
- City
- — inherits STATE
ZIP-level market 33317
- Rents YoY
- 2.8%
- Active inventory
- 217
- Price-to-rent
- 17.0×
Monthly cashflow live
- Estimated rent
- $6,171 high interval (Pro) →
- Mortgage (P&I)
- −$3,304
- Tax from tax record
- −$600 /mo · $7,194/yr
- Insurance
- −$262
- HOA
- −$0
- Vacancy / Maint / Mgmt
- −$1,296
- Net cashflow
- $709
Break-even live
Sensitivity live
| Price | -10% $1,066 | -5% $888 | +0% $709 | +5% $531 | +10% $353 |
|---|---|---|---|---|---|
| Rent | -10% $222 | -5% $466 | +0% $709 | +5% $953 | +10% $1,197 |
| Rate | -1.0pp $1,027 | -0.5pp $870 | base $709 | +0.5pp $546 | +1.0pp $380 |
2-unit breakdown (identical units grouped — click to expand)
| Units | Beds | Baths | Est. rent |
|---|---|---|---|
| 2× units | 3.0 | 2.5 | $6,170 |
| #1 | 3.0 | 2.5 | $3,085 |
| #2 | 3.0 | 2.5 | $3,085 |
| Total (2 units) | $6,171 | ||
UW: 25.0% down · 7.5% · 30yr · 1.5% tax · 5.0% vac · 8.0% maint · 8.0% mgmt
Financing live
Cash to close
- Down payment
- $157,500
- Closing costs
- $18,900
- Reserves months
- —
- Total cash needed
- —
Loan-product check · same deal, 3 products live
Conventional
25% down · 7.5% · 30yr
- Down + closing
- —
- Monthly P&I
- —
- Monthly cashflow
- —
- DSCR
- —
- Eligible?
- —
Personal DTI + credit; lowest rate.
DSCR
20% down · 8.5% · 30yr
- Down + closing
- —
- Monthly P&I
- —
- Monthly cashflow
- —
- DSCR
- —
- Eligible?
- —
No personal income docs; deal must DSCR.
Hard money
10% down · 12.0% · 12mo
- Down + closing
- —
- Monthly P&I
- —
- Monthly cashflow
- —
- DSCR
- —
- Eligible?
- —
Short-term bridge; refi at stabilization.
Rent comps 5 comps
| Address | Beds | Baths | Sqft | Rent | $/sqft | DOM | Units | Dist |
|---|---|---|---|---|---|---|---|---|
| 1930 SW 36th Ave Fort Lauderdale, FL | 5.0 | 2.5 | 2188 | $8,295 | $3.79 | 7d | 1 | 0.59mi |
| 1930 SW 36th Ave Fort Lauderdale, FL | 5.0 | 2.5 | 2188 | $8,495 | $3.88 | 17d | 1 | 0.59mi |
| 836 Pennsylvania Ave Fort Lauderdale, FL | 5.0 | 3.0 | 1837 | $3,300 | $1.80 | 26d | 1 | 0.84mi |
| 2120 SW 28th Way Fort Lauderdale, FL | 5.0 | 3.0 | 2778 | $14,500 | $5.22 | 7d | 1 | 1.38mi |
| 2100 SW 28th Way Fort Lauderdale, FL | 5.0 | 4.0 | 2145 | $7,495 | $3.49 | 7d | 1 | 1.40mi |
Listing history 23 events
-
2026-06-21days on market $629,999 Active 214 DOM
-
2026-06-18days on market $629,999 Active 211 DOM
-
2026-06-17days on market $629,999 Active 210 DOM
-
2026-06-16days on market $629,999 Active 209 DOM
-
2026-06-15days on market $629,999 Active 208 DOM
-
2026-06-13pricedays on market $629,999 Active 206 DOM
-
2026-06-09days on market $649,999 Active 202 DOM
-
2026-06-07days on market $649,999 Active 200 DOM
-
2026-06-04days on market $649,999 Active 197 DOM
-
2026-06-03days on market $649,999 Active 196 DOM
-
2026-06-02days on market $649,999 Active 195 DOM
-
2026-06-01days on market $649,999 Active 194 DOM
-
2026-05-31days on market $649,999 Active 193 DOM
-
2026-02-09price $670,000
-
2025-11-19$700,000 Active
-
2012-05-07soldstatus $87,000
-
2006-09-05soldstatus $322,000
-
2006-08-02soldstatus $322,000 167-char remark
Show marketing remark (167 chars)
Could be bought with 1751 SW 40 Terr. Great income property . Drive by, DO NOT DISTURBE TENANTS!!!!!! MAKE OFFER CONTINGENT ON VIEWING. !!! Don't miss opportunity!!!!!
-
2004-03-29soldstatus $199,000
-
2002-09-13soldstatus $153,000
-
2000-06-28soldstatus $140,000
-
1995-01-26soldstatus $112,000
-
1994-06-30soldstatus $290,000
ⓘ Source: listings_history table (triggers on properties + properties_extension) + one-shot
backfill from property_details.listing_events for pre-trigger history.
Tax reassessment forecast FL · Resets to sale price
- Current annual tax
- $7,194 · $600/mo
- Projected year-2 tax
- $7,194 · $600/mo
- Expected delta
- $0/yr ($0/mo · 0.0%)
ⓘ Screening estimate from a state-policy table — verify with the county assessor before closing.
Climate risk First Street
- Flood 1/10 Low FEMA zone X (unshaded) · 0% chance over 30 yrs
- Wildfire 1/10 Low
- Heat 10/10 Extreme 7 d/yr ≥105°F today · 28 d/yr by 30 yrs out
- Wind 10/10 Extreme 99% chance of damaging wind over 30 yrs
- Air quality 2/10 Low 2 unhealthy d/yr today · 2 by 30 yrs out
Nearby sold comps map
Loading sold comps map…
Walkable amenities ~0.75 mi
Loading nearby amenities…
Taxation est. · year 1
- Rental income
- $74,052
- − Mortgage interest
- −$35,290
- − Property taxes
- −$7,194
- − Insurance
- −$3,150
- − Repairs & maintenance
- −$5,924
- − Management
- −$5,924
- − Depreciation
- −$18,327
- Taxable loss
- −$1,758
- Est. tax savings @ 24.0%
- +$422
- After-tax cash flow
- $8,933/yr
For passive investors: Depreciation is non-cash, so a rental often shows a tax loss while cash-flowing — sheltering income. Rental losses are passive: they offset passive income freely, and up to $25,000/yr can offset ordinary (W-2) income if you actively participate and your MAGI is under $100k (phasing out to $0 by $150k); unused losses carry forward. On sale, claimed depreciation is recaptured at up to 25%, and gains may owe capital-gains tax (a 1031 exchange can defer both). Figures are a year-1 estimate at your 24.0% rate — not tax advice; consult a CPA.
Schools (NCES district)
- District
- Broward
- NCES district ID
- 1200180
- Math proficiency
- 42% ▼ -18.00%
- Reading proficiency
- 53% ▼ -5.00%
- Median HH income
- $52,139
- Composite
- 40.88/100
- National rank
- #3621
- State rank
- #46 of 73 in FL
Livability — Broadview Park
- Score
- 77/100
- State rank
- #185
- US rank
- #2922
Category grades
Schools grade is shown separately in the Schools card above.
Census & demographics
- Census place
- Broadview Park, FL
- County
- Broward County · 1,963,430 people
- Metro
- Miami-Fort Lauderdale-Pompano Beach, FL
- Population (ZIP)
- 37,950
- Household income
- $93,603
- Rent vs Own
- Severe rent burden
- 953.0
Population outlook (Broward County) Hauer SSP2
- Today (2025)
- 2,207,033 people
- By 2030
- 2,360,704 · +7.0%
- By 2040
- 2,661,208 · +20.6%
- By 2050
- 2,946,698 · +33.5%
- By 2075
- 3,602,273 · +63.2%
- By 2100
- 3,970,984 · +79.9%
Race, ethnicity, and origin ACS 2023
- Neighborhood character
- Highly diverse neighborhood (Simpson 0.71)
- Race & ethnicity
- Hispanic / Latino 37% White 32% Black 23% Two or more races 22% Asian 4%
- Hispanic origin (detail)
- Mexican 3% Puerto Rican 7% Cuban 7% Dominican 2%
- Common ancestry
- Hispanic 7% Romanian 2% Italian 1%
- Foreign-born
- 33% · Canada, Jamaica, South Korea
- Languages at home
- 58% English-only · Spanish 30% French/Haitian/Cajun 7% Other Indo-European 2%
Political lean MEDSL · Broward
- 2024 margin
- D (+17.0) · D 58.0% · R 41.0%
- 2008→2024 swing
- -17.8pp toward R · 2008: 34.7pp · 2024: 17.0pp
- All cycles
- 2024: D+17.0 2020: D+29.8 2016: D+35.0 2012: D+34.9 2008: D+34.7
Not yet ingested
- Civics
- —
Market trends
- HPI YoY
- ▼ -269.35%
- Current HPI
- 432.04
- Rent YoY
- ▲ 2.80%
- Metro
- Miami-Fort Lauderdale-Pompano Beach, FL
- State GDP YoY
- ▲ 3.28%
- F500 in state
- 36
Industry mix (Fortune 500 HQ in FL)
| Industry | F500 HQs | Revenue |
|---|---|---|
| Industrial Technology | 2 | $29B |
|
||
| Insurance | 2 | $17B |
|
||
| Retail | 1 | $60B |
|
||
| Technology Distribution | 1 | $58B |
|
||
| Homebuilding | 1 | $35B |
|
||
| Technology Manufacturing | 1 | $35B |
|
||
Price history
+131.0% since first listed10 events — show timeline
- 2026-02-09 Price Changed $670,000 MARMLS
- 2025-11-19 Listed $700,000 MARMLS
- 2012-05-07 Sold (Public Records) $87,000 Public Records
- 2006-09-05 Sold (Public Records) $322,000 Public Records
- 2006-08-02 Sold (MLS) $322,000 MARMLS
- 2004-03-29 Sold (Public Records) $199,000 Public Records
- 2002-09-13 Sold (Public Records) $153,000 Public Records
- 2000-06-28 Sold (Public Records) $140,000 Public Records
- 1995-01-26 Sold (Public Records) $112,000 Public Records
- 1994-06-30 Sold (Public Records) $290,000 Public Records
Property tax history
+7.6%/yrLatest (2025): $7,194 · +7.8% YoY. Source: county tax records.
Cash-flow waterfall
monthlySold comps — $/sqft
last 12 mo · ≤1 miLoading sold comps…