373 Cowpoke Dr · Jarrell, TX
Flood risk No data
- FEMA flood zone
- —
- Chance of flooding over 30 yrs
- —
- Est. flood insurance / yr
- —
Fire risk No data
- Est. fire insurance / yr
- —
Heat risk No data
- Hot days now (above threshold)
- —
- Hot days in 30 yrs
- —
Wind risk No data
- Chance of severe wind over 30 yrs
- —
Air-quality risk No data
- Unhealthy air days now
- —
- Unhealthy air days in 30 yrs
- —
Risk factors via First Street. Map © Google.
Why this score? — see what drove the D grade
The composite is a weighted blend of 9 inputs, each scored 0–100. Each bar is that input's sub-score; the figure is the points it added to the 100-point composite (weight × sub-score).
- ARV discount +11.9/15.0
- Cash flow +9.5/30.0
- 1% rule +4.3/10.0
- Condition / age +4.0/5.0
- Livability +3.6/5.0
- DSCR +2.7/10.0
- Rent growth +2.1/5.0
- Schools +2.1/10.0
- Appreciation +0.0/10.0
$200,000
🖨 Deal sheet 📄 Offer letter ✓ Due diligence
Listing remarks MLS
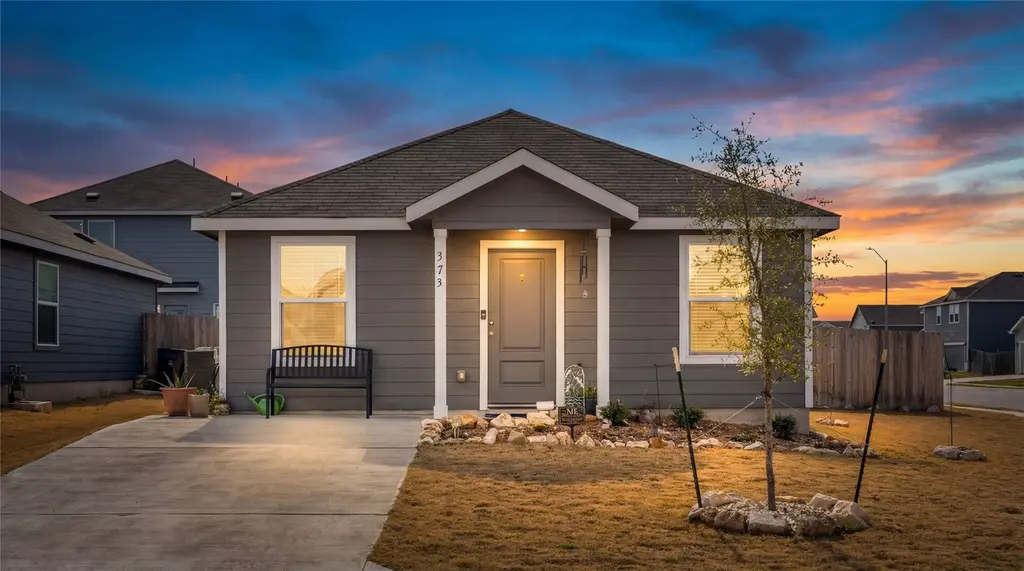
Welcome to 373 Cowpoke Dr, a sleek and inviting home featuring an open floor plan with modern touches throughout. Enjoy vinyl flooring in the main living and dining areas paired with light, neutral paint colors that create a bright and welcoming atmosphere. The living room and kitchen flow seamlessly, making entertaining effortless and everyday living comfortable. Situated on a corner lot, this home is filled with abundant natural light that makes you feel right at home. With four bedrooms, the flexible layout allows space for guests, a home office, or hobby rooms to fit your needs. The backyard is ready to make your own, offering the perfect canvas for outdoor living. Located in the desirable Rancho Del Cielo master-planned community, residents enjoy amenities including pocket parks, picnic areas, green spaces, a pickleball court, and a community pool. Conveniently positioned near Berry Springs Park and Preserve, Wolf Ranch Town Center, and the University Oaks area, shopping and dining are a breeze. Plus, you're just 10 miles from Georgetown’s historic downtown, offering even more restaurants, boutiques, and entertainment options. This home combines modern style, functional space, and an unbeatable location — don’t miss it!
Key facts
- Open floor plan
- Vinyl flooring
- Pickleball court
Tags
Neighborhood map
What this means for you Summary
Snapshot
- This is a 4-bed/2.0-bath single-family listed at $200k. Condition is rated good.
Deal economics
- At list price, monthly cash flow is $-140 ($-2k/yr) — negative.
- To cash-flow at today's rent, offer at most $175k (12.4% below list).
- To meet the 1% rule (rent ≥ 1% of price), the offer needs to be $186k (7.2% below list).
- Recommended offer: $175k (12.4% below list) — sets the bar for cash-flow.
Location & tenants
- Location reads 71/100 on livability (#313 in TX) — a middle-class / working-renter tenant base. Strengths: employment A+, housing A+, crime A; Watch: schools F, amenities F, commute F.
- Jarrell ISD (rural): math 19% / reading 28% proficiency, ranked #713 of 826 in TX (top 86%) — low school quality limits family demand, transient renter base, plan for 1-2y turnover.
- Market conditions: Rents soft (-1.7%/yr); 761 active listings in the ZIP; 12 comparable units currently listed for rent nearby; rentals at typical pace (median 24d on market — plan ~3-4 weeks tenant-placement turnaround); 42% of comp listings sitting > 30 days — soft ceiling on asking rent; solid renter incomes; 7,543 units permitted in Williamson County in 2024 (1,425 in 5+ unit buildings).
Forward outlook
- Local home prices are declining (-3.0%/yr); year-one equity from $1k of loan paydown is wiped out by about $6k of value loss. Plan a longer hold.
- Williamson County population projected at +69% by 2050 — long-run rental-demand tailwind backs the buy-and-hold thesis.
Negotiation context
- It's been on market 119 days — a 9% lower offer ($182k) is reasonable based on typical stale-listing flexibility.
Risks & watch-outs
- Watch-outs: property tax is 2.5% of price.
Questions for the listing agent
- What do current leases actually rent for vs. the listed asking? Can we see a recent rent roll and the last 12 months of T-12 income?
- It's been on market 119 days. Have you received any prior offers? Is the seller open to a 12% concession, seller financing, or rate buy-down credit?
- Property tax is high relative to price — has the assessment been appealed recently, and will the sale trigger a re-assessment?
- What does the HOA fee cover, when was the last increase, and are there any pending special assessments or reserve-fund shortfalls?
- Why hasn't it sold? Are there any deal-killer items the seller is aware of (foundation, flood, title, zoning, code violations)?
- Is there a deadline driving the sale (1031 exchange, divorce, estate, relocation)? That informs how much negotiation room exists.
- Schools are F-rated, which usually means shorter tenancies and higher turnover. Who's the typical renter profile here, and what's been the actual vacancy rate?
- The area grade is low — what's the realistic commute time and amenity access for the typical tenant pool here? Any planned neighborhood developments (good or bad) we should know about?
- What's the average days-on-market for RENTAL listings here right now (not sales)? A rising rental-DOM trend means longer vacancies and softer asking-rent achievability than the comps imply.
- What's the recent tenant-quality profile in this submarket — average credit score on applications, eviction rate, late-payment / NSF rate, and stable-employment percentage? A property-management company in the area should have these aggregated.
- How much new for-sale + rental construction is in the pipeline within 1–3 miles? Heavy new supply typically softens prices + rents 12–24 months out; constrained supply supports both.
Investment metrics
- 1% rule
- 0.93% ✗
- Cap rate
- 5.45%
- Cash-on-cash
- -3.01%
- DSCR
- 0.87
- GRM
- 9.0
CMA / ARV
- ARV (median comp)
- $221,480
- List price
- $200,000
- Delta
- -9.70%
- Verdict
- FAIR
- Comps
- 20 within 1.0 mi
Show comp detail 12 sales within ~0.75 mi
| Address | Dist | Beds/Ba | Sqft | Sold | Price | $/sf | Match |
|---|---|---|---|---|---|---|---|
| 433 Jones Beach Ln | 0.14mi | 4/2.0 | 1,483 (-1%) | 1mo | $208,999 | $141 | 91 |
| 417 Jones Beach Ln | 0.17mi | 4/2.0 | 1,483 (-1%) | 1mo | $220,990 | $149 | 90 |
| 405 Jones Beach Ln | 0.19mi | 4/2.0 | 1,483 (-1%) | 1mo | $212,990 | $144 | 89 |
| 506 Jones Beach Cv | 0.08mi | 4/2.0 | 1,600 (+7%) | 1mo | $236,990 | $148 | 84 |
| 436 Jones Beach Ln | 0.13mi | 4/2.0 | 1,600 (+7%) | 1mo | $236,990 | $148 | 82 |
| 527 Jones Beach Cv | 0.13mi | 4/2.0 | 1,600 (+7%) | 1mo | $230,990 | $144 | 82 |
| 510 Jones Beach Cv | 0.08mi | 3/2.0 (-1) | 1,411 (-6%) | 1mo | $212,990 | $151 | 81 |
| 519 Jones Beach Cv | 0.12mi | 3/2.0 (-1) | 1,402 (-6%) | 2mo | $208,990 | $149 | 77 |
| 261 Kings Row Ln | 0.06mi | 3/2.0 (-1) | 1,354 (-10%) | 1mo | $200,990 | $148 | 75 |
| 468 Jones Beach Ln | 0.08mi | 3/2.0 (-1) | 1,354 (-10%) | 1mo | $220,990 | $163 | 74 |
| 420 Jones Beach Ln | 0.16mi | 3/2.0 (-1) | 1,354 (-10%) | 1mo | $217,990 | $161 | 71 |
| 121 Texas Angel Way | 0.16mi | 3/2.0 (-1) | 1,354 (-10%) | 1mo | $198,999 | $147 | 70 |
Match score weights: distance 35% · size 25% · config 20% · recency 20%. Top-matched comps best support the ARV.
Projected returns pro-forma
-3.0% appreciation · 0.0% rent growth · sell at horizon
- IRR
- -25.3%
- Equity multiple
- 0.17×
- Total profit
- $-46,624
- Equity at exit
- $29,821
- IRR
- -37.9%
- Equity multiple
- -0.29×
- Total profit
- $-72,462
- Equity at exit
- $17,292
Cash invested: $56,000 (down + closing). Projections, not guarantees.
Landlord ↔ Tenant lean methodology
- Overall (STATE)
- 87 Strongly Landlord-Friendly
- State Texas
- 87 Strongly Landlord-Friendly · R+5
- County
- — inherits STATE
- City
- — inherits STATE
ZIP-level market 76537
- Home prices YoY
- -14.4%
- Rents YoY
- -1.7%
- Active inventory
- 761
- Price-to-rent
- 9.0×
Monthly cashflow live
- Estimated rent
- $1,856 high interval (Pro) →
- Mortgage (P&I)
- −$1,049
- Tax from tax record
- −$419 /mo · $5,026/yr
- Insurance
- −$83
- HOA
- −$56
- Vacancy / Maint / Mgmt
- −$390
- Net cashflow
- $-140
Break-even live
UW: 25.0% down · 7.5% · 30yr · 1.5% tax · 5.0% vac · 8.0% maint · 8.0% mgmt
Financing live
Cash to close
- Down payment
- $50,000
- Closing costs
- $6,000
- Reserves months
- —
- Total cash needed
- —
Loan-product check · same deal, 3 products live
Conventional
25% down · 7.5% · 30yr
- Down + closing
- —
- Monthly P&I
- —
- Monthly cashflow
- —
- DSCR
- —
- Eligible?
- —
Personal DTI + credit; lowest rate.
DSCR
20% down · 8.5% · 30yr
- Down + closing
- —
- Monthly P&I
- —
- Monthly cashflow
- —
- DSCR
- —
- Eligible?
- —
No personal income docs; deal must DSCR.
Hard money
10% down · 12.0% · 12mo
- Down + closing
- —
- Monthly P&I
- —
- Monthly cashflow
- —
- DSCR
- —
- Eligible?
- —
Short-term bridge; refi at stabilization.
Rent comps 12 comps
| Address | Beds | Baths | Sqft | Rent | $/sqft | DOM | Units | Dist |
|---|---|---|---|---|---|---|---|---|
| 516 Rancho del Cielo Loop Jarrell, TX | 3.0 | 2.0 | 1274 | $1,700 | $1.33 | 43d | 1 | 0.09mi |
| 544 Rancho del Cielo Loop Georgetown, TX | 4.0 | 2.0 | 1606 | $1,800 | $1.12 | 43d | 1 | 0.14mi |
| 337 Rancho del Cielo Loop Georgetown, TX | 3.0 | 2.0 | 1411 | $1,535 | $1.09 | 20d | 1 | 0.15mi |
| 564 Rancho del Cielo Loop Jarrell, TX | 3.0 | 2.0 | 1266 | $1,600 | $1.26 | 2d | 1 | 0.16mi |
| 133 Texas Angel Way Jarrell, TX | 3.0 | 2.0 | 1230 | $1,500 | $1.22 | 23d | 1 | 0.17mi |
| 136 Texas Angel Way Jarrell, TX | 3.0 | 2.0 | 1450 | $1,550 | $1.07 | 4d | 1 | 0.20mi |
| 136 Texas Angel Way Jarrell, TX | 3.0 | 2.0 | 1450 | $1,495 | $1.03 | 43d | 1 | 0.20mi |
| 112 Texas Angel Way Jarrell, TX | 4.0 | 2.0 | 1897 | $1,890 | $1.00 | 17d | 1 | 0.22mi |
| 856 Rancho del Cielo Loop Jarrell, TX | 3.0 | 2.0 | 1447 | $1,600 | $1.11 | 43d | 1 | 0.33mi |
| 128 Hasty Heart Ct Jarrell, TX | 4.0 | 2.0 | 1606 | $1,775 | $1.11 | 17d | 1 | 0.34mi |
| 100 Tugboat Annie WAY Jarrell, TX | 4.0 | 2.5 | 1984 | $1,799 | $0.91 | 43d | 1 | 0.39mi |
| 253 Tugboat Annie Way Jarrell, TX | 3.0 | 2.0 | 1380 | $1,495 | $1.08 | 14d | 1 | 0.44mi |
HOA detail
- Monthly dues
- $56 · $672/yr
- Likely covers
- pool
Listing history 15 events
-
2026-06-18days on market $200,000 Active 119 DOM
-
2026-06-17days on market $200,000 Active 118 DOM
-
2026-06-16days on market $200,000 Active 117 DOM
-
2026-06-15days on market $200,000 Active 116 DOM
-
2026-06-13days on market $200,000 Active 114 DOM
-
2026-06-09days on market $200,000 Active 110 DOM
-
2026-06-08days on market $200,000 Active 109 DOM
-
2026-06-07days on market $200,000 Active 108 DOM
-
2026-06-04days on market $200,000 Active 105 DOM
-
2026-06-03days on market $200,000 Active 104 DOM
-
2026-06-02days on market $200,000 Active 103 DOM
-
2026-06-01days on market $200,000 Active 102 DOM
-
2026-05-31days on market $200,000 Active 101 DOM
-
2026-03-09price $209,000 1262-char remark
Show marketing remark (1262 chars)
Welcome to 373 Cowpoke Dr, a sleek and inviting home featuring an open floor plan with modern touches throughout. Enjoy vinyl flooring in the main living and dining areas paired with light, neutral paint colors that create a bright and welcoming atmosphere. The living room and kitchen flow seamlessly, making entertaining effortless and everyday living comfortable. Situated on a corner lot, this home is filled with abundant natural light that makes you feel right at home. With four bedrooms, the flexible layout allows space for guests, a home office, or hobby rooms to fit your needs. The backyard is ready to make your own, offering the perfect canvas for outdoor living. Located in the desirable Rancho Del Cielo master-planned community, residents enjoy amenities including pocket parks, picnic areas, green spaces, a pickleball court, and a community pool. Conveniently positioned near Berry Springs Park and Preserve, Wolf Ranch Town Center, and the University Oaks area, shopping and dining are a breeze. Plus, you're just 10 miles from Georgetown’s historic downtown, offering even more restaurants, boutiques, and entertainment options. This home combines modern style, functional space, and an unbeatable location — don’t miss it!
-
2026-02-19$220,000 Active 1262-char remark
Show marketing remark (1262 chars)
Welcome to 373 Cowpoke Dr, a sleek and inviting home featuring an open floor plan with modern touches throughout. Enjoy vinyl flooring in the main living and dining areas paired with light, neutral paint colors that create a bright and welcoming atmosphere. The living room and kitchen flow seamlessly, making entertaining effortless and everyday living comfortable. Situated on a corner lot, this home is filled with abundant natural light that makes you feel right at home. With four bedrooms, the flexible layout allows space for guests, a home office, or hobby rooms to fit your needs. The backyard is ready to make your own, offering the perfect canvas for outdoor living. Located in the desirable Rancho Del Cielo master-planned community, residents enjoy amenities including pocket parks, picnic areas, green spaces, a pickleball court, and a community pool. Conveniently positioned near Berry Springs Park and Preserve, Wolf Ranch Town Center, and the University Oaks area, shopping and dining are a breeze. Plus, you're just 10 miles from Georgetown’s historic downtown, offering even more restaurants, boutiques, and entertainment options. This home combines modern style, functional space, and an unbeatable location — don’t miss it!
ⓘ Source: listings_history table (triggers on properties + properties_extension) + one-shot
backfill from property_details.listing_events for pre-trigger history.
Tax reassessment forecast TX · Resets to sale price
- Current annual tax
- $5,026 · $419/mo
- Projected year-2 tax
- $5,026 · $419/mo
- Expected delta
- $0/yr ($0/mo · 0.0%)
ⓘ Screening estimate from a state-policy table — verify with the county assessor before closing.
Nearby sold comps map
Loading sold comps map…
Walkable amenities ~0.75 mi
Loading nearby amenities…
Taxation est. · year 1
- Rental income
- $22,277
- − Mortgage interest
- −$11,203
- − Property taxes
- −$5,026
- − Insurance
- −$1,000
- − Repairs & maintenance
- −$1,782
- − Management
- −$1,782
- − HOA
- −$672
- − Depreciation
- −$5,818
- Taxable loss
- −$5,006
- Est. tax savings @ 24.0%
- +$1,201
- After-tax cash flow
- $-483/yr
For passive investors: Depreciation is non-cash, so a rental often shows a tax loss while cash-flowing — sheltering income. Rental losses are passive: they offset passive income freely, and up to $25,000/yr can offset ordinary (W-2) income if you actively participate and your MAGI is under $100k (phasing out to $0 by $150k); unused losses carry forward. On sale, claimed depreciation is recaptured at up to 25%, and gains may owe capital-gains tax (a 1031 exchange can defer both). Figures are a year-1 estimate at your 24.0% rate — not tax advice; consult a CPA.
Condition & rehab AI · 6 photos
This home is in good condition with a modern kitchen and light, neutral paint colors. It has a welcoming entrance and a simple, well-maintained landscaping. The property is located on a corner lot with abundant natural light, making it an attractive option for both buyers and renters.
Value-add opportunities
- Both Landscaping and curb appeal improvements — Enhances the home's curb appeal and can attract more buyers or renters.
- Both Painting exterior and interior walls — Fresh paint can make the home look more inviting and can increase its value.
- Both Landscaping and curb appeal improvements — Enhances the home's curb appeal and can attract more buyers or renters.
Renovation cost estimate screening
Value-add ROI direction
- Both Landscaping and curb appeal improvements — Enhances the home's curb appeal and can attract more buyers or renters. ↑
- Both Painting exterior and interior walls — Fresh paint can make the home look more inviting and can increase its value. ↑
- Both Landscaping and curb appeal improvements — Enhances the home's curb appeal and can attract more buyers or renters. ↑
ⓘ Cost ranges are severity-bucket heuristics (US national rule-of-thumb). Get contractor quotes + a written scope before underwriting a rehab budget.
Schools (NCES district)
- District
- Jarrell ISD
- NCES district ID
- 4824600
- Math proficiency
- 19% ▼ -18.00%
- Reading proficiency
- 28% ▼ -5.00%
- Median HH income
- $57,132
- Composite
- 21.47/100
- National rank
- #8335
- State rank
- #713 of 826 in TX
Livability — Jarrell
- Score
- 71/100
- State rank
- #313
- US rank
- #7020
Category grades
Schools grade is shown separately in the Schools card above.
Census & demographics
- County
- Williamson County · 680,029 people
- City population
- 16,272
- Metro
- Austin-Round Rock-Georgetown, TX
- Population (ZIP)
- 16,272
- Household income
- $98,199
- Rent vs Own
- Severe rent burden
- 225.0
Population outlook (Williamson County) Hauer SSP2
- Today (2025)
- 699,027 people
- By 2030
- 795,537 · +13.8%
- By 2040
- 990,683 · +41.7%
- By 2050
- 1,184,292 · +69.4%
- By 2075
- 1,623,825 · +132.3%
- By 2100
- 1,924,153 · +175.3%
Race, ethnicity, and origin ACS 2023
- Neighborhood character
- Diverse neighborhood (Simpson 0.63)
- Race & ethnicity
- White 48% Hispanic / Latino 36% Two or more races 14% Black 7% Asian 4%
- Hispanic origin (detail)
- Mexican 30% Puerto Rican 5%
- Common ancestry
- Romanian 3% Italian 2% Slovak 1%
- Foreign-born
- 13% · Canada, Vietnam
- Languages at home
- 69% English-only · Spanish 26% Chinese 2% French/Haitian/Cajun 1%
Political lean MEDSL · Williamson
- 2024 margin
- Toss-up / Even · D 48.0% · R 50.4% · Other 1.6%
- 2008→2024 swing
- +10.6pp toward D · 2008: -13.0pp · 2024: -2.5pp
- All cycles
- 2024: R+2.5 2020: D+1.4 2016: R+9.9 2012: R+21.5 2008: R+13.0
Not yet ingested
- Civics
- —
Market trends
- HPI YoY
- ▼ -31.03%
- Current HPI
- 184.8935
- Rent YoY
- ▼ -1.73%
- Metro
- Austin-Round Rock-Georgetown, TX
- State GDP YoY
- ▲ 3.95%
- F500 in state
- 110
Industry mix (Fortune 500 HQ in TX)
| Industry | F500 HQs | Revenue |
|---|---|---|
| Energy | 16 | $1,198B |
|
||
| Technology | 5 | $198B |
|
||
| Engineering / Construction | 4 | $72B |
|
||
| Energy Services | 3 | $60B |
|
||
| Utilities | 3 | $41B |
|
||
| Healthcare | 2 | $330B |
|
||
Price history
-5.0% since first listed2 events — show timeline
- 2026-03-09 Price Changed $209,000 Unlock MLS
- 2026-02-19 Listed $220,000 Unlock MLS
Property tax history
+253.8%/yrLatest (2026): $5,026 · +253.8% YoY. Source: county tax records.
Cash-flow waterfall
monthlySold comps — $/sqft
last 12 mo · ≤1 miLoading sold comps…