821 Holt Ave · Greensboro, NC
Flood risk 1/10 · Minimal
- FEMA flood zone
- X (unshaded)
- Chance of flooding over 30 yrs
- 0.0%
- Est. flood insurance / yr
- $507 – $1,088
Fire risk 1/10 · Minimal
- Est. fire insurance / yr
- $906 – $1,684
Heat risk 5/10 · Moderate
- Hot days now (above 103°F)
- 7 days/yr
- Hot days in 30 yrs
- 17 days/yr
Wind risk 4/10 · Minor
- Chance of severe wind over 30 yrs
- 15.0%
Air-quality risk 2/10 · Minimal
- Unhealthy air days now
- 1 days/yr
- Unhealthy air days in 30 yrs
- 2 days/yr
Risk factors via First Street. Map © Google.
Why this score? — see what drove the D+ grade
The composite is a weighted blend of 9 inputs, each scored 0–100. Each bar is that input's sub-score; the figure is the points it added to the 100-point composite (weight × sub-score).
- Cash flow +15.4/30.0
- ARV discount +12.4/15.0
- DSCR +4.7/10.0
- Livability +4.0/5.0
- Schools +3.6/10.0
- Rent growth +3.5/5.0
- 1% rule +3.0/10.0
- Condition / age +2.5/5.0
- Appreciation +0.0/10.0
$185,000
🖨 Deal sheet (PDF) 📄 Offer letter ✓ Due diligence
Listing remarks
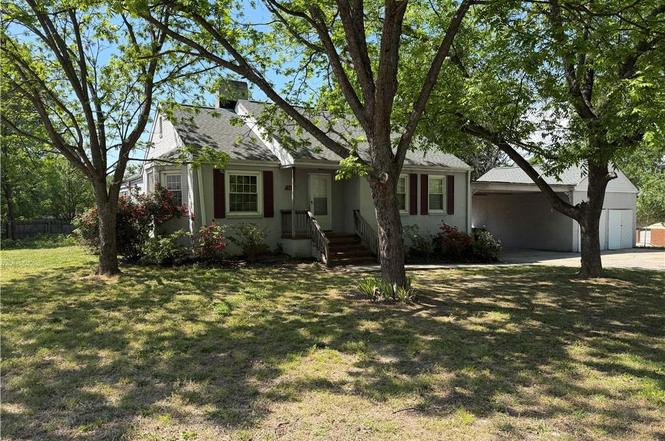
Solid brick ranch situated on an oversized lot with an unfinished basement offering additional potential. This home features 3 bedrooms and 1.5 baths, along with a spacious 2-car garage. Home is in need of updates, offering a great opportunity to renovate and make it your own. Being sold as-is, it’s an excellent option for buyers looking to add value and customize to their needs
Key facts
- Unfinished basement
- Oversized lot
- 0.39 acre lot
Tags
Property features AI
Finance
- HOA & community: No homeowners association
Exterior
- Parking: Detached garage; 2 garage spaces
- Utilities: Public water; Public sewer; Gas water heater
- Home design: Single-story house; Stick/site built residential; Built in 1939; Living room fireplace
- Construction: Brick construction
- Exterior features: City lot; Public maintained road
Interior
- Kitchen: Kitchen on the main level; Gas water heater
- Bedrooms: Bedrooms located on the main level
- Bathrooms: 1 full bathroom; 1 half bathroom
- Heating & cooling: Forced air heating; Natural gas heating; Central air conditioning
- Interior features: Primary bedroom on the main level; Sunroom; Den; Living room with fireplace
- Laundry & utility: Unfinished basement (utility space)
Neighborhood map
What this means for you Summary
Snapshot
- This is a 3-bed/1.5-bath single-family listed at $185k.
Deal economics
- At list price, monthly cash flow is $70 ($844/yr) — positive.
- The deal already cash-flows at list — no discount required.
- To meet the 1% rule (rent ≥ 1% of price), the offer needs to be $148k (19.8% below list).
- Recommended offer: $148k (19.8% below list) — sets the bar for 1% rule.
- Cap rate 6.7% vs local median 3.7% in Greensboro — top-decile yield for the area; either an underpriced asset or a hidden risk that comps aren't pricing in. Stress-test before assuming the spread holds.
Location & tenants
- Location reads 81/100 on livability (#12 in NC, #1,335 nationally) — a professional / high-income tenant draw. Strengths: amenities A+, commute A+, cost of living A+; Watch: employment D, crime F.
- Guilford County Schools (urban): math 39% / reading 45% proficiency, ranked #99 of 178 in NC (top 56%) — families likely to look elsewhere, expect single-tenant / working-renter base with shorter leases.
- Zoned schools: Bessemer Elementary (math 21% / reading 17%, grade F, #1,269 of 1,410 statewide, top 91%, 465 students, 99% FRL); Otis L Hairston Sr Middle (math 13% / reading 22%, grade F, #445 of 475 statewide, top 94%, 631 students, 100% FRL); James B Dudley High (math 34% / reading 40%, grade F, #414 of 535 statewide, top 79%, 1,491 students, 100% FRL) — zoned schools average 100% FRL vs 52% district-wide (47 pts higher); higher-poverty schools than district average — tighter screening recommended.
- Zoned-school proficiency averages 24% at this address vs 42% district-wide (-18 pts) — the specific schools serving this property underperform the Guilford County Schools average; the district grade overstates school quality for this exact location.
- Market conditions: Rents rising (+3.8%/yr); 386 active listings in the ZIP; 23 comparable units currently listed for rent nearby; rentals at typical pace (median 25d on market — plan ~3-4 weeks tenant-placement turnaround); 3,843 units permitted in Guilford County in 2024 (2,397 in 5+ unit buildings).
- This rent runs 38% of the median local income ($47k/yr) — at the standard rent-burdened threshold; future hikes will face affordability resistance.
Forward outlook
- Local home prices are declining (-3.0%/yr); year-one equity from $1k of loan paydown is wiped out by about $6k of value loss. Plan a longer hold.
- Guilford County population projected at +26% by 2050 — long-run rental-demand tailwind backs the buy-and-hold thesis.
Negotiation context
- It's been on market 55 days — a 3% lower offer ($179k) is reasonable based on typical stale-listing flexibility.
- Current owner paid $53k; list at $185k implies a 249% gain — meaningful room to come down on a strong offer.
Risks & watch-outs
- Watch-outs: built in 1939 — expect roof / HVAC / electrical / plumbing capex.
- Climate carrying-cost: extreme-heat days projected 7→17/yr by 2055 (HVAC capex compounding) — expect insurance premiums to compound above CPI over the hold.
Questions for the listing agent
- It's been on market 55 days. Have you received any prior offers? Is the seller open to a 20% concession, seller financing, or rate buy-down credit?
- Built in 1939 — when were the roof, HVAC, electrical panel, plumbing, and water heater last replaced?
- Is there a deadline driving the sale (1031 exchange, divorce, estate, relocation)? That informs how much negotiation room exists.
- Crime grade is F in this area — have there been break-ins, vandalism, or insurance claims at this property in the last 3 years? What carrier currently insures it and at what premium?
- The area grade is low — what's the realistic commute time and amenity access for the typical tenant pool here? Any planned neighborhood developments (good or bad) we should know about?
- What's the average days-on-market for RENTAL listings here right now (not sales)? A rising rental-DOM trend means longer vacancies and softer asking-rent achievability than the comps imply.
- What's the recent tenant-quality profile in this submarket — average credit score on applications, eviction rate, late-payment / NSF rate, and stable-employment percentage? A property-management company in the area should have these aggregated.
- How much new for-sale + rental construction is in the pipeline within 1–3 miles? Heavy new supply typically softens prices + rents 12–24 months out; constrained supply supports both.
Investment metrics
- 1% rule
- 0.80% ✗
- Cap rate
- 6.75%
- Cash-on-cash
- 1.63%
- DSCR
- 1.07
- GRM
- 10.4
CMA / ARV
- ARV (on-the-fly)
- $207,480
- Comps found
- 12
Show comp detail 12 sales within ~0.75 mi
| Address | Dist | Beds/Ba | Sqft | Sold | Price | $/sf | Match |
|---|---|---|---|---|---|---|---|
| 904 & 906 Willard St | 0.16mi | 3/1.5 | 1,285 (-3%) | 10mo | $200,000 | $156 | 79 |
| 809 Elwell Ave | 0.35mi | 3/2.0 | 1,426 (+7%) | 8mo | $214,500 | $150 | 63 |
| 3615 Delancy St | 0.38mi | 2/1.0 (-1) | 1,228 (-8%) | 1mo | $85,000 | $69 | 62 |
| 1001 Sykes Ave | 0.19mi | 3/2.0 | 1,521 (+14%) | 7mo | $187,500 | $123 | 59 |
| 702 Sykes Ave | 0.26mi | 3/2.5 | 1,206 (-9%) | 11mo | $190,000 | $158 | 59 |
| 613 Willard St | 0.24mi | 3/2.0 | 1,159 (-13%) | 14mo | $145,000 | $125 | 54 |
| 1209 Willard St | 0.34mi | 3/2.5 | 1,150 (-14%) | 9mo | $229,900 | $200 | 50 |
| 213 Guerrant St | 0.72mi | 3/2.0 | 1,260 (-5%) | 10mo | $235,000 | $187 | 47 |
| 402 Lowdermilk St | 0.73mi | 3/2.0 | 1,244 (-6%) | 13mo | $225,000 | $181 | 42 |
| 2900 Patio Pl | 0.69mi | 4/2.0 (+1) | 1,198 (-10%) | 6mo | $95,000 | $79 | 39 |
| 209 Guerrant St | 0.70mi | 3/2.0 | 1,166 (-12%) | 16mo | $207,500 | $178 | 32 |
| 2804 Buchanan Rd | 0.74mi | 4/2.0 (+1) | 1,527 (+15%) | 8mo | $185,000 | $121 | 27 |
Match score weights: distance 35% · size 25% · config 20% · recency 20%. Top-matched comps best support the ARV.
Projected returns pro-forma
-3.0% appreciation · 3.83% rent growth · sell at horizon
- IRR
- -13.0%
- Equity multiple
- 0.53×
- Total profit
- $-24,334
- Equity at exit
- $27,584
- IRR
- -2.9%
- Equity multiple
- 0.80×
- Total profit
- $-10,560
- Equity at exit
- $15,995
Cash invested: $51,800 (down + closing). Projections, not guarantees.
Landlord ↔ Tenant lean methodology
- Overall (STATE)
- 85 Strongly Landlord-Friendly
- State North Carolina
- 85 Strongly Landlord-Friendly · R+3
- County
- — inherits STATE
- City
- — inherits STATE
ZIP-level market 27405
- Home prices YoY
- -20.6%
- Rents YoY
- 3.8%
- Active inventory
- 386
- Price-to-rent
- 10.4×
Monthly cashflow live
- Estimated rent
- $1,483 high interval (Pro) →
- Mortgage (P&I)
- −$970
- Tax from tax record
- −$54 /mo · $646/yr
- Insurance
- −$77
- HOA
- −$0
- Vacancy / Maint / Mgmt
- −$311
- Net cashflow
- $70
Break-even live
Sensitivity live
| Price | -10% $175 | -5% $123 | +0% $70 | +5% $18 | +10% $-34 |
|---|---|---|---|---|---|
| Rent | -10% $-47 | -5% $12 | +0% $70 | +5% $129 | +10% $188 |
| Rate | -1.0pp $164 | -0.5pp $117 | base $70 | +0.5pp $22 | +1.0pp $-26 |
UW: 25.0% down · 7.5% · 30yr · 1.5% tax · 5.0% vac · 8.0% maint · 8.0% mgmt
Financing live
Cash to close
- Down payment
- $46,250
- Closing costs
- $5,550
- Reserves months
- —
- Total cash needed
- —
Loan-product check · same deal, 3 products live
Conventional
25% down · 7.5% · 30yr
- Down + closing
- —
- Monthly P&I
- —
- Monthly cashflow
- —
- DSCR
- —
- Eligible?
- —
Personal DTI + credit; lowest rate.
DSCR
20% down · 8.5% · 30yr
- Down + closing
- —
- Monthly P&I
- —
- Monthly cashflow
- —
- DSCR
- —
- Eligible?
- —
No personal income docs; deal must DSCR.
Hard money
10% down · 12.0% · 12mo
- Down + closing
- —
- Monthly P&I
- —
- Monthly cashflow
- —
- DSCR
- —
- Eligible?
- —
Short-term bridge; refi at stabilization.
Rent comps 23 comps
| Address | Beds | Baths | Sqft | Rent | $/sqft | DOM | Units | Dist |
|---|---|---|---|---|---|---|---|---|
| 610 Holt Ave Greensboro, NC | 2.0 | 1.0 | 1092 | $1,300 | $1.19 | 16d | 1 | 0.20mi |
| 703 Sykes Ave Greensboro, NC | 2.0 | 1.0 | 923 | $1,295 | $1.40 | 25d | 1 | 0.20mi |
| 810 Elwell Ave Greensboro, NC | 3.0 | 2.0 | 1280 | $1,500 | $1.17 | 16d | 1 | 0.37mi |
| 309 Holt Ave Greensboro, NC | 2.0 | 1.0 | 1000 | $1,175 | $1.18 | 25d | 1 | 0.47mi |
| 1608 McPherson St Greensboro, NC | 3.0 | 2.0 | 1100 | $1,450 | $1.32 | 25d | 1 | 0.48mi |
| 1508 Tucker St Greensboro, NC | 2.0 | 2.0 | 875 | $1,195 | $1.37 | 25d | 1 | 0.77mi |
| 311 Guerrant St Greensboro, NC | 3.0 | 1.0 | 1025 | $1,295 | $1.26 | 25d | 1 | 0.79mi |
| 1604 Textile Dr Greensboro, NC | 2.0 | 1.0 | 930 | $1,245 | $1.34 | 25d | 1 | 0.79mi |
| 4214 Kildare Dr Greensboro, NC | 3.0 | 1.5 | 1329 | $1,450 | $1.09 | 25d | 1 | 0.80mi |
| 3817 Central Ave Greensboro, NC | 4.0 | 2.0 | 1200 | $1,740 | $1.45 | 16d | 1 | 0.93mi |
| 8 Kings Forest Ct Greensboro, NC | 3.0 | 2.0 | 1120 | $1,650 | $1.47 | 25d | 1 | 0.93mi |
| 4302 Belfield Dr Greensboro, NC | 3.0 | 2.0 | 1300 | $1,755 | $1.35 | 25d | 1 | 0.96mi |
| 3900 Hahns Ln Greensboro, NC | 2.0 | 1.0 | 880 | $955 | $1.09 | 16d | 8 | 0.98mi |
| 110 S Raleigh St Greensboro, NC | 3.0 | 1.0 | 1000 | $1,200 | $1.20 | 25d | 1 | 1.08mi |
| 112 S Raleigh St Greensboro, NC | 3.0 | 1.0 | 1000 | $1,200 | $1.20 | 25d | 1 | 1.08mi |
| 308 Oferrell St Greensboro, NC | 4.0 | 2.5 | 1762 | $1,895 | $1.08 | 25d | 1 | 1.09mi |
| 306 Murraylane Rd Greensboro, NC | 3.0 | 2.0 | 1330 | $1,815 | $1.36 | 16d | 1 | 1.15mi |
| 4014 Mountainridge Dr Greensboro, NC | 4.0 | 2.5 | 1445 | $1,795 | $1.24 | 21d | 1 | 1.23mi |
| 4020 Mountainridge Dr Greensboro, NC | 4.0 | 2.5 | 1500 | $1,825 | $1.22 | 25d | 1 | 1.25mi |
| 201 Huffman St Greensboro, NC | 3.0 | 2.0 | 1350 | $1,000 | $0.74 | 16d | 1 | 1.26mi |
| 507 Menlo Park Rd Greensboro, NC | 4.0 | 2.5 | 1767 | $1,919 | $1.09 | 23d | 1 | 1.27mi |
| 1724 Kay St Greensboro, NC | 3.0 | 2.0 | 1332 | $1,600 | $1.20 | 23d | 1 | 1.28mi |
| 1608 Kay St Greensboro, NC | 3.0 | 2.0 | 1184 | $1,525 | $1.29 | 25d | 1 | 1.28mi |
Listing history 16 events
-
2026-06-18status $185,000 Pending 55 DOM
-
2026-06-17days on market $185,000 Due Diligence Period 55 DOM
-
2026-06-16days on market $185,000 Due Diligence Period 54 DOM
-
2026-06-15days on market $185,000 Due Diligence Period 53 DOM
-
2026-06-14days on market $185,000 Due Diligence Period 51 DOM
-
2026-06-10days on market $185,000 Due Diligence Period 48 DOM
-
2026-06-09days on market $185,000 Due Diligence Period 47 DOM
-
2026-06-08days on market $185,000 Due Diligence Period 46 DOM
-
2026-06-07days on market $185,000 Due Diligence Period 45 DOM
-
2026-06-03days on market $185,000 Due Diligence Period 41 DOM
-
2026-06-02days on market $185,000 Due Diligence Period 40 DOM
-
2026-06-01days on market $185,000 Due Diligence Period 39 DOM
-
2026-05-31days on market $185,000 Due Diligence Period 38 DOM
-
2026-05-31days on market $185,000 Due Diligence Period 37 DOM
-
2026-04-23$185,000 Active
-
1985-09-01soldstatus $53,000
ⓘ Source: listings_history table (triggers on properties + properties_extension) + one-shot
backfill from property_details.listing_events for pre-trigger history.
Tax reassessment forecast NC · Resets to sale price
- Current annual tax
- $646 · $54/mo
- Projected year-2 tax
- $1,517 · $126/mo
- Expected delta
- +$871/yr (+$73/mo · 134.9%)
ⓘ Screening estimate from a state-policy table — verify with the county assessor before closing.
Climate risk First Street
- Flood 1/10 Low FEMA zone X (unshaded) · 0% chance over 30 yrs
- Wildfire 1/10 Low
- Heat 5/10 Major 7 d/yr ≥103°F today · 17 d/yr by 30 yrs out
- Wind 4/10 Moderate 15% chance of damaging wind over 30 yrs
- Air quality 2/10 Low 1 unhealthy d/yr today · 2 by 30 yrs out
Nearby sold comps map
Loading sold comps map…
Walkable amenities ~0.75 mi
Loading nearby amenities…
Taxation est. · year 1
- Rental income
- $17,794
- − Mortgage interest
- −$10,363
- − Property taxes
- −$646
- − Insurance
- −$925
- − Repairs & maintenance
- −$1,424
- − Management
- −$1,424
- − Depreciation
- −$5,382
- Taxable loss
- −$2,369
- Est. tax savings @ 24.0%
- +$568
- After-tax cash flow
- $1,413/yr
For passive investors: Depreciation is non-cash, so a rental often shows a tax loss while cash-flowing — sheltering income. Rental losses are passive: they offset passive income freely, and up to $25,000/yr can offset ordinary (W-2) income if you actively participate and your MAGI is under $100k (phasing out to $0 by $150k); unused losses carry forward. On sale, claimed depreciation is recaptured at up to 25%, and gains may owe capital-gains tax (a 1031 exchange can defer both). Figures are a year-1 estimate at your 24.0% rate — not tax advice; consult a CPA.
Schools (NCES district)
- District
- Guilford County Schools
- NCES district ID
- 3701920
- Math proficiency
- 39% ▲ 1.00%
- Reading proficiency
- 45% ▲ 1.00%
- Median HH income
- $46,315
- Composite
- 35.78/100
- National rank
- #4842
- State rank
- #99 of 178 in NC
Livability — Greensboro
- Score
- 81/100
- State rank
- #12
- US rank
- #1335
Category grades
Schools grade is shown separately in the Schools card above.
Census & demographics
- Census place
- Greensboro, NC
- County
- Guilford County · 487,190 people
- City population
- 329,421
- Metro
- Greensboro-High Point, NC
- Population (ZIP)
- 54,303
- Household income
- $47,431
- Rent vs Own
- Severe rent burden
- 2517.0
Population outlook (Guilford County) Hauer SSP2
- Today (2025)
- 584,596 people
- By 2030
- 616,851 · +5.5%
- By 2040
- 678,451 · +16.1%
- By 2050
- 734,788 · +25.7%
- By 2075
- 862,985 · +47.6%
- By 2100
- 948,704 · +62.3%
Race, ethnicity, and origin ACS 2023
- Neighborhood character
- Diverse neighborhood (Simpson 0.62)
- Race & ethnicity
- Black 57% White 20% Hispanic / Latino 14% Two or more races 7% Asian 4%
- Hispanic origin (detail)
- Mexican 9% Puerto Rican 2%
- Common ancestry
- Romanian 1% Ukrainian 1% Italian 1%
- Foreign-born
- 15% · Canada, Vietnam, China
- Languages at home
- 79% English-only · Spanish 11% Other Asian/Pacific 2% Other Indo-European 1%
Political lean MEDSL · Guilford
- 2024 margin
- Strong D (+21.8) · D 60.2% · R 38.4% · Other 1.4%
- 2008→2024 swing
- +3.5pp toward D · 2008: 18.4pp · 2024: 21.8pp
- All cycles
- 2024: D+21.8 2020: D+23.1 2016: D+20.0 2012: D+16.5 2008: D+18.4
Not yet ingested
- Civics
- —
Market trends
- HPI YoY
- ▼ -63.02%
- Current HPI
- 243.1261
- Rent YoY
- ▲ 3.83%
- Metro
- Greensboro-High Point, NC
- State GDP YoY
- ▲ 3.28%
- F500 in state
- 26
Industry mix (Fortune 500 HQ in NC)
| Industry | F500 HQs | Revenue |
|---|---|---|
| Financial Services | 2 | $213B |
|
||
| Retail | 2 | $95B |
|
||
| Industrial Conglomerate | 1 | $38B |
|
||
| Metals / Steel | 1 | $35B |
|
||
| Utilities | 1 | $30B |
|
||
| Industrial Machinery | 1 | $19B |
|
||
Price history
+249.1% since first listed2 events — show timeline
- 2026-04-23 Listed $185,000 Triad MLS
- 1985-09-01 Sold (Public Records) $53,000 Public Records
Property tax history
-5.9%/yrLatest (2025): $646 · -1.0% YoY. Source: county tax records.
Cash-flow waterfall
monthlySold comps — $/sqft
last 12 mo · ≤1 miLoading sold comps…