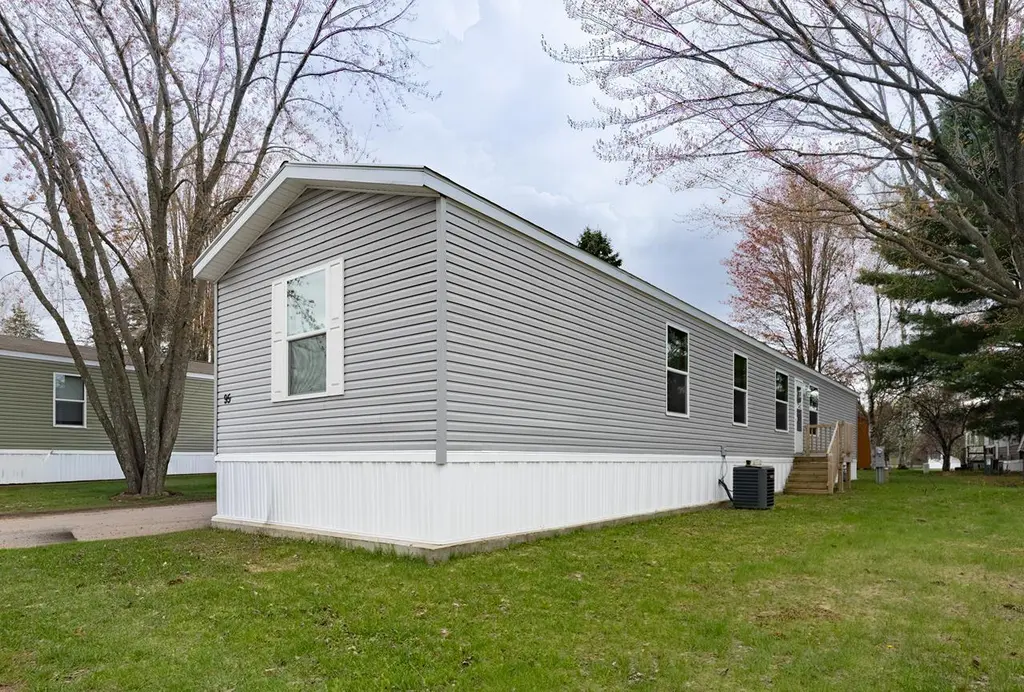
6300 Birch St #95 · Weston, WI
Flood risk No data
- FEMA flood zone
- —
- Chance of flooding over 30 yrs
- —
- Est. flood insurance / yr
- —
Fire risk No data
- Est. fire insurance / yr
- —
Heat risk No data
- Hot days now (above threshold)
- —
- Hot days in 30 yrs
- —
Wind risk No data
- Chance of severe wind over 30 yrs
- —
Air-quality risk No data
- Unhealthy air days now
- —
- Unhealthy air days in 30 yrs
- —
Risk factors via First Street. Map © Google.
Why this score? — see what drove the B- grade
The composite is a weighted blend of 9 inputs, each scored 0–100. Each bar is that input's sub-score; the figure is the points it added to the 100-point composite (weight × sub-score).
- Cash flow +30.0/30.0
- 1% rule +10.0/10.0
- DSCR +10.0/10.0
- ARV discount +7.5/15.0
- Livability +3.6/5.0
- Schools +3.4/10.0
- Rent growth +2.5/5.0
- Condition / age +2.2/5.0
- Appreciation +0.0/10.0
$70,000
🖨 Deal sheet 📄 Offer letter ✓ Due diligence
Listing remarks
This 2022 Champion mobile home is located in Colonial Gardens within the DC Everest School District. It has an open concept layout with modern finishes. The kitchen is spacious with an 8 ft. 2 in. x 3 ft. 4 in. island providing generous counter seating and prep space. The split bedroom design places the primary suite to the rear, complete with a private bath and a dedicated laundry room nearby. On the opposite side, you?ll find two additional bedrooms and a full bath. Appliances including the refrigerator, range/oven, microwave, dishwasher, washer, and dryer are all included, along with a 12x12 shed for added storage. A well-maintained home with efficient use of space and everyday convenien
Key facts
- Private bath
- Spacious kitchen
- Modern finishes
Tags
Property features AI
Finance
- Other: Located in the village of Weston
Exterior
- Utilities: Municipal water; Municipal sewer
- Home design: Single-family home; Estimated finished living area about 1,216
- Construction: Shingle roof; Built on slab
- Exterior features: Lot smaller than 1/2 acre
Interior
- Kitchen: Refrigerator; Range/Oven; Dishwasher; Microwave
- Bedrooms: Master bedroom on the main level; Bedroom 2 on the main level; Bedroom 3 on the main level
- Bathrooms: 2 full bathrooms
- Interior features: No basement (slab foundation)
- Laundry & utility: Washer; Dryer
Neighborhood map
What this means for you Summary
Snapshot
- This is a 3-bed/2.0-bath single-family listed at $70k. Condition is rated fair.
Deal economics
- At list price, monthly cash flow is $711 ($9k/yr) — positive.
- The deal already cash-flows at list — no discount required.
- Meets the 1% rule at list price ($2k rent vs $70k).
- Recommended offer: $68k (3.0% below list) — sets the bar for market timing.
- Cap rate 18.5% vs local median 1.7% in Weston — top-decile yield for the area; either an underpriced asset or a hidden risk that comps aren't pricing in. Stress-test before assuming the spread holds.
Location & tenants
- Location reads 71/100 on livability (#263 in WI) — a middle-class / working-renter tenant base. Strengths: cost of living A+, housing A+, employment A-; Watch: health & safety D, amenities F, commute F.
- D C Everest Area School District (suburban): math 37% / reading 40% proficiency, ranked #160 of 342 in WI (top 47%) — families likely to look elsewhere, expect single-tenant / working-renter base with shorter leases.
- Zoned schools: D C Everest High (math 25% / reading 33%, grade F, #253 of 483 statewide, top 52%, 1,311 students, 33% FRL).
- Market conditions: 68 active listings in the ZIP; 1 comparable units currently listed for rent nearby; solid renter incomes; 298 units permitted in Marathon County in 2024 (81 in 5+ unit buildings).
Forward outlook
- Local home prices are declining (-3.0%/yr); year-one equity from $484 of loan paydown is wiped out by about $2k of value loss. Plan a longer hold.
- Marathon County population projected to shrink 6% by 2050 — rents likely to lag national; underwrite the cash flow, not the appreciation.
- At projected returns (-3.0% appreciation + 3.0% rent growth), your $20k cash investment doubles in ~3 years — after that, you're playing with house money.
Negotiation context
- It's been on market 43 days — a 3% lower offer ($68k) is reasonable based on typical stale-listing flexibility.
Questions for the listing agent
- It's been on market 43 days. Have you received any prior offers? Is the seller open to a 3% concession, seller financing, or rate buy-down credit?
- Have any recent inspections been done? Can we get a copy of the seller's disclosures and any deferred-maintenance estimates?
- Is there a deadline driving the sale (1031 exchange, divorce, estate, relocation)? That informs how much negotiation room exists.
- Schools are D-rated, which usually means shorter tenancies and higher turnover. Who's the typical renter profile here, and what's been the actual vacancy rate?
- What's the average days-on-market for RENTAL listings here right now (not sales)? A rising rental-DOM trend means longer vacancies and softer asking-rent achievability than the comps imply.
- What's the recent tenant-quality profile in this submarket — average credit score on applications, eviction rate, late-payment / NSF rate, and stable-employment percentage? A property-management company in the area should have these aggregated.
- How much new for-sale + rental construction is in the pipeline within 1–3 miles? Heavy new supply typically softens prices + rents 12–24 months out; constrained supply supports both.
Investment metrics
- 1% rule
- 2.16% ✓
- Cap rate
- 18.48%
- Cash-on-cash
- 43.52%
- DSCR
- 2.94
- GRM
- 3.9
CMA / ARV
- ARV (on-the-fly)
- $233,472
- Comps found
- 6
Show comp detail 6 sales within ~0.75 mi
| Address | Dist | Beds/Ba | Sqft | Sold | Price | $/sf | Match |
|---|---|---|---|---|---|---|---|
| 6512 Birch St | 0.18mi | 3/1.5 | 1,324 (+9%) | 14mo | $134,000 | $101 | 63 |
| 4109 Douglas Ln | 0.41mi | 3/2.0 | 1,300 (+7%) | 20mo | $229,900 | $177 | 53 |
| 6211 Rodney St | 0.54mi | 3/1.5 | 1,248 (+3%) | 22mo | $165,000 | $132 | 50 |
| 7202 Birch St | 0.53mi | 3/1.0 | 1,092 (-10%) | 8mo | $210,000 | $192 | 48 |
| 2810 Joseph Ave | 0.49mi | 2/1.0 (-1) | 1,104 (-9%) | 8mo | $215,000 | $195 | 46 |
| 2916 Norma Ave | 0.70mi | 3/1.0 | 1,040 (-14%) | 12mo | $225,000 | $216 | 29 |
Match score weights: distance 35% · size 25% · config 20% · recency 20%. Top-matched comps best support the ARV.
Projected returns pro-forma
-3.0% appreciation · 3.0% rent growth · sell at horizon
- IRR
- 40.4%
- Equity multiple
- 2.73×
- Total profit
- $33,956
- Equity at exit
- $10,437
- IRR
- 46.7%
- Equity multiple
- 5.49×
- Total profit
- $87,962
- Equity at exit
- $6,052
Cash invested: $19,600 (down + closing). Projections, not guarantees.
Landlord ↔ Tenant lean methodology
- Overall (STATE)
- 73 Landlord-Friendly
- State Wisconsin
- 73 Landlord-Friendly · R+2
- County
- — inherits STATE
- City
- — inherits STATE
ZIP-level market 54476
- Home prices YoY
- -33.7%
- Active inventory
- 68
- Price-to-rent
- 3.9×
Monthly cashflow live
- Estimated rent
- $1,512 medium interval (Pro) →
- Mortgage (P&I)
- −$367
- Tax est. 1.5%
- −$88 /mo · $1,050/yr
- Insurance
- −$29
- HOA
- −$0
- Vacancy / Maint / Mgmt
- −$318
- Net cashflow
- $711
Break-even live
UW: 25.0% down · 7.5% · 30yr · 1.5% tax · 5.0% vac · 8.0% maint · 8.0% mgmt
Financing live
Cash to close
- Down payment
- $17,500
- Closing costs
- $2,100
- Reserves months
- —
- Total cash needed
- —
Loan-product check · same deal, 3 products live
Conventional
25% down · 7.5% · 30yr
- Down + closing
- —
- Monthly P&I
- —
- Monthly cashflow
- —
- DSCR
- —
- Eligible?
- —
Personal DTI + credit; lowest rate.
DSCR
20% down · 8.5% · 30yr
- Down + closing
- —
- Monthly P&I
- —
- Monthly cashflow
- —
- DSCR
- —
- Eligible?
- —
No personal income docs; deal must DSCR.
Hard money
10% down · 12.0% · 12mo
- Down + closing
- —
- Monthly P&I
- —
- Monthly cashflow
- —
- DSCR
- —
- Eligible?
- —
Short-term bridge; refi at stabilization.
Rent comps 1 comps
| Address | Beds | Baths | Sqft | Rent | $/sqft | DOM | Units | Dist |
|---|---|---|---|---|---|---|---|---|
| 6001 Alderson St Schofield, WI | 3.0 | 1.0 | 582 | $2,275 | $3.91 | 43d | 5 | 0.58mi |
Listing history 17 events
-
2026-06-19days on market $70,000 Active 43 DOM
-
2026-06-18days on market $70,000 Active 42 DOM
-
2026-06-17days on market $70,000 Active 41 DOM
-
2026-06-16days on market $70,000 Active 40 DOM
-
2026-06-15days on market $70,000 Active 39 DOM
-
2026-06-14days on market $70,000 Active 37 DOM
-
2026-06-13days on market $70,000 Active 36 DOM
-
2026-06-10days on market $70,000 Active 34 DOM
-
2026-06-09days on market $70,000 Active 33 DOM
-
2026-06-08days on market $70,000 Active 32 DOM
-
2026-06-07days on market $70,000 Active 31 DOM
-
2026-06-05days on market $70,000 Active 28 DOM
-
2026-06-02pricedays on market $70,000 Active 26 DOM
-
2026-06-01days on market $74,000 Active 25 DOM
-
2026-05-31days on market $74,000 Active 24 DOM
-
2026-05-30days on market $74,000 Active 23 DOM
-
2026-05-07$74,000 Active
ⓘ Source: listings_history table (triggers on properties + properties_extension) + one-shot
backfill from property_details.listing_events for pre-trigger history.
Nearby sold comps map
Loading sold comps map…
Walkable amenities ~0.75 mi
Loading nearby amenities…
Taxation est. · year 1
- Rental income
- $18,146
- − Mortgage interest
- −$3,921
- − Property taxes
- −$1,050
- − Insurance
- −$350
- − Repairs & maintenance
- −$1,452
- − Management
- −$1,452
- − Depreciation
- −$2,036
- Taxable income
- $7,886
- Est. tax owed @ 24.0%
- −$1,893
- After-tax cash flow
- $6,638/yr
For passive investors: Depreciation is non-cash, so a rental often shows a tax loss while cash-flowing — sheltering income. Rental losses are passive: they offset passive income freely, and up to $25,000/yr can offset ordinary (W-2) income if you actively participate and your MAGI is under $100k (phasing out to $0 by $150k); unused losses carry forward. On sale, claimed depreciation is recaptured at up to 25%, and gains may owe capital-gains tax (a 1031 exchange can defer both). Figures are a year-1 estimate at your 24.0% rate — not tax advice; consult a CPA.
Condition & rehab AI · 12 photos
This mobile home requires moderate repairs and maintenance to improve its condition and value. Painting the interior walls and landscaping can significantly enhance its appeal.
Repairs flagged
- Minor Paint — Interior walls show signs of wear
- Minor Flooring — Hardwood flooring appears to be in good condition
- Minor Kitchen cabinets — Cabinets appear functional
- Minor Bathrooms — Bathrooms appear functional but show signs of wear
- Minor HVAC system — No visible damage to HVAC system
Value-add opportunities
- Resale Paint interior walls — Fresh paint can improve the home's appearance and value
- Rental Landscaping — Well-maintained landscaping can attract tenants and increase rental value
Renovation cost estimate screening
| Repair item | Severity | Est. cost |
|---|---|---|
| Paint · Interior walls show signs of wear | Minor | $500–3,000 |
| Flooring · Hardwood flooring appears to be in good condition | Minor | $500–3,000 |
| Kitchen cabinets · Cabinets appear functional | Minor | $500–3,000 |
| Bathrooms · Bathrooms appear functional but show signs of wear | Minor | $500–3,000 |
| HVAC system · No visible damage to HVAC system | Minor | $500–3,000 |
| Total estimated repair cost · 5 items | $2,500–15,000 |
Value-add ROI direction
- Resale Paint interior walls — Fresh paint can improve the home's appearance and value ↑
- Rental Landscaping — Well-maintained landscaping can attract tenants and increase rental value ↑
ⓘ Cost ranges are severity-bucket heuristics (US national rule-of-thumb). Get contractor quotes + a written scope before underwriting a rehab budget.
Schools (NCES district)
- District
- D C Everest Area School District
- NCES district ID
- 5513170
- Math proficiency
- 37% ▼ -5.00%
- Reading proficiency
- 40% ▼ -2.00%
- Median HH income
- $59,328
- Composite
- 34.14/100
- National rank
- #5284
- State rank
- #160 of 342 in WI
Livability — Weston
- Score
- 71/100
- State rank
- #263
- US rank
- #6727
Category grades
Schools grade is shown separately in the Schools card above.
Census & demographics
- Census place
- Weston, WI
- County
- Marathon County · 76,019 people
- City population
- 19,377
- Metro
- Wausau-Weston, WI
- Population (ZIP)
- 19,377
- Household income
- $78,079
- Rent vs Own
- Severe rent burden
- 493.0
Population outlook (Marathon County) Hauer SSP2
- Today (2025)
- 138,030 people
- By 2030
- 138,087 · +0.0%
- By 2040
- 135,688 · -1.7%
- By 2050
- 129,390 · -6.3%
- By 2075
- 110,912 · -19.6%
- By 2100
- 85,136 · -38.3%
Race, ethnicity, and origin ACS 2023
- Neighborhood character
- Predominantly White (84%)
- Race & ethnicity
- White 84% Asian 9% Two or more races 5% Hispanic / Latino 2% Black 2%
- Common ancestry
- Romanian 18% Portuguese 5% Iranian 2%
- Foreign-born
- 6% · Canada, China
- Languages at home
- 93% English-only · Other Asian/Pacific 3% Other Indo-European 2% Spanish 1%
Political lean MEDSL · Marathon
- 2024 margin
- R (+18.7) · D 40.1% · R 58.7% · Other 1.2%
- 2008→2024 swing
- -27.5pp toward R · 2008: 8.9pp · 2024: -18.7pp
- All cycles
- 2024: R+18.7 2020: R+18.0 2016: R+18.2 2012: R+6.1 2008: D+8.9
Not yet ingested
- Civics
- —
Market trends
- HPI YoY
- ▼ -105.33%
- Current HPI
- 206.859
- Rent YoY
- —
- Metro
- Wausau-Weston, WI
- State GDP YoY
- ▲ 2.10%
- F500 in state
- 20
Industry mix (Fortune 500 HQ in WI)
| Industry | F500 HQs | Revenue |
|---|---|---|
| Industrial Machinery | 4 | $23B |
|
||
| Industrial Technology | 2 | $36B |
|
||
| Insurance | 1 | $36B |
|
||
| Professional Services | 1 | $19B |
|
||
| Utilities | 1 | $9B |
|
||
| Consumer Goods | 1 | $3B |
|
||
Price history
1 event — show timeline
- 2026-05-07 Listed $74,000 CWMLS
Cash-flow waterfall
monthlySold comps — $/sqft
last 12 mo · ≤1 miLoading sold comps…