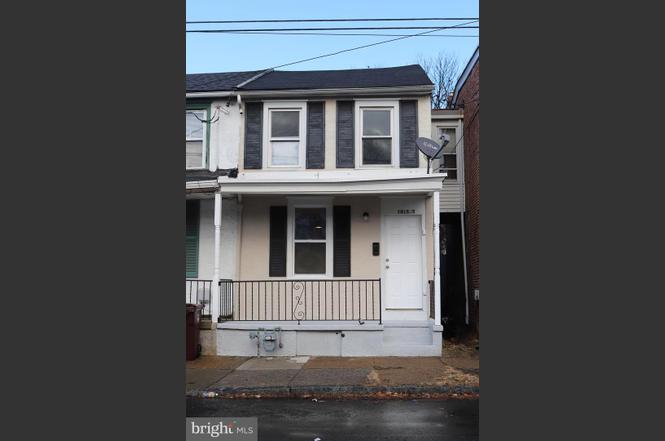
1015-1/2 Linden St · Wilmington, DE
Flood risk 5/10 · Moderate
- FEMA flood zone
- X (unshaded)
- Chance of flooding over 30 yrs
- 0.67%
- Est. flood insurance / yr
- $473 – $860
Fire risk 1/10 · Minimal
- Est. fire insurance / yr
- $476 – $884
Heat risk 8/10 · Major
- Hot days now (above 103°F)
- 7 days/yr
- Hot days in 30 yrs
- 16 days/yr
Wind risk 6/10 · Moderate
- Chance of severe wind over 30 yrs
- 27.0%
Air-quality risk 3/10 · Minor
- Unhealthy air days now
- 3 days/yr
- Unhealthy air days in 30 yrs
- 4 days/yr
Risk factors via First Street. Map © Google.
Why this score? — see what drove the C+ grade
The composite is a weighted blend of 9 inputs, each scored 0–100. Each bar is that input's sub-score; the figure is the points it added to the 100-point composite (weight × sub-score).
- Cash flow +28.1/30.0
- DSCR +10.0/10.0
- 1% rule +7.7/10.0
- ARV discount +4.7/15.0
- Rent growth +4.1/5.0
- Livability +3.2/5.0
- Schools +2.5/10.0
- Condition / age +2.5/5.0
- Appreciation +0.0/10.0
$129,999
🖨 Deal sheet (PDF) 📄 Offer letter ✓ Due diligence
Listing remarks
Property is currently tenant occupied. This property is being rented out for $1500 per month. This property is ideal for an instant cash flowing rental. Discover the perfect blend of cozy living and modern convenience in this fully renovated 2-bedroom, 1-bathroom home nestled in the heart of Wilmington. Key Features: Efficient Design: Embrace a smart use of space with an efficient floor plan that maximizes every square foot for comfortable living. Modern Kitchen: The recently updated kitchen features all-new appliances and contemporary finishes, providing a stylish and functional space for your culinary endeavors. Updated Bathroom: Enjoy the convenience of a modern bathroom with updated fix
Key facts
- Efficient floor plan
- Convenient location
- Modern kitchen
Tags
Neighborhood map
What this means for you Summary
Snapshot
- This is a 2-bed/1.0-bath townhouse listed at $130k.
Deal economics
- At list price, monthly cash flow is $407 ($5k/yr) — positive.
- The deal already cash-flows at list — no discount required.
- Meets the 1% rule at list price ($2k rent vs $130k).
- Recommended offer: $122k (6.0% below list) — sets the bar for market timing.
- Cap rate 10.1% vs local median 5.6% in Wilmington — top-decile yield for the area; either an underpriced asset or a hidden risk that comps aren't pricing in. Stress-test before assuming the spread holds.
Location & tenants
- Location reads 64/100 on livability (#52 in DE) — a middle-class / working-renter tenant base. Strengths: cost of living A+, housing A; Watch: employment D+, schools D, commute D.
- Christina School District (suburban): math 22% / reading 33% proficiency, ranked #18 of 26 in DE (top 69%) — low school quality limits family demand, transient renter base, plan for 1-2y turnover.
- Market conditions: Rents rising fast (+6.3%/yr); 168 active listings in the ZIP; 40 comparable units currently listed for rent nearby; rentals at typical pace (median 21d on market — plan ~3-4 weeks tenant-placement turnaround); 1,367 units permitted in New Castle County in 2024 (201 in 5+ unit buildings).
- This rent runs 33% of the median local income ($60k/yr) — at the standard rent-burdened threshold; future hikes will face affordability resistance.
Forward outlook
- Local home prices are declining (-3.0%/yr); year-one equity from $899 of loan paydown is wiped out by about $4k of value loss. Plan a longer hold.
- New Castle County population projected at +9% by 2050 — modest demand growth; plan on rents tracking national, not racing it.
- At projected returns (-3.0% appreciation + 6.3% rent growth), your $36k cash investment doubles in ~7 years — after that, you're playing with house money.
Negotiation context
- It's been on market 62 days — a 6% lower offer ($122k) is reasonable based on typical stale-listing flexibility.
- 5 sale attempts since 3y ago with the ask held roughly flat each time — persistent listings suggest the price (not the market) is what's stuck; bring a comps-based counter.
Risks & watch-outs
- Watch-outs: built in 1900 — expect roof / HVAC / electrical / plumbing capex.
- Climate carrying-cost: moderate flood risk; major wind risk, 27% chance of damaging wind over 30y; extreme-heat days projected 7→16/yr by 2055 (HVAC capex compounding) — expect insurance premiums to compound above CPI over the hold.
Questions for the listing agent
- It's been on market 62 days. Have you received any prior offers? Is the seller open to a 6% concession, seller financing, or rate buy-down credit?
- Built in 1900 — when were the roof, HVAC, electrical panel, plumbing, and water heater last replaced?
- Why hasn't it sold? Are there any deal-killer items the seller is aware of (foundation, flood, title, zoning, code violations)?
- Is there a deadline driving the sale (1031 exchange, divorce, estate, relocation)? That informs how much negotiation room exists.
- Schools are D-rated, which usually means shorter tenancies and higher turnover. Who's the typical renter profile here, and what's been the actual vacancy rate?
- Crime grade is F in this area — have there been break-ins, vandalism, or insurance claims at this property in the last 3 years? What carrier currently insures it and at what premium?
- What's the average days-on-market for RENTAL listings here right now (not sales)? A rising rental-DOM trend means longer vacancies and softer asking-rent achievability than the comps imply.
- What's the recent tenant-quality profile in this submarket — average credit score on applications, eviction rate, late-payment / NSF rate, and stable-employment percentage? A property-management company in the area should have these aggregated.
- How much new for-sale + rental construction is in the pipeline within 1–3 miles? Heavy new supply typically softens prices + rents 12–24 months out; constrained supply supports both.
Investment metrics
- 1% rule
- 1.27% ✓
- Cap rate
- 10.05%
- Cash-on-cash
- 13.43%
- DSCR
- 1.60
- GRM
- 6.6
CMA / ARV
- ARV (on-the-fly)
- $122,400
- Comps found
- 12
Show comp detail 12 sales within ~0.75 mi
| Address | Dist | Beds/Ba | Sqft | Sold | Price | $/sf | Match |
|---|---|---|---|---|---|---|---|
| 4 Lower Oak St | 0.24mi | 2/1.0 | 850 (0%) | 1mo | $112,500 | $132 | 88 |
| 2 Lower Oak St | 0.24mi | 2/1.5 | 850 (0%) | 1mo | $112,500 | $132 | 86 |
| 11 Cedar St | 0.35mi | 2/1.0 | 875 (+3%) | 4mo | $110,000 | $126 | 75 |
| 908 Marshall St | 0.36mi | 2/1.0 | 775 (-9%) | 1mo | $95,000 | $123 | 68 |
| 117 N Dupont St | 0.52mi | 2/1.0 | 875 (+3%) | 5mo | $138,000 | $158 | 67 |
| 1317 Chestnut St | 0.20mi | 2/1.5 | 950 (+12%) | 5mo | $85,000 | $89 | 64 |
| 530 Harlan Blvd #510 | 0.39mi | 1/1.0 (-1) | 912 (+7%) | 1mo | $282,500 | $310 | 64 |
| 105 Christina Lndg #704 | 0.64mi | 1/1.0 (-1) | 825 (-3%) | 1mo | $225,000 | $273 | 60 |
| 210 Lower Oak St | 0.33mi | 2/1.0 | 960 (+13%) | 4mo | $154,000 | $160 | 59 |
| 105-Unit Christina Lndg #307 | 0.64mi | 1/1.0 (-1) | 825 (-3%) | 2mo | $225,000 | $273 | 58 |
| 918 Wright St | 0.42mi | 2/1.0 | 975 (+15%) | 1mo | $125,000 | $128 | 55 |
| 1409 W 4th St | 0.46mi | 3/1.0 (+1) | 975 (+15%) | 5mo | $140,000 | $144 | 45 |
Match score weights: distance 35% · size 25% · config 20% · recency 20%. Top-matched comps best support the ARV.
Projected returns pro-forma
-3.0% appreciation · 6.35% rent growth · sell at horizon
- IRR
- 7.2%
- Equity multiple
- 1.29×
- Total profit
- $10,663
- Equity at exit
- $19,383
- IRR
- 19.3%
- Equity multiple
- 2.87×
- Total profit
- $68,110
- Equity at exit
- $11,240
Cash invested: $36,400 (down + closing). Projections, not guarantees.
Landlord ↔ Tenant lean methodology
- Overall (STATE)
- 70 Landlord-Friendly
- State Delaware
- 70 Landlord-Friendly · D+7
- County
- — inherits STATE
- City
- — inherits STATE
ZIP-level market 19805
- Rents YoY
- 6.3%
- Active inventory
- 168
- Price-to-rent
- 6.6×
Monthly cashflow live
- Estimated rent
- $1,653 high interval (Pro) →
- Mortgage (P&I)
- −$682
- Tax est. 1.5%
- −$162 /mo · $1,950/yr
- Insurance
- −$54
- HOA
- −$0
- Vacancy / Maint / Mgmt
- −$347
- Net cashflow
- $407
Break-even live
Sensitivity live
| Price | -10% $497 | -5% $452 | +0% $407 | +5% $362 | +10% $318 |
|---|---|---|---|---|---|
| Rent | -10% $277 | -5% $342 | +0% $407 | +5% $473 | +10% $538 |
| Rate | -1.0pp $473 | -0.5pp $440 | base $407 | +0.5pp $374 | +1.0pp $339 |
UW: 25.0% down · 7.5% · 30yr · 1.5% tax · 5.0% vac · 8.0% maint · 8.0% mgmt
Financing live
Cash to close
- Down payment
- $32,500
- Closing costs
- $3,900
- Reserves months
- —
- Total cash needed
- —
Loan-product check · same deal, 3 products live
Conventional
25% down · 7.5% · 30yr
- Down + closing
- —
- Monthly P&I
- —
- Monthly cashflow
- —
- DSCR
- —
- Eligible?
- —
Personal DTI + credit; lowest rate.
DSCR
20% down · 8.5% · 30yr
- Down + closing
- —
- Monthly P&I
- —
- Monthly cashflow
- —
- DSCR
- —
- Eligible?
- —
No personal income docs; deal must DSCR.
Hard money
10% down · 12.0% · 12mo
- Down + closing
- —
- Monthly P&I
- —
- Monthly cashflow
- —
- DSCR
- —
- Eligible?
- —
Short-term bridge; refi at stabilization.
Rent comps 40 comps
| Address | Beds | Baths | Sqft | Rent | $/sqft | DOM | Units | Dist |
|---|---|---|---|---|---|---|---|---|
| 1227 Linden St Wilmington, DE | 3.0 | 2.0 | 950 | $1,850 | $1.95 | 4d | 1 | 0.12mi |
| 1110 Read St Wilmington, DE | 2.0 | 1.0 | 1100 | $1,250 | $1.14 | 21d | 1 | 0.14mi |
| 1114 Lancaster Ave Wilmington, DE | 2.0 | 1.0 | 775 | $1,400 | $1.81 | 25d | 1 | 0.17mi |
| 128 Lower Oak St Wilmington, DE | 2.0 | 1.0 | 871 | $1,595 | $1.83 | 0d | 1 | 0.28mi |
| 331 Justison St Wilmington, DE | 1.0–2.0 | 1.0–2.0 | 859 | $2,205 | $2.57 | 0d | 9 | 0.34mi |
| 401 Justison St Wilmington, DE | 1.0 | 1.0 | 787 | $1,855 | $2.36 | 0d | 13 | 0.37mi |
| 231 5th Ave Wilmington, DE | 2.0 | 1.0 | 1050 | $1,350 | $1.29 | 44d | 1 | 0.46mi |
| 1401 Maryland Ave Wilmington, DE | 1.0 | 1.0 | 612 | $1,275 | $2.08 | 44d | 1 | 0.47mi |
| 207 S DuPont St Wilmington, DE | 1.0 | 1.5 | 1000 | $1,495 | $1.50 | 19d | 1 | 0.48mi |
| 507 W 4th St Wilmington, DE | 3.0 | 1.5 | 1075 | $1,800 | $1.67 | 13d | 1 | 0.52mi |
| 101 Avenue of the Arts Wilmington, DE | 1.0 | 1.0 | 726 | $2,195 | $3.02 | 2d | 3 | 0.52mi |
| 820 W 7th St Wilmington, DE | 3.0 | 1.0 | 1000 | $1,650 | $1.65 | 44d | 1 | 0.55mi |
| 1215 W 7th St Apt 1 Wilmington, DE | 1.0 | 1.0 | 1000 | $1,275 | $1.27 | 19d | 1 | 0.56mi |
| 617 W 6th St Unit 617 B Wilmington, DE | 3.0 | 1.0 | 1000 | $1,600 | $1.60 | 6d | 1 | 0.57mi |
| 1815 Maple St Wilmington, DE | 3.0 | 1.5 | 1100 | $1,995 | $1.81 | 0d | 1 | 0.58mi |
| 1000 W 8th St Unit 3 Wilmington, DE | 2.0 | 1.0 | 1050 | $1,695 | $1.61 | 25d | 1 | 0.59mi |
| 800 N Adams St Wilmington, DE | 1.0 | 1.0 | 650 | $1,195 | $1.84 | 44d | 1 | 0.63mi |
| 709 Windsor St Unit 3 Wilmington, DE | 2.0 | 1.0 | 980 | $1,500 | $1.53 | 44d | 1 | 0.63mi |
| 600 N Washington St Wilmington, DE | 1.0 | 1.0 | 700 | $1,275 | $1.82 | 44d | 1 | 0.64mi |
| 1522 W 7th St Unit 1 Wilmington, DE | 2.0 | 1.0 | 900 | $1,800 | $2.00 | 5d | 1 | 0.64mi |
| 1507 Coleman St Wilmington, DE | 2.0 | 1.0 | 650 | $1,495 | $2.30 | 25d | 1 | 0.64mi |
| 225 W 4th St Unit 2 Wilmington, DE | 2.0 | 1.0 | 1000 | $1,599 | $1.60 | 44d | 1 | 0.64mi |
| 225 W 4th St Unit 1 Wilmington, DE | 1.0 | 1.0 | 750 | $1,399 | $1.87 | 44d | 1 | 0.64mi |
| 517 N West St Wilmington, DE | 1.0 | 1.0 | 646 | $1,295 | $2.00 | 25d | 1 | 0.64mi |
| 711 Windsor St Wilmington, DE | 2.0 | 1.0 | 980 | $1,460 | $1.49 | 44d | 1 | 0.64mi |
| 105 Christina Landing Dr Wilmington, DE | 2.0 | 2.0 | 1025 | $2,400 | $2.34 | 11d | 1 | 0.65mi |
| 105 Christina Landing Dr #1503 Wilmington, DE | 2.0 | 2.0 | 1025 | $2,500 | $2.44 | 17d | 1 | 0.65mi |
| 802 N Broom St Apt 2 Wilmington, DE | 2.0 | 21.0 | 800 | $1,695 | $2.12 | 23d | 1 | 0.66mi |
| 115 Christina Landing Dr Wilmington, DE | 1.0–2.0 | 1.0–2.0 | 1195 | $2,796 | $2.34 | 2d | 13 | 0.68mi |
| 822 N Adams St Wilmington, DE | 1.0 | 1.0 | 650 | $1,225 | $1.88 | 44d | 1 | 0.68mi |
| 219 S Union St Unit B Wilmington, DE | 1.0 | 1.0 | 1075 | $1,150 | $1.07 | 25d | 1 | 0.69mi |
| 210 N Market St Wilmington, DE | 1.0 | 1.0 | 746 | $1,750 | $2.34 | 3d | 6 | 0.70mi |
| 2 W 4th St Wilmington, DE | 1.0 | 1.0 | 623 | $1,908 | $3.06 | 4d | 5 | 0.71mi |
| 1200 W 10th St Apt 3 Wilmington, DE | 1.0 | 1.0 | 650 | $1,450 | $2.23 | 5d | 1 | 0.75mi |
| 703 Orange St Wilmington, DE | 1.0–2.0 | 1.0 | 800 | $1,475 | $1.84 | 44d | 1 | 0.78mi |
| 1607 Howland St Wilmington, DE | 3.0 | 1.0 | 1075 | $1,900 | $1.77 | 4d | 1 | 0.78mi |
| 613 W 10th St Wilmington, DE | 2.0 | 1.0 | 1100 | $1,745 | $1.59 | 44d | 1 | 0.82mi |
| 824 N West St Wilmington, DE | 1.0 | 1.0 | 700 | $1,262 | $1.80 | 44d | 1 | 0.82mi |
| 839 N Tatnall St Unit 303 Wilmington, DE | 2.0 | 2.0 | 876 | $1,475 | $1.68 | 6d | 1 | 0.83mi |
| 801 N Orange St Wilmington, DE | 3.0 | 1.0–3.0 | 1118 | $3,211 | $2.87 | 3d | 117 | 0.84mi |
Listing history 17 events
-
2026-04-20status Pending
-
2026-02-18$129,999 Active
-
2026-02-16historical
-
2026-02-13price $129,999
-
2026-02-04price $132,500
-
2026-01-20status Active
-
2026-01-09status Pending
-
2025-11-29price $139,999
-
2025-11-11$144,999 Active
-
2024-09-13historical
-
2024-07-01price $129,999
-
2024-06-07$133,000 Active
-
2024-06-06historical
-
2024-01-17historical
-
2024-01-07price $130,000
-
2023-12-09$133,000 Active
-
2023-12-07historical
ⓘ Source: listings_history table (triggers on properties + properties_extension) + one-shot
backfill from property_details.listing_events for pre-trigger history.
Climate risk First Street
- Flood 5/10 Major FEMA zone X (unshaded) · 67% chance over 30 yrs
- Wildfire 1/10 Low
- Heat 8/10 Severe 7 d/yr ≥103°F today · 16 d/yr by 30 yrs out
- Wind 6/10 Major 27% chance of damaging wind over 30 yrs
- Air quality 3/10 Moderate 3 unhealthy d/yr today · 4 by 30 yrs out
Nearby sold comps map
Loading sold comps map…
Walkable amenities ~0.75 mi
Loading nearby amenities…
Taxation est. · year 1
- Rental income
- $19,834
- − Mortgage interest
- −$7,282
- − Property taxes
- −$1,950
- − Insurance
- −$650
- − Repairs & maintenance
- −$1,587
- − Management
- −$1,587
- − Depreciation
- −$3,782
- Taxable income
- $2,997
- Est. tax owed @ 24.0%
- −$719
- After-tax cash flow
- $4,169/yr
For passive investors: Depreciation is non-cash, so a rental often shows a tax loss while cash-flowing — sheltering income. Rental losses are passive: they offset passive income freely, and up to $25,000/yr can offset ordinary (W-2) income if you actively participate and your MAGI is under $100k (phasing out to $0 by $150k); unused losses carry forward. On sale, claimed depreciation is recaptured at up to 25%, and gains may owe capital-gains tax (a 1031 exchange can defer both). Figures are a year-1 estimate at your 24.0% rate — not tax advice; consult a CPA.
Schools (NCES district)
- District
- Christina School District
- NCES district ID
- 1000200
- Math proficiency
- 22% ▼ -12.00%
- Reading proficiency
- 33% ▼ -5.00%
- Median HH income
- $58,838
- Composite
- 24.93/100
- National rank
- #7567
- State rank
- #18 of 26 in DE
Livability — Wilmington
- Score
- 64/100
- State rank
- #52
- US rank
- #14251
Category grades
Schools grade is shown separately in the Schools card above.
Census & demographics
- Census place
- Wilmington, DE
- County
- New Castle County · 483,412 people
- City population
- 173,480
- Metro
- Philadelphia-Camden-Wilmington, PA-NJ-DE-MD
- Population (ZIP)
- 41,402
- Household income
- $60,221
- Rent vs Own
- Severe rent burden
- 1730.0
Population outlook (New Castle County) Hauer SSP2
- Today (2025)
- 594,686 people
- By 2030
- 609,164 · +2.4%
- By 2040
- 632,154 · +6.3%
- By 2050
- 649,068 · +9.1%
- By 2075
- 687,771 · +15.7%
- By 2100
- 694,961 · +16.9%
Race, ethnicity, and origin ACS 2023
- Neighborhood character
- Diverse neighborhood (Simpson 0.70)
- Race & ethnicity
- White 37% Black 32% Hispanic / Latino 25% Two or more races 10%
- Hispanic origin (detail)
- Mexican 10% Puerto Rican 10% Dominican 2%
- Common ancestry
- Romanian 4% Slovak 1% Italian 1%
- Foreign-born
- 9% · Canada
- Languages at home
- 79% English-only · Spanish 18% French/Haitian/Cajun 1% Arabic 1%
Political lean MEDSL · New Castle
- 2024 margin
- Solid D (+32.6) · D 65.5% · R 32.9% · Other 1.6%
- 2008→2024 swing
- -8.1pp toward R · 2008: 40.6pp · 2024: 32.6pp
- All cycles
- 2024: D+32.6 2020: D+37.1 2016: D+29.6 2012: D+34.1 2008: D+40.6
Not yet ingested
- Civics
- —
Market trends
- HPI YoY
- ▼ -291.16%
- Current HPI
- 259.1455
- Rent YoY
- ▲ 6.35%
- Metro
- Philadelphia-Camden-Wilmington, PA-NJ-DE-MD
- State GDP YoY
- —
- F500 in state
- 0
Price history
-2.3% since first listed17 events — show timeline
- 2026-04-20 Pending — BRIGHT MLS
- 2026-02-18 Listed $129,999 BRIGHT MLS
- 2026-02-16 Listing Removed — BRIGHT MLS
- 2026-02-13 Price Changed $129,999 BRIGHT MLS
- 2026-02-04 Price Changed $132,500 BRIGHT MLS
- 2026-01-20 Relisted — BRIGHT MLS
- 2026-01-09 Pending — BRIGHT MLS
- 2025-11-29 Price Changed $139,999 BRIGHT MLS
- 2025-11-11 Listed $144,999 BRIGHT MLS
- 2024-09-13 Listing Removed — BRIGHT MLS
- 2024-07-01 Price Changed $129,999 BRIGHT MLS
- 2024-06-07 Listed $133,000 BRIGHT MLS
- 2024-06-06 Coming Soon — BRIGHT MLS
- 2024-01-17 Listing Removed — BRIGHT MLS
- 2024-01-07 Price Changed $130,000 BRIGHT MLS
- 2023-12-09 Listed $133,000 BRIGHT MLS
- 2023-12-07 Coming Soon — BRIGHT MLS
Cash-flow waterfall
monthlySold comps — $/sqft
last 12 mo · ≤1 miLoading sold comps…