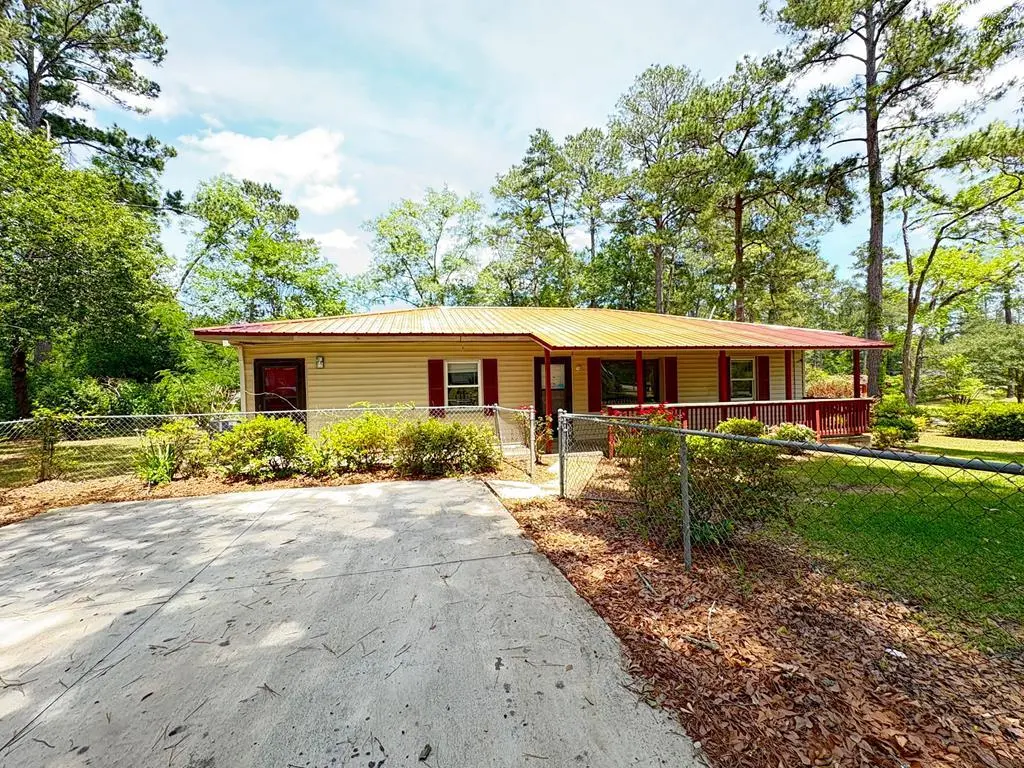
220 13th Ave Ave SW · Cairo, GA
Flood risk 1/10 · Minimal
- FEMA flood zone
- X (unshaded)
- Chance of flooding over 30 yrs
- 0.0%
- Est. flood insurance / yr
- $507 – $1,088
Fire risk 4/10 · Minor
- Est. fire insurance / yr
- $963 – $1,789
Heat risk 8/10 · Major
- Hot days now (above 108°F)
- 7 days/yr
- Hot days in 30 yrs
- 19 days/yr
Wind risk 8/10 · Major
- Chance of severe wind over 30 yrs
- 99.0%
Air-quality risk 4/10 · Minor
- Unhealthy air days now
- 7 days/yr
- Unhealthy air days in 30 yrs
- 7 days/yr
Risk factors via First Street. Map © Google.
Why this score? — see what drove the B grade
The composite is a weighted blend of 9 inputs, each scored 0–100. Each bar is that input's sub-score; the figure is the points it added to the 100-point composite (weight × sub-score).
- Cash flow +30.0/30.0
- ARV discount +15.0/15.0
- DSCR +10.0/10.0
- 1% rule +8.4/10.0
- Livability +3.2/5.0
- Rent growth +2.5/5.0
- Condition / age +2.5/5.0
- Schools +2.2/10.0
- Appreciation +0.0/10.0
$98,000
🖨 Deal sheet (PDF) 📄 Offer letter ✓ Due diligence
Listing remarks
Check out this 3-bedroom home with tile floors throughout and a covered porch perfect for relaxing. The large lot gives you lots of room to spread out. It includes a living room and a formal dining area. It does need a little work, but it's a great opportunity to make it your own.
Key facts
- Covered porch
- Tile floors
- Living room
Tags
Property features AI
Exterior
- Parking: Open parking; Concrete parking surface
- Utilities: Public water; Sewer connected; Water connected
- Home design: Single-family residence; One story; Residential property
- Construction: Vinyl siding; Slab foundation; Built with metal roof
- Exterior features: Front porch; Chain link fencing; Metal roof
Interior
- Flooring: Tile
- Bathrooms: 2 full bathrooms
- Heating & cooling: Central heating; Central air conditioning
- Interior features: Tile flooring
Neighborhood map
What this means for you Summary
Snapshot
- This is a 3-bed/1.0-bath single-family listed at $98k.
Deal economics
- At list price, monthly cash flow is $377 ($5k/yr) — positive.
- The deal already cash-flows at list — no discount required.
- Meets the 1% rule at list price ($1k rent vs $98k).
- Recommended offer: $95k (3.0% below list) — sets the bar for market timing.
- Cap rate 10.9% vs local median 3.0% in Cairo — top-decile yield for the area; either an underpriced asset or a hidden risk that comps aren't pricing in. Stress-test before assuming the spread holds.
Location & tenants
- Location reads 65/100 on livability (#240 in GA) — a middle-class / working-renter tenant base. Strengths: cost of living A+, housing A+; Watch: employment D, amenities F, commute F.
- Grady County (town): math 27% / reading 27% proficiency, ranked #116 of 174 in GA (top 67%) — low school quality limits family demand, transient renter base, plan for 1-2y turnover; 64% free/reduced lunch — lower-income household profile, screen leases tightly.
- Zoned schools: Southside Elementary School (math 41% / reading 24%, grade F, #575 of 1,228 statewide, top 47%, 564 students, 100% FRL); Washington Middle School (math 15% / reading 28%, grade F, #339 of 470 statewide, top 72%, 686 students, 100% FRL); Cairo High School (math 9% / reading 12%, grade F, #348 of 424 statewide, top 83%, 1,274 students, 100% FRL, charter) — zoned schools average 100% FRL vs 64% district-wide (36 pts higher); higher-poverty schools than district average — tighter screening recommended.
- Market conditions: 68 active listings in the ZIP; 55 units permitted in Grady County in 2024 (0 in 5+ unit buildings).
Forward outlook
- Local home prices are declining (-3.0%/yr); year-one equity from $678 of loan paydown is wiped out by about $3k of value loss. Plan a longer hold.
- Grady County population projected at -10% by 2050 — secular population decline; favor cash flow + early exit over multi-decade hold.
- At projected returns (-3.0% appreciation + 3.0% rent growth), your $27k cash investment doubles in ~8 years — after that, you're playing with house money.
Negotiation context
- It's been on market 47 days — a 3% lower offer ($95k) is reasonable based on typical stale-listing flexibility.
Risks & watch-outs
- Watch-outs: built in 1953 — expect roof / HVAC / electrical / plumbing capex.
- Climate carrying-cost: severe wind risk, 99% chance of damaging wind over 30y; extreme-heat days projected 7→19/yr by 2055 (HVAC capex compounding) — expect insurance premiums to compound above CPI over the hold.
Questions for the listing agent
- It's been on market 47 days. Have you received any prior offers? Is the seller open to a 3% concession, seller financing, or rate buy-down credit?
- Built in 1953 — when were the roof, HVAC, electrical panel, plumbing, and water heater last replaced?
- Is there a deadline driving the sale (1031 exchange, divorce, estate, relocation)? That informs how much negotiation room exists.
- Schools are F-rated, which usually means shorter tenancies and higher turnover. Who's the typical renter profile here, and what's been the actual vacancy rate?
- What's the average days-on-market for RENTAL listings here right now (not sales)? A rising rental-DOM trend means longer vacancies and softer asking-rent achievability than the comps imply.
- What's the recent tenant-quality profile in this submarket — average credit score on applications, eviction rate, late-payment / NSF rate, and stable-employment percentage? A property-management company in the area should have these aggregated.
- How much new for-sale + rental construction is in the pipeline within 1–3 miles? Heavy new supply typically softens prices + rents 12–24 months out; constrained supply supports both.
Investment metrics
- 1% rule
- 1.34% ✓
- Cap rate
- 10.91%
- Cash-on-cash
- 16.50%
- DSCR
- 1.73
- GRM
- 6.2
CMA / ARV
- ARV (median comp)
- $178,291
- List price
- $98,000
- Delta
- -45.03%
- Verdict
- UNDERPRICED
- Comps
- 20 within 1.0 mi
Show comp detail 12 sales within ~0.75 mi
| Address | Dist | Beds/Ba | Sqft | Sold | Price | $/sf | Match |
|---|---|---|---|---|---|---|---|
| 109 Oriac Ave Ave SW | 0.10mi | 3/1.0 | 1,248 (-12%) | 5mo | $139,000 | $111 | 71 |
| 55 15th Ave Ave SE | 0.38mi | 3/2.0 | 1,446 (+2%) | 9mo | $80,000 | $55 | 68 |
| 720 1st St St SW | 0.36mi | 3/1.0 | 1,536 (+8%) | 6mo | $62,500 | $41 | 65 |
| 536 SW 7th St | 0.63mi | 3/1.5 | 1,425 (+0%) | 12mo | $115,000 | $81 | 58 |
| 516 SE 2nd St | 0.64mi | 3/2.0 | 1,430 (+1%) | 9mo | $185,500 | $130 | 58 |
| 1012 SE 3rd St | 0.44mi | 3/2.0 | 1,486 (+5%) | 15mo | $148,000 | $100 | 56 |
| 425 S Broad St | 0.67mi | 2/1.0 (-1) | 1,382 (-3%) | 8mo | $80,000 | $58 | 52 |
| 1355 SE Brookwood Dr | 0.54mi | 3/2.0 | 1,512 (+6%) | 11mo | $245,500 | $162 | 51 |
| 1465 1st St St SE | 0.39mi | 2/1.0 (-1) | 1,247 (-12%) | 9mo | $92,500 | $74 | 49 |
| 290 SE Muggridge Ln | 0.40mi | 3/2.0 | 1,310 (-8%) | 18mo | $190,000 | $145 | 49 |
| 645 SW 7th St | 0.55mi | 3/2.0 | 1,508 (+6%) | 18mo | $78,000 | $52 | 45 |
| 339 SE 7th Ave | 0.64mi | 4/2.0 (+1) | 1,392 (-2%) | 19mo | $160,000 | $115 | 42 |
Match score weights: distance 35% · size 25% · config 20% · recency 20%. Top-matched comps best support the ARV.
Projected returns pro-forma
-3.0% appreciation · 3.0% rent growth · sell at horizon
- IRR
- 7.6%
- Equity multiple
- 1.30×
- Total profit
- $8,157
- Equity at exit
- $14,612
- IRR
- 16.9%
- Equity multiple
- 2.39×
- Total profit
- $38,078
- Equity at exit
- $8,473
Cash invested: $27,440 (down + closing). Projections, not guarantees.
Landlord ↔ Tenant lean methodology
- Overall (STATE)
- 90 Strongly Landlord-Friendly
- State Georgia
- 90 Strongly Landlord-Friendly · R+3
- County
- — inherits STATE
- City
- — inherits STATE
ZIP-level market 39828
- Home prices YoY
- -27.1%
- Active inventory
- 68
- Price-to-rent
- 6.2×
Monthly cashflow live
- Estimated rent
- $1,312 medium interval (Pro) →
- Mortgage (P&I)
- −$514
- Tax from tax record
- −$104 /mo · $1,252/yr
- Insurance
- −$41
- HOA
- −$0
- Vacancy / Maint / Mgmt
- −$275
- Net cashflow
- $377
Break-even live
Sensitivity live
| Price | -10% $433 | -5% $405 | +0% $377 | +5% $350 | +10% $322 |
|---|---|---|---|---|---|
| Rent | -10% $274 | -5% $325 | +0% $377 | +5% $429 | +10% $481 |
| Rate | -1.0pp $427 | -0.5pp $402 | base $377 | +0.5pp $352 | +1.0pp $326 |
UW: 25.0% down · 7.5% · 30yr · 1.5% tax · 5.0% vac · 8.0% maint · 8.0% mgmt
Financing live
Cash to close
- Down payment
- $24,500
- Closing costs
- $2,940
- Reserves months
- —
- Total cash needed
- —
Loan-product check · same deal, 3 products live
Conventional
25% down · 7.5% · 30yr
- Down + closing
- —
- Monthly P&I
- —
- Monthly cashflow
- —
- DSCR
- —
- Eligible?
- —
Personal DTI + credit; lowest rate.
DSCR
20% down · 8.5% · 30yr
- Down + closing
- —
- Monthly P&I
- —
- Monthly cashflow
- —
- DSCR
- —
- Eligible?
- —
No personal income docs; deal must DSCR.
Hard money
10% down · 12.0% · 12mo
- Down + closing
- —
- Monthly P&I
- —
- Monthly cashflow
- —
- DSCR
- —
- Eligible?
- —
Short-term bridge; refi at stabilization.
Listing history 18 events
-
2026-06-21days on market $98,000 Active 47 DOM
-
2026-06-19days on market $98,000 Active 45 DOM
-
2026-06-18days on market $98,000 Active 44 DOM
-
2026-06-17days on market $98,000 Active 43 DOM
-
2026-06-16days on market $98,000 Active 42 DOM
-
2026-06-15days on market $98,000 Active 41 DOM
-
2026-06-14days on market $98,000 Active 39 DOM
-
2026-06-12pricedays on market $98,000 Active 38 DOM
-
2026-06-09days on market $107,950 Active 35 DOM
-
2026-06-08days on market $107,950 Active 34 DOM
-
2026-06-07days on market $107,950 Active 33 DOM
-
2026-06-07days on market $107,950 Active 32 DOM
-
2026-06-03days on market $107,950 Active 29 DOM
-
2026-06-02days on market $107,950 Active 28 DOM
-
2026-06-01days on market $107,950 Active 27 DOM
-
2026-05-31days on market $107,950 Active 26 DOM
-
2026-05-31days on market $107,950 Active 25 DOM
-
2026-05-05$107,950 Active 281-char remark
ⓘ Source: listings_history table (triggers on properties + properties_extension) + one-shot
backfill from property_details.listing_events for pre-trigger history.
Tax reassessment forecast GA · Resets to sale price
- Current annual tax
- $1,252 · $104/mo
- Projected year-2 tax
- $1,252 · $104/mo
- Expected delta
- $0/yr ($0/mo · 0.0%)
ⓘ Screening estimate from a state-policy table — verify with the county assessor before closing.
Climate risk First Street
- Flood 1/10 Low FEMA zone X (unshaded) · 0% chance over 30 yrs
- Wildfire 4/10 Moderate
- Heat 8/10 Severe 7 d/yr ≥108°F today · 19 d/yr by 30 yrs out
- Wind 8/10 Severe 99% chance of damaging wind over 30 yrs
- Air quality 4/10 Moderate 7 unhealthy d/yr today · 7 by 30 yrs out
Nearby sold comps map
Loading sold comps map…
Walkable amenities ~0.75 mi
Loading nearby amenities…
Taxation est. · year 1
- Rental income
- $15,742
- − Mortgage interest
- −$5,490
- − Property taxes
- −$1,252
- − Insurance
- −$490
- − Repairs & maintenance
- −$1,259
- − Management
- −$1,259
- − Depreciation
- −$2,851
- Taxable income
- $3,141
- Est. tax owed @ 24.0%
- −$754
- After-tax cash flow
- $3,773/yr
For passive investors: Depreciation is non-cash, so a rental often shows a tax loss while cash-flowing — sheltering income. Rental losses are passive: they offset passive income freely, and up to $25,000/yr can offset ordinary (W-2) income if you actively participate and your MAGI is under $100k (phasing out to $0 by $150k); unused losses carry forward. On sale, claimed depreciation is recaptured at up to 25%, and gains may owe capital-gains tax (a 1031 exchange can defer both). Figures are a year-1 estimate at your 24.0% rate — not tax advice; consult a CPA.
Schools (NCES district)
- District
- Grady County
- NCES district ID
- 1302460
- Math proficiency
- 27% ▬ 0.00%
- Reading proficiency
- 27% ▼ -1.00%
- Median HH income
- $34,558
- Composite
- 22.25/100
- National rank
- #8146
- State rank
- #116 of 174 in GA
Livability — Cairo
- Score
- 65/100
- State rank
- #240
- US rank
- #13597
Category grades
Schools grade is shown separately in the Schools card above.
Census & demographics
- Census place
- Cairo, GA
- Population (ZIP)
- 15,571
Population outlook (Grady County) Hauer SSP2
- Today (2025)
- 24,897 people
- By 2030
- 24,634 · -1.1%
- By 2040
- 23,693 · -4.8%
- By 2050
- 22,401 · -10.0%
- By 2075
- 18,973 · -23.8%
- By 2100
- 14,665 · -41.1%
Race, ethnicity, and origin ACS 2023
- Neighborhood character
- Diverse neighborhood (Simpson 0.64)
- Race & ethnicity
- White 43% Black 39% Hispanic / Latino 17% Two or more races 5%
- Hispanic origin (detail)
- Mexican 15%
- Common ancestry
- Iranian 1% Serbian 1% Slovak 1%
- Foreign-born
- 8% · Canada
- Languages at home
- 84% English-only · Spanish 16%
Political lean MEDSL · Grady
- 2024 margin
- Solid R (+38.2) · D 30.7% · R 68.9%
- 2008→2024 swing
- -14.3pp toward R · 2008: -23.9pp · 2024: -38.2pp
- All cycles
- 2024: R+38.2 2020: R+31.9 2016: R+33.1 2012: R+26.6 2008: R+23.9
Not yet ingested
- Civics
- —
Market trends
- HPI YoY
- ▼ -64.33%
- Current HPI
- 173.3326
- Rent YoY
- —
- Metro
- —
- State GDP YoY
- ▲ 2.66%
- F500 in state
- 28
Industry mix (Fortune 500 HQ in GA)
| Industry | F500 HQs | Revenue |
|---|---|---|
| Paper / Packaging | 2 | $29B |
|
||
| Retail | 1 | $160B |
|
||
| Transportation / Logistics | 1 | $91B |
|
||
| Airlines | 1 | $62B |
|
||
| Consumer Goods | 1 | $47B |
|
||
| Utilities | 1 | $25B |
|
||
Price history
-9.2% since first listed2 events — show timeline
- 2026-06-10 Price Changed $98,000 MBOR
- 2026-05-05 Listed $107,950 MBOR
Property tax history
+4.8%/yrLatest (2025): $1,252 · -15.2% YoY. Source: county tax records.
Cash-flow waterfall
monthlySold comps — $/sqft
last 12 mo · ≤1 miLoading sold comps…