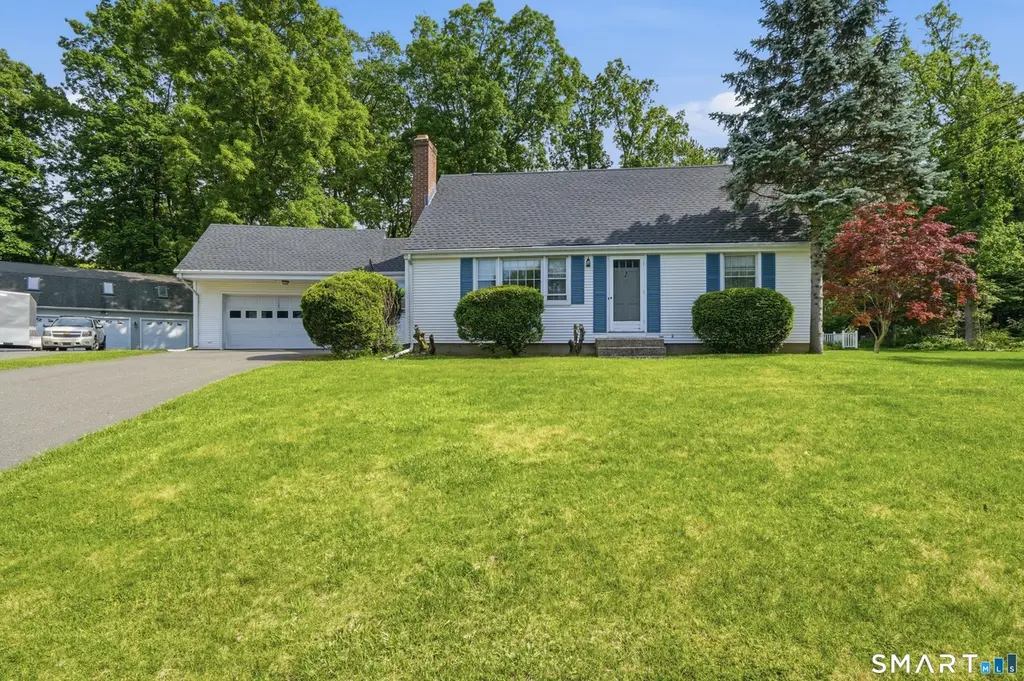
40 Royal Oak Rd · New Britain, CT
Flood risk 1/10 · Minimal
- FEMA flood zone
- X (unshaded)
- Chance of flooding over 30 yrs
- 0.0%
- Est. flood insurance / yr
- $473 – $860
Fire risk 1/10 · Minimal
- Est. fire insurance / yr
- $829 – $1,539
Heat risk 4/10 · Minor
- Hot days now (above 97°F)
- 6 days/yr
- Hot days in 30 yrs
- 14 days/yr
Wind risk 6/10 · Moderate
- Chance of severe wind over 30 yrs
- 27.0%
Air-quality risk 3/10 · Minor
- Unhealthy air days now
- 2 days/yr
- Unhealthy air days in 30 yrs
- 3 days/yr
Risk factors via First Street. Map © Google.
Why this score? — see what drove the D grade
The composite is a weighted blend of 9 inputs, each scored 0–100. Each bar is that input's sub-score; the figure is the points it added to the 100-point composite (weight × sub-score).
- Appreciation +10.0/10.0
- ARV discount +7.5/15.0
- Cash flow +7.3/30.0
- Rent growth +3.7/5.0
- Livability +3.7/5.0
- 1% rule +3.1/10.0
- Condition / age +2.5/5.0
- DSCR +1.5/10.0
- Schools +1.0/10.0
$325,000
🖨 Deal sheet (PDF) 📄 Offer letter ✓ Due diligence
Listing remarks
Welcome to this spacious 5-bedroom, 2 full bathroom home filled with potential and opportunity. Featuring a fantastic layout with generous living spaces and great flow throughout, this home offers the perfect foundation for someone looking to add their own style and updates. While cosmetic improvements may be desired, the property boasts solid bones, functional space, and endless possibilities to truly make it your own. Whether you're looking for room to grow, multi-generational living potential, or an investment opportunity, this home is ready for its next chapter. Conveniently located near shopping, dining, schools, and major routes.
Key facts
- 0.47 acre lot
- 2 garage spots
- Built 1958
Property features AI
Exterior
- Parking: Attached 2-car garage; Driveway parking; Paved parking areas; 6 total parking spaces
- Utilities: Public water connected; Public sewer connected
- Home design: Single-family home for sale
- Construction: Vinyl siding; Frame construction; Concrete foundation; Asphalt shingle roof
- Exterior features: Gutters; Patio; Lightly wooded lot; Private paved driveway
Interior
- Kitchen: Oven/Range; Refrigerator; Dishwasher
- Bedrooms: 5 bedrooms
- Bathrooms: 2 full bathrooms
- Heating & cooling: Baseboard heating; Hot air heating; Oil-fired hot water; Fuel tank located in basement
- Interior features: 8 total rooms; Full, unfinished basement with concrete floor and full hatchway; 2 fireplaces; Window unit cooling
- Laundry & utility: Laundry room on lower level
Neighborhood map
What this means for you Summary
Snapshot
- This is a 5-bed/2.0-bath single-family listed at $325k.
Deal economics
- At list price, monthly cash flow is $-429 ($-5k/yr) — negative.
- To cash-flow at today's rent, offer at most $249k (23.3% below list).
- To meet the 1% rule (rent ≥ 1% of price), the offer needs to be $263k (19.1% below list).
- Recommended offer: $249k (23.3% below list) — sets the bar for cash-flow.
Location & tenants
- Location reads 74/100 on livability (#67 in CT, #4,936 nationally) — a middle-class / working-renter tenant base. Strengths: health & safety A+, cost of living A, housing A; Watch: crime D, employment D.
- New Britain School District (suburban): math 6% / reading 17% proficiency, ranked #153 of 153 in CT (top 100%) — low school quality limits family demand, transient renter base, plan for 1-2y turnover; 71% free/reduced lunch — lower-income household profile, screen leases tightly.
- Zoned schools: Diloreto Elementary & Middle School (math 4% / reading 15%, grade F, #522 of 553 statewide, top 95%, 842 students, 73% FRL); Pulaski Middle School (math 0% / reading 13%, grade F, #171 of 175 statewide, top 98%, 867 students, 80% FRL); New Britain High School (math 10% / reading 31%, grade F, #162 of 194 statewide, top 83%, 2,331 students, 71% FRL) — zoned schools at 75% FRL track the district average.
- Market conditions: Rents rising fast (+4.9%/yr); 71 active listings in the ZIP; 1 comparable units currently listed for rent nearby; 1,867 units permitted in Capitol Planning Region in 2024 (1,399 in 5+ unit buildings).
- At $2,628/mo this rent would consume 50% of the median local household income ($63k/yr) (locally 1835% of renters already pay >50% of income on rent) — very limited rent-growth headroom before tenants either downsize or default.
Forward outlook
- In year one you build about $35k of equity ($2k loan paydown + $32k appreciation (10.0% local appreciation)).
- By year 2, paydown + projected appreciation supports a ~$56k cash-out refi (75% LTV) — recoverable capital for the next deal without selling this one.
Negotiation context
- Only 5 days on market — expect competitive offers; lowballing is unlikely to land.
Risks & watch-outs
- Watch-outs: built in 1958 — expect roof / HVAC / electrical / plumbing capex.
- Climate carrying-cost: major wind risk, 27% chance of damaging wind over 30y — expect insurance premiums to compound above CPI over the hold.
Questions for the listing agent
- What do current leases actually rent for vs. the listed asking? Can we see a recent rent roll and the last 12 months of T-12 income?
- Built in 1958 — when were the roof, HVAC, electrical panel, plumbing, and water heater last replaced?
- Is there a deadline driving the sale (1031 exchange, divorce, estate, relocation)? That informs how much negotiation room exists.
- Schools are F-rated, which usually means shorter tenancies and higher turnover. Who's the typical renter profile here, and what's been the actual vacancy rate?
- Crime grade is D in this area — have there been break-ins, vandalism, or insurance claims at this property in the last 3 years? What carrier currently insures it and at what premium?
- The area grade is low — what's the realistic commute time and amenity access for the typical tenant pool here? Any planned neighborhood developments (good or bad) we should know about?
- What's the average days-on-market for RENTAL listings here right now (not sales)? A rising rental-DOM trend means longer vacancies and softer asking-rent achievability than the comps imply.
- What's the recent tenant-quality profile in this submarket — average credit score on applications, eviction rate, late-payment / NSF rate, and stable-employment percentage? A property-management company in the area should have these aggregated.
- How much new for-sale + rental construction is in the pipeline within 1–3 miles? Heavy new supply typically softens prices + rents 12–24 months out; constrained supply supports both.
Investment metrics
- 1% rule
- 0.81% ✗
- Cap rate
- 4.71%
- Cash-on-cash
- -5.66%
- DSCR
- 0.75
- GRM
- 10.3
CMA / ARV
No comps found within radius.
Projected returns pro-forma
10.0% appreciation · 4.94% rent growth · sell at horizon
- IRR
- 20.9%
- Equity multiple
- 2.70×
- Total profit
- $155,091
- Equity at exit
- $292,786
- IRR
- 19.5%
- Equity multiple
- 6.39×
- Total profit
- $490,092
- Equity at exit
- $631,404
Cash invested: $91,000 (down + closing). Projections, not guarantees.
Landlord ↔ Tenant lean methodology
- Overall (STATE)
- 27 Tenant-Leaning
- State Connecticut
- 27 Tenant-Leaning · D+7
- County
- — inherits STATE
- City
- — inherits STATE
ZIP-level market 06053
- Home prices YoY
- 15.4%
- Rents YoY
- 4.9%
- Active inventory
- 71
- Price-to-rent
- 10.3×
Monthly cashflow live
- Estimated rent
- $2,628 medium interval (Pro) →
- Mortgage (P&I)
- −$1,704
- Tax from tax record
- −$665 /mo · $7,984/yr
- Insurance
- −$135
- HOA
- −$0
- Lot rent
- −$0
- Vacancy / Maint / Mgmt
- −$552
- Net cashflow
- $-429
Break-even live
Sensitivity live
| Price | -10% $-245 | -5% $-337 | +0% $-429 | +5% $-521 | +10% $-613 |
|---|---|---|---|---|---|
| Rent | -10% $-637 | -5% $-533 | +0% $-429 | +5% $-325 | +10% $-222 |
| Rate | -1.0pp $-266 | -0.5pp $-347 | base $-429 | +0.5pp $-513 | +1.0pp $-599 |
UW: 25.0% down · 7.5% · 30yr · 1.5% tax · 5.0% vac · 8.0% maint · 8.0% mgmt
Financing live
Cash to close
- Down payment
- $81,250
- Closing costs
- $9,750
- Reserves months
- —
- Total cash needed
- —
Loan-product check · same deal, 3 products live
Conventional
25% down · 7.5% · 30yr
- Down + closing
- —
- Monthly P&I
- —
- Monthly cashflow
- —
- DSCR
- —
- Eligible?
- —
Personal DTI + credit; lowest rate.
DSCR
20% down · 8.5% · 30yr
- Down + closing
- —
- Monthly P&I
- —
- Monthly cashflow
- —
- DSCR
- —
- Eligible?
- —
No personal income docs; deal must DSCR.
Hard money
10% down · 12.0% · 12mo
- Down + closing
- —
- Monthly P&I
- —
- Monthly cashflow
- —
- DSCR
- —
- Eligible?
- —
Short-term bridge; refi at stabilization.
Rent comps 1 comps
| Address | Beds | Baths | Sqft | Rent | $/sqft | DOM | Units | Dist |
|---|---|---|---|---|---|---|---|---|
| 146 Sterling St New Britain, CT | 4.0 | 1.0 | 2786 | $2,700 | $0.97 | 0d | 1 | 1.36mi |
Listing history 4 events
-
2026-06-02statusdays on market $325,000 Under Contract 5 DOM
-
2026-06-01days on market $325,000 Active 4 DOM
-
2026-05-31days on market $325,000 Active 3 DOM
-
2026-05-29$325,000 Active
ⓘ Source: listings_history table (triggers on properties + properties_extension) + one-shot
backfill from property_details.listing_events for pre-trigger history.
Tax reassessment forecast CT · Partial reset (capped growth)
- Current annual tax
- $7,984 · $665/mo
- Projected year-2 tax
- $7,984 · $665/mo
- Expected delta
- $0/yr ($0/mo · 0.0%)
ⓘ Screening estimate from a state-policy table — verify with the county assessor before closing.
Climate risk First Street
- Flood 1/10 Low FEMA zone X (unshaded) · 0% chance over 30 yrs
- Wildfire 1/10 Low
- Heat 4/10 Moderate 6 d/yr ≥97°F today · 14 d/yr by 30 yrs out
- Wind 6/10 Major 27% chance of damaging wind over 30 yrs
- Air quality 3/10 Moderate 2 unhealthy d/yr today · 3 by 30 yrs out
Nearby sold comps map
Loading sold comps map…
Walkable amenities ~0.75 mi
Loading nearby amenities…
Taxation est. · year 1
- Rental income
- $31,532
- − Mortgage interest
- −$18,205
- − Property taxes
- −$7,984
- − Insurance
- −$1,625
- − Repairs & maintenance
- −$2,523
- − Management
- −$2,523
- − Depreciation
- −$9,455
- Taxable loss
- −$10,782
- Est. tax savings @ 24.0%
- +$2,588
- After-tax cash flow
- $-2,563/yr
For passive investors: Depreciation is non-cash, so a rental often shows a tax loss while cash-flowing — sheltering income. Rental losses are passive: they offset passive income freely, and up to $25,000/yr can offset ordinary (W-2) income if you actively participate and your MAGI is under $100k (phasing out to $0 by $150k); unused losses carry forward. On sale, claimed depreciation is recaptured at up to 25%, and gains may owe capital-gains tax (a 1031 exchange can defer both). Figures are a year-1 estimate at your 24.0% rate — not tax advice; consult a CPA.
Schools (NCES district)
- District
- New Britain School District
- NCES district ID
- 0902670
- Math proficiency
- 6% ▼ -6.00%
- Reading proficiency
- 17% ▼ -5.00%
- Median HH income
- $40,827
- Composite
- 9.95/100
- National rank
- #9816
- State rank
- #153 of 153 in CT
Livability — New Britain
- Score
- 74/100
- State rank
- #67
- US rank
- #4936
Category grades
Schools grade is shown separately in the Schools card above.
Census & demographics
- Census place
- New Britain, CT
- County
- Hartford County · 754,208 people
- City population
- 66,322
- Metro
- Hartford-East Hartford-Middletown, CT
- Population (ZIP)
- 36,774
- Household income
- $62,645
- Rent vs Own
- Severe rent burden
- 1835.0
Population outlook (Capitol County) Hauer SSP2
- By 2040
- 1,063,519
Race, ethnicity, and origin ACS 2023
- Neighborhood character
- Diverse neighborhood (Simpson 0.64)
- Race & ethnicity
- White 47% Hispanic / Latino 36% Two or more races 13% Black 10% Asian 3%
- Hispanic origin (detail)
- Mexican 1% Puerto Rican 25% Dominican 4%
- Common ancestry
- Romanian 19% Lithuanian 3% Russian 1%
- Foreign-born
- 22% · Canada, Vietnam, China
- Languages at home
- 50% English-only · Spanish 26% Russian/Polish/Slavic 15% French/Haitian/Cajun 3%
Political lean MEDSL · Capitol
- 2024 margin
- Strong D (+21.9) · D 60.1% · R 38.2% · Other 1.7%
- All cycles
- 2024: D+21.9
Not yet ingested
- Civics
- —
Market trends
- HPI YoY
- ▲ 65.76%
- Current HPI
- 491.4724
- Rent YoY
- ▲ 4.94%
- Metro
- Hartford-East Hartford-Middletown, CT
- State GDP YoY
- ▲ 1.06%
- F500 in state
- 38
Industry mix (Fortune 500 HQ in CT)
| Industry | F500 HQs | Revenue |
|---|---|---|
| Industrial Machinery | 4 | $38B |
|
||
| Insurance | 3 | $71B |
|
||
| Financial Services | 2 | $25B |
|
||
| Transportation / Logistics | 2 | $18B |
|
||
| Healthcare | 1 | $247B |
|
||
| Telecommunications | 1 | $55B |
|
||
Price history
1 event — show timeline
- 2026-05-29 Listed $325,000 Smart MLS
Property tax history
+2.1%/yrLatest (2025): $7,984 · -1.0% YoY. Source: county tax records.
Cash-flow waterfall
monthlySold comps — $/sqft
last 12 mo · ≤1 miLoading sold comps…