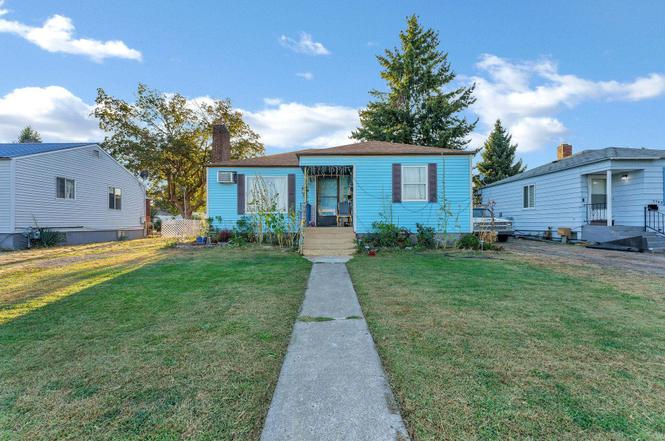
1737 N Smith St · Spokane, WA
Flood risk 1/10 · Minimal
- FEMA flood zone
- X (unshaded)
- Chance of flooding over 30 yrs
- 0.0%
- Est. flood insurance / yr
- $473 – $860
Fire risk 2/10 · Minimal
- Est. fire insurance / yr
- $604 – $1,122
Heat risk 3/10 · Minor
- Hot days now (above 94°F)
- 7 days/yr
- Hot days in 30 yrs
- 15 days/yr
Wind risk 1/10 · Minimal
- Chance of severe wind over 30 yrs
- —
Air-quality risk 10/10 · Severe
- Unhealthy air days now
- 19 days/yr
- Unhealthy air days in 30 yrs
- 21 days/yr
Risk factors via First Street. Map © Google.
Why this score? — see what drove the D- grade
The composite is a weighted blend of 9 inputs, each scored 0–100. Each bar is that input's sub-score; the figure is the points it added to the 100-point composite (weight × sub-score).
- ARV discount +15.0/15.0
- Cash flow +7.1/30.0
- Schools +4.6/10.0
- Livability +4.0/5.0
- Rent growth +3.3/5.0
- Condition / age +2.5/5.0
- 1% rule +1.9/10.0
- DSCR +1.3/10.0
- Appreciation +0.0/10.0
$220,000
🖨 Deal sheet (PDF) 📄 Offer letter ✓ Due diligence
Listing remarks MLS
COZY CHARMER! VINYL FRAMED WINDOWS & VINYL SIDING, LARGE GARAGE-SHOP, HARDWOOD FLOORS, HOME WARRANTY. SOME APPLIANCES MAY STAY WITH FULL PRICE OFFER. 3RD BEDROOM NON-EGRESS.
Key facts
- Close to parks
- Close to schools
- Yard
Tags
Neighborhood map
What this means for you Summary
Snapshot
- This is a 3-bed/2.0-bath single-family listed at $220k.
Deal economics
- At list price, monthly cash flow is $-313 ($-4k/yr) — negative.
- To cash-flow at today's rent, offer at most $175k (20.6% below list).
- To meet the 1% rule (rent ≥ 1% of price), the offer needs to be $153k (30.5% below list).
- Recommended offer: $153k (30.5% below list) — sets the bar for 1% rule.
- Cap rate 4.6% vs local median 3.2% in Spokane — top-decile yield for the area; either an underpriced asset or a hidden risk that comps aren't pricing in. Stress-test before assuming the spread holds.
Location & tenants
- Location reads 80/100 on livability (#93 in WA, #1,822 nationally) — a professional / high-income tenant draw. Strengths: amenities A+, commute A+, housing A+; Watch: crime F.
- Spokane School District (urban): math 47% / reading 58% proficiency, ranked #136 of 291 in WA (top 47%) — acceptable for families but not a draw, mixed tenant base, ~2y average lease.
- Zoned schools: Stevens Elementary (385 students, 91% FRL); Shaw Middle School (764 students, 88% FRL); Lewis & Clark High School (1,739 students, 38% FRL) — zoned schools average 72% FRL vs 50% district-wide (23 pts higher); higher-poverty schools than district average — tighter screening recommended.
- Market conditions: Rents rising (+3.2%/yr); 241 active listings in the ZIP; 28 comparable units currently listed for rent nearby; rentals at typical pace (median 25d on market — plan ~3-4 weeks tenant-placement turnaround); 3,608 units permitted in Spokane County in 2024 (1,792 in 5+ unit buildings).
- This rent runs 30% of the median local income ($60k/yr) — at the standard rent-burdened threshold; future hikes will face affordability resistance.
Forward outlook
- Local home prices are declining (-3.0%/yr); year-one equity from $2k of loan paydown is wiped out by about $7k of value loss. Plan a longer hold.
- Spokane County population projected at +13% by 2050 — modest demand growth; plan on rents tracking national, not racing it.
Negotiation context
- It's been on market 99 days — a 9% lower offer ($200k) is reasonable based on typical stale-listing flexibility.
- 4 sale attempts since 25y ago; this cycle's ask has dropped $40k (15%) from the opening price — seller is motivated, your offer sets the floor, not the list.
- Current owner paid $71k; list at $220k implies a 210% gain — meaningful room to come down on a strong offer.
Risks & watch-outs
- Watch-outs: built in 1947 — expect roof / HVAC / electrical / plumbing capex.
Questions for the listing agent
- What do current leases actually rent for vs. the listed asking? Can we see a recent rent roll and the last 12 months of T-12 income?
- It's been on market 99 days. Have you received any prior offers? Is the seller open to a 31% concession, seller financing, or rate buy-down credit?
- Built in 1947 — when were the roof, HVAC, electrical panel, plumbing, and water heater last replaced?
- Why hasn't it sold? Are there any deal-killer items the seller is aware of (foundation, flood, title, zoning, code violations)?
- Is there a deadline driving the sale (1031 exchange, divorce, estate, relocation)? That informs how much negotiation room exists.
- Schools are B-rated — typically a magnet for longer-tenancy family renters. What's the average tenant stay here, and is there a school-zone premium baked into asking?
- Crime grade is F in this area — have there been break-ins, vandalism, or insurance claims at this property in the last 3 years? What carrier currently insures it and at what premium?
- The area grade is low — what's the realistic commute time and amenity access for the typical tenant pool here? Any planned neighborhood developments (good or bad) we should know about?
- What's the average days-on-market for RENTAL listings here right now (not sales)? A rising rental-DOM trend means longer vacancies and softer asking-rent achievability than the comps imply.
- What's the recent tenant-quality profile in this submarket — average credit score on applications, eviction rate, late-payment / NSF rate, and stable-employment percentage? A property-management company in the area should have these aggregated.
- How much new for-sale + rental construction is in the pipeline within 1–3 miles? Heavy new supply typically softens prices + rents 12–24 months out; constrained supply supports both.
Investment metrics
- 1% rule
- 0.69% ✗
- Cap rate
- 4.59%
- Cash-on-cash
- -6.10%
- DSCR
- 0.73
- GRM
- 12.0
CMA / ARV
- ARV (on-the-fly)
- $270,840
- Comps found
- 12
Show comp detail 12 sales within ~0.75 mi
| Address | Dist | Beds/Ba | Sqft | Sold | Price | $/sf | Match |
|---|---|---|---|---|---|---|---|
| 1509 N Lee St | 0.31mi | 3/1.0 | 1,100 (-1%) | 8mo | $275,000 | $250 | 73 |
| 2508 E Boone Ave | 0.43mi | 2/2.0 (-1) | 1,112 (+0%) | 11mo | $288,000 | $259 | 65 |
| 2002 E Boone Ave | 0.57mi | 2/2.0 (-1) | 1,100 (-1%) | 4mo | $285,500 | $260 | 64 |
| 1873 E Marshall Ave | 0.45mi | 3/1.0 | 1,092 (-2%) | 12mo | $295,000 | $270 | 63 |
| 1603 N Magnolia St | 0.46mi | 2/1.0 (-1) | 1,169 (+5%) | 3mo | $254,000 | $217 | 58 |
| 2627 N Altamont St | 0.54mi | 2/1.0 (-1) | 1,128 (+2%) | 7mo | $175,000 | $155 | 57 |
| 1740 N Stone St | 0.17mi | 3/1.0 | 1,248 (+12%) | 12mo | $285,000 | $228 | 57 |
| 2917 N Nelson St | 0.72mi | 2/1.0 (-1) | 1,132 (+2%) | 5mo | $135,000 | $119 | 50 |
| 2022 E Mallon Ave | 0.73mi | 3/1.0 | 1,057 (-5%) | 8mo | $193,000 | $183 | 47 |
| 2103 E Sharp Ave | 0.45mi | 3/1.0 | 1,258 (+13%) | 13mo | $307,000 | $244 | 42 |
| 2711 E Marshall Ave | 0.26mi | 2/1.0 (-1) | 948 (-15%) | 16mo | $277,000 | $292 | 41 |
| 1908 E Cataldo Ave | 0.72mi | 3/1.0 | 1,268 (+14%) | 19mo | $244,000 | $192 | 23 |
Match score weights: distance 35% · size 25% · config 20% · recency 20%. Top-matched comps best support the ARV.
Projected returns pro-forma
-3.0% appreciation · 3.25% rent growth · sell at horizon
- IRR
- -26.5%
- Equity multiple
- 0.10×
- Total profit
- $-55,180
- Equity at exit
- $32,803
- IRR
- -22.9%
- Equity multiple
- -0.17×
- Total profit
- $-72,040
- Equity at exit
- $19,022
Cash invested: $61,600 (down + closing). Projections, not guarantees.
Landlord ↔ Tenant lean methodology
- Overall (STATE)
- 28 Tenant-Leaning
- State Washington
- 28 Tenant-Leaning · D+8
- County
- — inherits STATE
- City
- — inherits STATE
ZIP-level market 99207
- Home prices YoY
- -21.3%
- Rents YoY
- 3.2%
- Active inventory
- 241
- Price-to-rent
- 12.0×
Monthly cashflow live
- Estimated rent
- $1,528 high interval (Pro) →
- Mortgage (P&I)
- −$1,154
- Tax est. 1.5%
- −$275 /mo · $3,300/yr
- Insurance
- −$92
- HOA
- −$0
- Vacancy / Maint / Mgmt
- −$321
- Net cashflow
- $-313
Break-even live
Sensitivity live
| Price | -10% $-161 | -5% $-237 | +0% $-313 | +5% $-389 | +10% $-465 |
|---|---|---|---|---|---|
| Rent | -10% $-434 | -5% $-373 | +0% $-313 | +5% $-253 | +10% $-192 |
| Rate | -1.0pp $-202 | -0.5pp $-257 | base $-313 | +0.5pp $-370 | +1.0pp $-428 |
UW: 25.0% down · 7.5% · 30yr · 1.5% tax · 5.0% vac · 8.0% maint · 8.0% mgmt
Financing live
Cash to close
- Down payment
- $55,000
- Closing costs
- $6,600
- Reserves months
- —
- Total cash needed
- —
Loan-product check · same deal, 3 products live
Conventional
25% down · 7.5% · 30yr
- Down + closing
- —
- Monthly P&I
- —
- Monthly cashflow
- —
- DSCR
- —
- Eligible?
- —
Personal DTI + credit; lowest rate.
DSCR
20% down · 8.5% · 30yr
- Down + closing
- —
- Monthly P&I
- —
- Monthly cashflow
- —
- DSCR
- —
- Eligible?
- —
No personal income docs; deal must DSCR.
Hard money
10% down · 12.0% · 12mo
- Down + closing
- —
- Monthly P&I
- —
- Monthly cashflow
- —
- DSCR
- —
- Eligible?
- —
Short-term bridge; refi at stabilization.
Rent comps 28 comps
| Address | Beds | Baths | Sqft | Rent | $/sqft | DOM | Units | Dist |
|---|---|---|---|---|---|---|---|---|
| 1908 E South Riverton Ave Spokane, WA | 1.0–2.0 | 1.0 | 740 | $1,319 | $1.78 | 15d | 4 | 0.38mi |
| 3001 E Upriver Dr Spokane, WA | 2.0 | 1.0 | 825 | $1,245 | $1.51 | 15d | 3 | 0.45mi |
| 2513 N Regal St Spokane, WA | 2.0 | 1.0 | 1000 | $1,538 | $1.54 | 15d | 3 | 0.46mi |
| 3001 E Upriver Dr Unit 202 Spokane, WA | 2.0 | 1.0 | 800 | $1,295 | $1.62 | 25d | 1 | 0.46mi |
| 1842 E South Riverton Ave Spokane, WA | 1.0–3.0 | 1.0–2.0 | 915 | $1,710 | $1.87 | 25d | 1 | 0.46mi |
| 2807 E Boone Ave Unit 3 Spokane, WA | 2.0 | 1.0 | 850 | $1,025 | $1.21 | 15d | 1 | 0.46mi |
| 2523 E Desmet Ave Spokane, WA | 3.0 | 2.5 | 1500 | $1,700 | $1.13 | 15d | 1 | 0.49mi |
| 3102 E Jackson Ave Spokane, WA | 2.0 | 1.0 | 700 | $1,145 | $1.64 | 25d | 1 | 0.53mi |
| 1608 E South Riverton Ave Spokane, WA | 3.0 | 2.0 | 1215 | $1,995 | $1.64 | 15d | 2 | 0.59mi |
| 2011 E Desmet Ave Spokane, WA | 2.0 | 1.0 | 900 | $1,250 | $1.39 | 15d | 1 | 0.61mi |
| 3117 E Marietta Ave Spokane, WA | 1.0–2.0 | 1.0 | 730 | $1,195 | $1.64 | 15d | 3 | 0.64mi |
| 1601 E Illinois Ave Unit 1603 Spokane, WA | 2.0 | 1.0 | 840 | $1,295 | $1.54 | 25d | 1 | 0.68mi |
| 3431 E Montgomery Ave #3433 Spokane, WA | 3.0 | 2.0 | 1056 | $1,795 | $1.70 | 25d | 1 | 0.68mi |
| 1449 N Madelia St Spokane, WA | 2.0 | 1.5 | 1010 | $1,650 | $1.63 | 25d | 2 | 0.69mi |
| 3010 N Stone St Unit 6 Spokane, WA | 2.0 | 1.0 | 800 | $1,300 | $1.62 | 25d | 1 | 0.77mi |
| 3203 N Smith St Unit 12 Spokane, WA | 2.0 | 1.0 | 900 | $1,100 | $1.22 | 15d | 1 | 0.79mi |
| 1503 E Marietta Ave Spokane, WA | 2.0 | 1.5 | 993 | $1,775 | $1.79 | 15d | 1 | 0.82mi |
| 1212 N South Riverton Ave Spokane, WA | 2.0 | 1.0 | 800 | $1,600 | $2.00 | 25d | 1 | 0.82mi |
| 1411 E Iron Bridge Way Spokane, WA | 3.0 | 1.0–2.0 | 826 | $3,150 | $3.81 | 15d | 6 | 1.06mi |
| 1036 E Desmet Ave Unit 5 Spokane, WA | 2.0 | 1.0 | 750 | $1,195 | $1.59 | 15d | 1 | 1.11mi |
| 827 E Ermina Ave Unit 1 Spokane, WA | 2.0 | 1.0 | 850 | $1,150 | $1.35 | 25d | 1 | 1.13mi |
| 2018 N Cincinnati St Rm 1 Spokane, WA | 3.0 | 1.0 | 820 | $625 | $0.76 | 25d | 1 | 1.17mi |
| 3316 N Nevada St Spokane, WA | 2.0 | 1.0 | 1250 | $1,395 | $1.12 | 25d | 1 | 1.41mi |
| 3717 N Perry St Unit 3717 Spokane, WA | 4.0 | 2.0 | 1450 | $2,050 | $1.41 | 25d | 1 | 1.42mi |
| 3717 N Perry St Unit 3719 Spokane, WA | 4.0 | 2.0 | 1450 | $1,950 | $1.34 | 25d | 1 | 1.42mi |
| 911 E Bridgeport Ave Unit A Spokane, WA | 2.0 | 1.0 | 800 | $1,120 | $1.40 | 25d | 1 | 1.44mi |
| 1822 E Pacific Ave Spokane, WA | 3.0 | 2.0 | 1400 | $2,000 | $1.43 | 15d | 1 | 1.46mi |
| 2112 N Astor St Spokane, WA | 3.0 | 1.0 | 1400 | $1,650 | $1.18 | 25d | 1 | 1.48mi |
Listing history 13 events
-
2026-04-19status Pending
-
2026-03-13status Active
-
2026-03-13price $220,000
-
2026-01-06price $245,000
-
2025-12-11price $250,000
-
2025-12-01price $255,000
-
2025-11-13$260,000 Active
-
2001-12-26historical
-
2001-10-15soldstatus $71,000 179-char remark
Show marketing remark (179 chars)
COZY CHARMER! VINYL FRAMED WINDOWS & VINYL SIDING, LARGE GARAGE-SHOP, HARDWOOD FLOORS, HOME WARRANTY. SOME APPLIANCES MAY STAY WITH FULL PRICE OFFER. 3RD BEDROOM NON-EGRESS.
-
2001-10-12soldstatus $71,000
-
2001-08-22$71,000 179-char remark
Show marketing remark (179 chars)
COZY CHARMER! VINYL FRAMED WINDOWS & VINYL SIDING, LARGE GARAGE-SHOP, HARDWOOD FLOORS, HOME WARRANTY. SOME APPLIANCES MAY STAY WITH FULL PRICE OFFER. 3RD BEDROOM NON-EGRESS.
-
2001-05-26$72,500
-
1997-07-15soldstatus $66,900
ⓘ Source: listings_history table (triggers on properties + properties_extension) + one-shot
backfill from property_details.listing_events for pre-trigger history.
Climate risk First Street
- Flood 1/10 Low FEMA zone X (unshaded) · 0% chance over 30 yrs
- Wildfire 2/10 Low
- Heat 3/10 Moderate 7 d/yr ≥94°F today · 15 d/yr by 30 yrs out
- Wind 1/10 Low
- Air quality 10/10 Extreme 19 unhealthy d/yr today · 21 by 30 yrs out
Nearby sold comps map
Loading sold comps map…
Walkable amenities ~0.75 mi
Loading nearby amenities…
Taxation est. · year 1
- Rental income
- $18,339
- − Mortgage interest
- −$12,323
- − Property taxes
- −$3,300
- − Insurance
- −$1,100
- − Repairs & maintenance
- −$1,467
- − Management
- −$1,467
- − Depreciation
- −$6,400
- Taxable loss
- −$7,719
- Est. tax savings @ 24.0%
- +$1,852
- After-tax cash flow
- $-1,904/yr
For passive investors: Depreciation is non-cash, so a rental often shows a tax loss while cash-flowing — sheltering income. Rental losses are passive: they offset passive income freely, and up to $25,000/yr can offset ordinary (W-2) income if you actively participate and your MAGI is under $100k (phasing out to $0 by $150k); unused losses carry forward. On sale, claimed depreciation is recaptured at up to 25%, and gains may owe capital-gains tax (a 1031 exchange can defer both). Figures are a year-1 estimate at your 24.0% rate — not tax advice; consult a CPA.
Schools (NCES district)
- District
- Spokane School District
- NCES district ID
- 5308250
- Math proficiency
- 47% ▲ 1.00%
- Reading proficiency
- 58% ▲ 1.00%
- Median HH income
- $43,187
- Composite
- 46.1/100
- National rank
- #5477
- State rank
- #136 of 291 in WA
Livability — Spokane
- Score
- 80/100
- State rank
- #93
- US rank
- #1822
Category grades
Schools grade is shown separately in the Schools card above.
Census & demographics
- Census place
- Spokane, WA
- County
- Spokane County · 496,401 people
- City population
- 298,820
- Metro
- Spokane-Spokane Valley, WA
- Population (ZIP)
- 32,770
- Household income
- $60,452
- Rent vs Own
- Severe rent burden
- 1557.0
Population outlook (Spokane County) Hauer SSP2
- Today (2025)
- 531,314 people
- By 2030
- 549,278 · +3.4%
- By 2040
- 577,822 · +8.8%
- By 2050
- 598,188 · +12.6%
- By 2075
- 630,744 · +18.7%
- By 2100
- 622,360 · +17.1%
Race, ethnicity, and origin ACS 2023
- Neighborhood character
- Predominantly White (76%)
- Race & ethnicity
- White 76% Two or more races 10% Hispanic / Latino 8% Black 4% Asian 3% Native American 1%
- Hispanic origin (detail)
- Mexican 5%
- Common ancestry
- Portuguese 3% Lithuanian 3% Slovak 3%
- Foreign-born
- 6% · Canada, Vietnam, Philippines
- Languages at home
- 90% English-only · Spanish 3% Russian/Polish/Slavic 1% Other Asian/Pacific 1%
Political lean MEDSL · Spokane
- 2024 margin
- Toss-up / Even · D 46.0% · R 51.0% · Other 3.0%
- 2008→2024 swing
- -3.8pp toward R · 2008: -1.1pp · 2024: -5.0pp
- All cycles
- 2024: R+5.0 2020: R+4.3 2016: R+8.3 2012: R+6.3 2008: R+1.1
Not yet ingested
- Civics
- —
Market trends
- HPI YoY
- ▼ -103.43%
- Current HPI
- 381.758
- Rent YoY
- ▲ 3.25%
- Metro
- Spokane-Spokane Valley, WA
- State GDP YoY
- ▲ 4.65%
- F500 in state
- 22
Industry mix (Fortune 500 HQ in WA)
| Industry | F500 HQs | Revenue |
|---|---|---|
| Retail | 2 | $269B |
|
||
| Technology / Retail | 1 | $638B |
|
||
| Technology | 1 | $245B |
|
||
| Telecommunications | 1 | $38B |
|
||
| Food / Beverage | 1 | $36B |
|
||
| Automotive / Trucks | 1 | $34B |
|
||
Price history
+228.8% since first listed13 events — show timeline
- 2026-04-19 Pending — SPOKANEMLS as Distributed by MLS Grid
- 2026-03-13 Relisted — SPOKANEMLS as Distributed by MLS Grid
- 2026-03-13 Price Changed $220,000 SPOKANEMLS as Distributed by MLS Grid
- 2026-01-06 Price Changed $245,000 SPOKANEMLS as Distributed by MLS Grid
- 2025-12-11 Price Changed $250,000 SPOKANEMLS as Distributed by MLS Grid
- 2025-12-01 Price Changed $255,000 SPOKANEMLS as Distributed by MLS Grid
- 2025-11-13 Listed $260,000 SPOKANEMLS as Distributed by MLS Grid
- 2001-12-26 Listing Removed — SPOKANEMLS as Distributed by MLS Grid
- 2001-10-15 Sold (MLS) $71,000 SPOKANEMLS as Distributed by MLS Grid
- 2001-10-12 Sold (Public Records) $71,000 Public Records
- 2001-08-22 Listed $71,000 SPOKANEMLS as Distributed by MLS Grid
- 2001-05-26 Listed $72,500 SPOKANEMLS as Distributed by MLS Grid
- 1997-07-15 Sold (Public Records) $66,900 Public Records
Property tax history
+0.3%/yrLatest (2026): $243 · -90.6% YoY. Source: county tax records.
Cash-flow waterfall
monthlySold comps — $/sqft
last 12 mo · ≤1 miLoading sold comps…