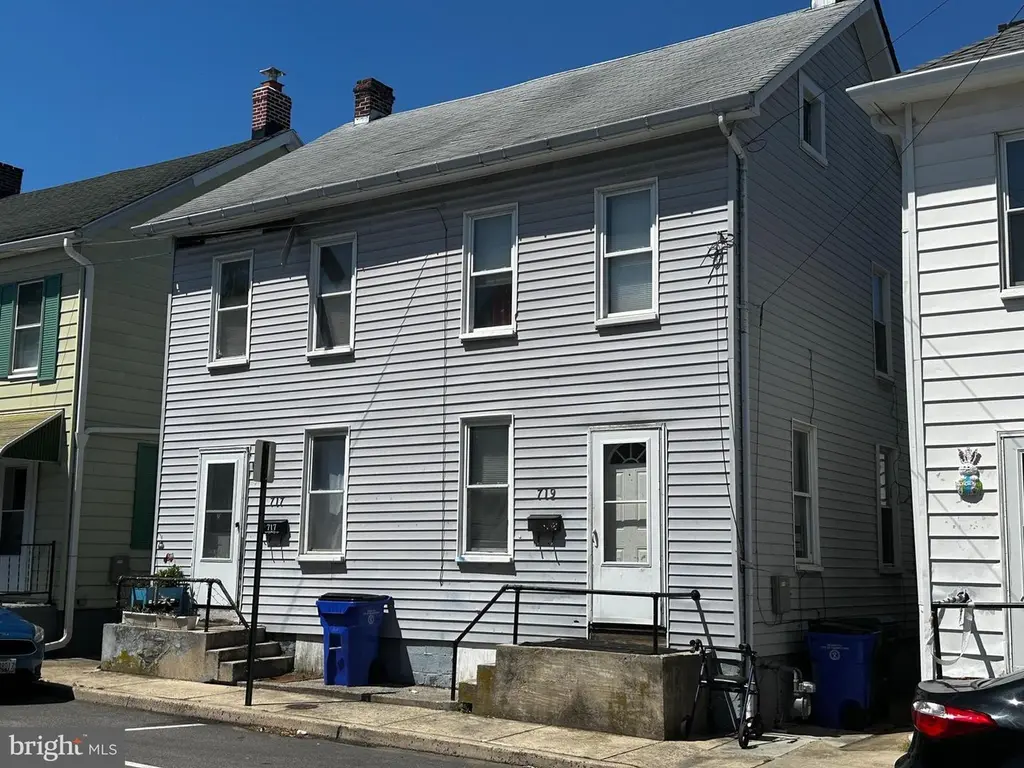
719 N Locust St · Hagerstown, MD
Flood risk 7/10 · Major
- FEMA flood zone
- X (unshaded)
- Chance of flooding over 30 yrs
- 0.99%
- Est. flood insurance / yr
- $473 – $860
Fire risk 1/10 · Minimal
- Est. fire insurance / yr
- $755 – $1,403
Heat risk 5/10 · Moderate
- Hot days now (above 101°F)
- 7 days/yr
- Hot days in 30 yrs
- 16 days/yr
Wind risk 2/10 · Minimal
- Chance of severe wind over 30 yrs
- 2.0%
Air-quality risk 1/10 · Minimal
- Unhealthy air days now
- 0 days/yr
- Unhealthy air days in 30 yrs
- 0 days/yr
Risk factors via First Street. Map © Google.
Why this score? — see what drove the C+ grade
The composite is a weighted blend of 9 inputs, each scored 0–100. Each bar is that input's sub-score; the figure is the points it added to the 100-point composite (weight × sub-score).
- Cash flow +23.2/30.0
- ARV discount +15.0/15.0
- DSCR +7.4/10.0
- 1% rule +5.1/10.0
- Livability +3.9/5.0
- Rent growth +3.5/5.0
- Condition / age +2.5/5.0
- Schools +2.3/10.0
- Appreciation +0.0/10.0
$147,000
🖨 Deal sheet 📄 Offer letter ✓ Due diligence
Listing remarks MLS
Prime Investment Opportunity with Established Income Streams This professionally managed half duplex home presents an exceptional opportunity for investors seeking stable cash flow. For those looking to expand their portfolio, this property can be acquired as part of a package with two additional fully occupied properties, 2 Duplexes.
Key facts
- 1,808 sq ft lot
- Built 1911
- Listed 169 days
Neighborhood map
What this means for you Summary
Snapshot
- This is a 3-bed/1.0-bath townhouse listed at $147k.
Deal economics
- At list price, monthly cash flow is $210 ($3k/yr) — positive.
- The deal already cash-flows at list — no discount required.
- Meets the 1% rule at list price ($1k rent vs $147k).
- Recommended offer: $129k (12.0% below list) — sets the bar for market timing.
- Cap rate 8.5% vs local median 4.4% in Hagerstown — top-decile yield for the area; either an underpriced asset or a hidden risk that comps aren't pricing in. Stress-test before assuming the spread holds.
Location & tenants
- Location reads 77/100 on livability (#83 in MD, #3,170 nationally) — a middle-class / working-renter tenant base. Strengths: commute A+, cost of living A+, health & safety A+; Watch: schools C-, crime F, employment F.
- Washingtion County Public Schools (suburban): math 18% / reading 33% proficiency, ranked #13 of 24 in MD (top 54%) — low school quality limits family demand, transient renter base, plan for 1-2y turnover.
- Market conditions: Rents rising fast (+4.0%/yr); 368 active listings in the ZIP; 40 comparable units currently listed for rent nearby; rentals lingering (median 44d on market — plan ~5-8 weeks vacancy on turnover, expect pricing pressure); 52% of comp listings sitting > 30 days — soft ceiling on asking rent; 232 units permitted in Washington County in 2024 (12 in 5+ unit buildings).
Forward outlook
- Local home prices are declining (-3.0%/yr); year-one equity from $1k of loan paydown is wiped out by about $4k of value loss. Plan a longer hold.
Negotiation context
- It's been on market 169 days — a 12% lower offer ($129k) is reasonable based on typical stale-listing flexibility.
- 8 sale attempts since 19y ago with the ask held roughly flat each time — persistent listings suggest the price (not the market) is what's stuck; bring a comps-based counter.
- Current owner paid $38k; list at $147k implies a 292% gain — meaningful room to come down on a strong offer.
Risks & watch-outs
- Watch-outs: flood insurance adds $56/mo; built in 1911 — expect roof / HVAC / electrical / plumbing capex.
- Climate carrying-cost: major flood risk; extreme-heat days projected 7→16/yr by 2055 (HVAC capex compounding) — expect insurance premiums to compound above CPI over the hold.
Questions for the listing agent
- It's been on market 169 days. Have you received any prior offers? Is the seller open to a 12% concession, seller financing, or rate buy-down credit?
- Built in 1911 — when were the roof, HVAC, electrical panel, plumbing, and water heater last replaced?
- What's the actual annual flood-insurance premium (NFIP or private), and is the property in a SFHA with mandatory coverage?
- Why hasn't it sold? Are there any deal-killer items the seller is aware of (foundation, flood, title, zoning, code violations)?
- Is there a deadline driving the sale (1031 exchange, divorce, estate, relocation)? That informs how much negotiation room exists.
- Crime grade is F in this area — have there been break-ins, vandalism, or insurance claims at this property in the last 3 years? What carrier currently insures it and at what premium?
- What's the average days-on-market for RENTAL listings here right now (not sales)? A rising rental-DOM trend means longer vacancies and softer asking-rent achievability than the comps imply.
- What's the recent tenant-quality profile in this submarket — average credit score on applications, eviction rate, late-payment / NSF rate, and stable-employment percentage? A property-management company in the area should have these aggregated.
- How much new for-sale + rental construction is in the pipeline within 1–3 miles? Heavy new supply typically softens prices + rents 12–24 months out; constrained supply supports both.
Investment metrics
- 1% rule
- 1.01% ✓
- Cap rate
- 8.46%
- Cash-on-cash
- 7.75%
- DSCR
- 1.34
- GRM
- 8.3
CMA / ARV
- ARV (median comp)
- $222,272
- List price
- $147,000
- Delta
- -33.86%
- Verdict
- UNDERPRICED
- Comps
- 20 within 1.0 mi
Show comp detail 12 sales within ~0.75 mi
| Address | Dist | Beds/Ba | Sqft | Sold | Price | $/sf | Match |
|---|---|---|---|---|---|---|---|
| 129 Mccomas St | 0.06mi | 3/2.0 | 1,144 (+7%) | 1mo | $179,500 | $157 | 82 |
| 649 N Mulberry St | 0.11mi | 3/1.0 | 1,064 (-1%) | 16mo | $45,000 | $42 | 80 |
| 651 N Mulberry St N | 0.11mi | 2/1.0 (-1) | 1,064 (-1%) | 16mo | $65,000 | $61 | 75 |
| 39 Charles St | 0.30mi | 3/1.0 | 1,120 (+4%) | 6mo | $158,900 | $142 | 74 |
| 606 N Mulberry St | 0.18mi | 3/1.5 | 1,205 (+12%) | 10mo | $170,000 | $141 | 61 |
| 119 N Mulberry St | 0.62mi | 2/1.0 (-1) | 1,000 (-7%) | 2mo | $155,000 | $155 | 53 |
| 428 Cook St | 0.73mi | 2/1.0 (-1) | 1,104 (+3%) | 3mo | $65,000 | $59 | 53 |
| 238 N Locust St | 0.47mi | 2/1.0 (-1) | 1,008 (-6%) | 14mo | $110,000 | $109 | 51 |
| 227 N Locust St | 0.49mi | 3/1.0 | 1,216 (+13%) | 7mo | $87,400 | $72 | 49 |
| 137 Randolph Ave | 0.47mi | 2/1.0 (-1) | 1,162 (+8%) | 15mo | $134,000 | $115 | 47 |
| 18 Belview Ave | 0.44mi | 2/1.0 (-1) | 1,230 (+15%) | 7mo | $174,900 | $142 | 44 |
| 330 N Cannon Ave | 0.46mi | 2/1.0 (-1) | 912 (-15%) | 13mo | $150,000 | $164 | 38 |
Match score weights: distance 35% · size 25% · config 20% · recency 20%. Top-matched comps best support the ARV.
Projected returns pro-forma
-3.0% appreciation · 4.0% rent growth · sell at horizon
- IRR
- -5.8%
- Equity multiple
- 0.78×
- Total profit
- $-8,935
- Equity at exit
- $21,918
- IRR
- 5.0%
- Equity multiple
- 1.38×
- Total profit
- $15,714
- Equity at exit
- $12,710
Cash invested: $41,160 (down + closing). Projections, not guarantees.
Landlord ↔ Tenant lean methodology
- Overall (STATE)
- 27 Tenant-Leaning
- State Maryland
- 27 Tenant-Leaning · D+14
- County
- — inherits STATE
- City
- — inherits STATE
ZIP-level market 21740
- Rents YoY
- 4.0%
- Active inventory
- 368
- Price-to-rent
- 8.3×
Monthly cashflow live
- Estimated rent
- $1,480 high interval (Pro) →
- Mortgage (P&I)
- −$771
- Tax from tax record
- −$72 /mo · $859/yr
- Insurance
- −$61
- Flood insurance flood zone
- −$56 /mo · $666/yr
- HOA
- −$0
- Vacancy / Maint / Mgmt
- −$311
- Net cashflow
- $210
Break-even live
UW: 25.0% down · 7.5% · 30yr · 1.5% tax · 5.0% vac · 8.0% maint · 8.0% mgmt
Financing live
Cash to close
- Down payment
- $36,750
- Closing costs
- $4,410
- Reserves months
- —
- Total cash needed
- —
Loan-product check · same deal, 3 products live
Conventional
25% down · 7.5% · 30yr
- Down + closing
- —
- Monthly P&I
- —
- Monthly cashflow
- —
- DSCR
- —
- Eligible?
- —
Personal DTI + credit; lowest rate.
DSCR
20% down · 8.5% · 30yr
- Down + closing
- —
- Monthly P&I
- —
- Monthly cashflow
- —
- DSCR
- —
- Eligible?
- —
No personal income docs; deal must DSCR.
Hard money
10% down · 12.0% · 12mo
- Down + closing
- —
- Monthly P&I
- —
- Monthly cashflow
- —
- DSCR
- —
- Eligible?
- —
Short-term bridge; refi at stabilization.
Rent comps 40 comps
| Address | Beds | Baths | Sqft | Rent | $/sqft | DOM | Units | Dist |
|---|---|---|---|---|---|---|---|---|
| 109 Fairground Ave Hagerstown, MD | 3.0 | 1.0 | 1470 | $1,600 | $1.09 | 13d | 1 | 0.04mi |
| 38 Wayside Ave Unit 2 Hagerstown, MD | 2.0 | 1.0 | 825 | $1,150 | $1.39 | 21d | 1 | 0.12mi |
| 804 Oak Hill Ave Unit A Hagerstown, MD | 2.0 | 1.0 | 1000 | $1,695 | $1.70 | 21d | 1 | 0.15mi |
| 715 Oak Hill Ave Unit 2N Hagerstown, MD | 2.0 | 1.0 | 1500 | $1,595 | $1.06 | 44d | 1 | 0.16mi |
| 715 Oak Hill Ave Unit 3N Hagerstown, MD | 2.0 | 1.0 | 1200 | $1,395 | $1.16 | 13d | 1 | 0.16mi |
| 629 Oak Hill Ave Unit 3 Hagerstown, MD | 2.0 | 1.0 | 1386 | $1,595 | $1.15 | 44d | 1 | 0.22mi |
| 441 N Potomac St Hagerstown, MD | 2.0 | 1.0 | 970 | $1,350 | $1.39 | 44d | 1 | 0.30mi |
| 327 N Mulberry St Hagerstown, MD | 2.0 | 1.0 | 700 | $1,030 | $1.47 | 21d | 1 | 0.38mi |
| 307 N Locust St Hagerstown, MD | 3.0 | 1.0 | 1140 | $1,490 | $1.31 | 44d | 1 | 0.40mi |
| 322 N Cannon Ave Hagerstown, MD | 3.0 | 1.5 | 1488 | $1,800 | $1.21 | 13d | 1 | 0.45mi |
| 27 Bethel St Hagerstown, MD | 2.0 | 1.0 | 954 | $950 | $1.00 | 44d | 1 | 0.47mi |
| 62 Bethel St Hagerstown, MD | 3.0 | 1.5 | 1088 | $1,700 | $1.56 | 44d | 1 | 0.49mi |
| 210 N Locust St Hagerstown, MD | 3.0 | 1.0 | 1476 | $1,275 | $0.86 | 21d | 1 | 0.50mi |
| 311 Jefferson St Unit 311 Hagerstown, MD | 3.0 | 1.5 | 1200 | $1,550 | $1.29 | 44d | 1 | 0.50mi |
| 207 N Mulberry St Unit 3 Hagerstown, MD | 2.0 | 1.0 | 940 | $1,130 | $1.20 | 21d | 1 | 0.52mi |
| 115 East Ave Unit 2 Hagerstown, MD | 2.0 | 1.0 | 1200 | $1,400 | $1.17 | 44d | 1 | 0.53mi |
| 235 East Ave Hagerstown, MD | 2.0 | 1.0 | 1200 | $1,200 | $1.00 | 13d | 1 | 0.56mi |
| 115 N Potomac St Unit 2 Hagerstown, MD | 2.0 | 1.0 | 1200 | $1,250 | $1.04 | 21d | 1 | 0.61mi |
| 42 E Franklin St Hagerstown, MD | 3.0 | 1.5 | 1200 | $1,350 | $1.12 | 44d | 1 | 0.61mi |
| 464 Peleton St Hagerstown, MD | 3.0 | 2.0 | 1253 | $2,025 | $1.62 | 13d | 1 | 0.63mi |
| 149 E Franklin St Hagerstown, MD | 2.0 | 1.0 | 850 | $1,250 | $1.47 | 44d | 1 | 0.64mi |
| 60 E Washington St Apt 1E Hagerstown, MD | 3.0 | 1.5 | 1300 | $1,500 | $1.15 | 21d | 1 | 0.71mi |
| 40 E Washington St Unit 2B Hagerstown, MD | 2.0 | 1.0 | 800 | $1,000 | $1.25 | 44d | 1 | 0.72mi |
| 103 E Washington St Unit 1E Hagerstown, MD | 3.0 | 1.0 | 1200 | $1,200 | $1.00 | 13d | 1 | 0.74mi |
| 92 W Washington St Unit 405 Hagerstown, MD | 2.0 | 1.0 | 1083 | $1,650 | $1.52 | 44d | 1 | 0.77mi |
| 92 W Washington St Unit 206 Hagerstown, MD | 2.0 | 2.0 | 803 | $1,450 | $1.81 | 44d | 1 | 0.77mi |
| 92 W Washington St Unit 410 Hagerstown, MD | 3.0 | 1.5 | 1415 | $1,795 | $1.27 | 44d | 1 | 0.77mi |
| 92 W Washington St Unit 403 Hagerstown, MD | 2.0 | 1.5 | 924 | $1,550 | $1.68 | 44d | 1 | 0.77mi |
| 421 Salem Ave Hagerstown, MD | 3.0 | 1.0 | 1256 | $1,550 | $1.23 | 21d | 1 | 0.78mi |
| 50 Rochester Pl Unit 23 Hagerstown, MD | 2.0 | 1.0 | 900 | $1,275 | $1.42 | 44d | 1 | 0.82mi |
| 505 W Church St Unit 1W 1W Hagerstown, MD | 2.0 | 1.0 | 700 | $1,140 | $1.63 | 21d | 1 | 0.85mi |
| 607 Salem Ave Hagerstown, MD | 4.0 | 1.0 | 1344 | $1,775 | $1.32 | 44d | 1 | 0.88mi |
| 616 George St Hagerstown, MD | 3.0 | 1.0 | 1034 | $1,600 | $1.55 | 44d | 1 | 0.96mi |
| 300 Northern Ave Unit 1C Hagerstown, MD | 2.0 | 1.0 | 875 | $1,200 | $1.37 | 44d | 1 | 0.98mi |
| 300 Northern Ave Unit 6A Hagerstown, MD | 2.0 | 1.0 | 865 | $1,200 | $1.39 | 13d | 1 | 0.98mi |
| 300 Northern Ave Unit 1F Hagerstown, MD | 2.0 | 1.0 | 865 | $1,200 | $1.39 | 21d | 1 | 0.99mi |
| 55 Manor Dr Unit 121-101 Hagerstown, MD | 2.0 | 1.0 | 808 | $1,576 | $1.95 | 44d | 1 | 1.04mi |
| 55 Manor Dr Unit 82-103 Hagerstown, MD | 3.0 | 1.0 | 945 | $1,670 | $1.77 | 44d | 1 | 1.04mi |
| 55 Manor Dr Unit 91-202 Hagerstown, MD | 2.0 | 1.0 | 808 | $1,436 | $1.78 | 13d | 1 | 1.04mi |
| 55 Manor Dr Unit 57-203 Hagerstown, MD | 2.0 | 1.0 | 808 | $1,503 | $1.86 | 13d | 1 | 1.04mi |
Listing history 33 events
-
2026-06-17days on market $147,000 Active 169 DOM
-
2026-06-16days on market $147,000 Active 168 DOM
-
2026-06-15days on market $147,000 Active 167 DOM
-
2026-06-14days on market $147,000 Active 165 DOM
-
2026-06-13days on market $147,000 Active 164 DOM
-
2026-06-10days on market $147,000 Active 162 DOM
-
2026-06-09days on market $147,000 Active 161 DOM
-
2026-06-08days on market $147,000 Active 160 DOM
-
2026-06-07days on market $147,000 Active 159 DOM
-
2026-06-03days on market $147,000 Active 155 DOM
-
2026-06-02days on market $147,000 Active 154 DOM
-
2026-06-01days on market $147,000 Active 153 DOM
-
2026-05-31days on market $147,000 Active 152 DOM
-
2026-05-30days on market $147,000 Active 151 DOM
-
2025-12-30$147,000 Active 336-char remark
Show marketing remark (336 chars)
Prime Investment Opportunity with Established Income Streams This professionally managed half duplex home presents an exceptional opportunity for investors seeking stable cash flow. For those looking to expand their portfolio, this property can be acquired as part of a package with two additional fully occupied properties, 2 Duplexes.
-
2025-06-30historical
-
2025-01-08$159,500 Active
-
2024-10-31historical
-
2024-04-27$159,500 Active
-
2016-01-20soldstatus $37,500
-
2016-01-15historical
-
2015-12-31soldstatus $37,500
-
2015-12-31soldstatus $37,500 Sold
-
2015-11-20status Contingent (No Kick Out)
-
2015-10-08$45,000 Active
-
2015-10-08$45,000
-
2015-09-13historical Expired
-
2015-09-13historical
-
2015-05-08Active
-
2015-05-08$69,900
-
2008-08-29historical
-
2007-12-13
-
2000-07-19soldstatus $82,000
ⓘ Source: listings_history table (triggers on properties + properties_extension) + one-shot
backfill from property_details.listing_events for pre-trigger history.
Tax reassessment forecast MD · Partial reset (capped growth)
- Current annual tax
- $859 · $72/mo
- Projected year-2 tax
- $1,231 · $103/mo
- Expected delta
- +$372/yr (+$31/mo · 43.3%)
ⓘ Screening estimate from a state-policy table — verify with the county assessor before closing.
Climate risk First Street
- Flood 7/10 Severe FEMA zone X (unshaded) · 99% chance over 30 yrs
- Wildfire 1/10 Low
- Heat 5/10 Major 7 d/yr ≥101°F today · 16 d/yr by 30 yrs out
- Wind 2/10 Low 2% chance of damaging wind over 30 yrs
- Air quality 1/10 Low 0 unhealthy d/yr today · 0 by 30 yrs out
Nearby sold comps map
Loading sold comps map…
Walkable amenities ~0.75 mi
Loading nearby amenities…
Taxation est. · year 1
- Rental income
- $17,765
- − Mortgage interest
- −$8,234
- − Property taxes
- −$859
- − Insurance
- −$1,402
- − Repairs & maintenance
- −$1,421
- − Management
- −$1,421
- − Depreciation
- −$4,276
- Taxable income
- $152
- Est. tax owed @ 24.0%
- −$36
- After-tax cash flow
- $2,487/yr
For passive investors: Depreciation is non-cash, so a rental often shows a tax loss while cash-flowing — sheltering income. Rental losses are passive: they offset passive income freely, and up to $25,000/yr can offset ordinary (W-2) income if you actively participate and your MAGI is under $100k (phasing out to $0 by $150k); unused losses carry forward. On sale, claimed depreciation is recaptured at up to 25%, and gains may owe capital-gains tax (a 1031 exchange can defer both). Figures are a year-1 estimate at your 24.0% rate — not tax advice; consult a CPA.
Schools (NCES district)
- District
- Washingtion County Public Schools
- NCES district ID
- 2400660
- Math proficiency
- 18% ▼ -20.00%
- Reading proficiency
- 33% ▼ -17.00%
- Median HH income
- $54,784
- Composite
- 22.87/100
- National rank
- #8007
- State rank
- #13 of 24 in MD
Livability — Hagerstown
- Score
- 77/100
- State rank
- #83
- US rank
- #3170
Category grades
Schools grade is shown separately in the Schools card above.
Census & demographics
- Census place
- Hagerstown, MD
- County
- Washington County · 98,861 people
- City population
- 64,792
- Metro
- Hagerstown-Martinsburg, MD-WV
- Population (ZIP)
- 64,792
- Household income
- $62,873
- Rent vs Own
- Severe rent burden
- 2832.0
Population outlook (Washington County) Hauer SSP2
- Today (2025)
- 151,614 people
- By 2030
- 151,455 · -0.1%
- By 2040
- 150,097 · -1.0%
- By 2050
- 148,193 · -2.3%
- By 2075
- 146,581 · -3.3%
- By 2100
- 138,025 · -9.0%
Race, ethnicity, and origin ACS 2023
- Neighborhood character
- Majority White (64%)
- Race & ethnicity
- White 64% Black 18% Two or more races 10% Hispanic / Latino 10% Asian 2%
- Hispanic origin (detail)
- Mexican 2% Puerto Rican 2% Dominican 2%
- Common ancestry
- Romanian 2% Lithuanian 1% Slovak 1%
- Foreign-born
- 9% · Canada, China
- Languages at home
- 86% English-only · Spanish 9% French/Haitian/Cajun 1% Chinese 1%
Political lean MEDSL · Washington
- 2024 margin
- Strong R (+23.0) · D 37.3% · R 60.4% · Other 2.3%
- 2008→2024 swing
- -10.2pp toward R · 2008: -12.9pp · 2024: -23.0pp
- All cycles
- 2024: R+23.0 2020: R+20.9 2016: R+32.4 2012: R+18.5 2008: R+12.9
Not yet ingested
- Civics
- —
Market trends
- HPI YoY
- ▼ -248.38%
- Current HPI
- 264.8018
- Rent YoY
- ▲ 4.00%
- Metro
- Hagerstown-Martinsburg, MD-WV
- State GDP YoY
- ▲ 2.97%
- F500 in state
- 12
Industry mix (Fortune 500 HQ in MD)
| Industry | F500 HQs | Revenue |
|---|---|---|
| Aerospace / Defense | 1 | $71B |
|
||
| Utilities | 1 | $25B |
|
||
| Hotels | 1 | $24B |
|
||
| Consumer Goods | 1 | $7B |
|
||
| Real Estate | 1 | $6B |
|
||
| Chemicals | 1 | $2B |
|
||
Price history
+79.3% since first listed19 events — show timeline
- 2025-12-30 Listed $147,000 BRIGHT MLS
- 2025-06-30 Listing Removed — BRIGHT MLS
- 2025-01-08 Listed $159,500 BRIGHT MLS
- 2024-10-31 Listing Removed — BRIGHT MLS
- 2024-04-27 Listed $159,500 BRIGHT MLS
- 2016-01-20 Sold (Public Records) $37,500 Public Records
- 2016-01-15 Listing Removed — BRIGHT MLS
- 2015-12-31 Sold (MLS) $37,500 MRIS
- 2015-12-31 Sold (MLS) $37,500 BRIGHT MLS
- 2015-11-20 Pending — MRIS
- 2015-10-08 Listed $45,000 MRIS
- 2015-10-08 Listed $45,000 BRIGHT MLS
- 2015-09-13 Listing Removed — BRIGHT MLS
- 2015-09-13 Delisted — MRIS
- 2015-05-08 Listed — MRIS
- 2015-05-08 Listed $69,900 BRIGHT MLS
- 2008-08-29 Delisted — MRIS
- 2007-12-13 Listed — MRIS
- 2000-07-19 Sold (Public Records) $82,000 Public Records
Property tax history
-2.0%/yrLatest (2025): $859 · +13.8% YoY. Source: county tax records.
Cash-flow waterfall
monthlySold comps — $/sqft
last 12 mo · ≤1 miLoading sold comps…