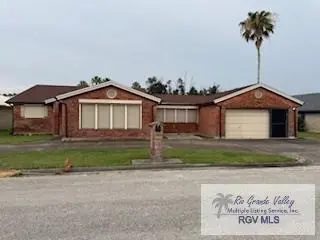
9 Shenandoah River Dr · Brownsville, TX
Flood risk 5/10 · Moderate
- FEMA flood zone
- X (unshaded)
- Chance of flooding over 30 yrs
- 0.67%
- Est. flood insurance / yr
- $507 – $1,088
Fire risk 4/10 · Minor
- Est. fire insurance / yr
- $1,222 – $2,270
Heat risk 9/10 · Severe
- Hot days now (above 110°F)
- 7 days/yr
- Hot days in 30 yrs
- 24 days/yr
Wind risk 9/10 · Severe
- Chance of severe wind over 30 yrs
- 99.0%
Air-quality risk 1/10 · Minimal
- Unhealthy air days now
- 0 days/yr
- Unhealthy air days in 30 yrs
- 0 days/yr
Risk factors via First Street. Map © Google.
Why this score? — see what drove the C- grade
The composite is a weighted blend of 9 inputs, each scored 0–100. Each bar is that input's sub-score; the figure is the points it added to the 100-point composite (weight × sub-score).
- ARV discount +15.0/15.0
- Cash flow +13.5/30.0
- Rent growth +5.0/5.0
- 1% rule +4.8/10.0
- DSCR +4.1/10.0
- Livability +4.0/5.0
- Condition / age +2.5/5.0
- Schools +2.2/10.0
- Appreciation +0.0/10.0
$199,000
🖨 Deal sheet 📄 Offer letter ✓ Due diligence
Listing remarks MLS
This 2- bedroom, 2-Bath home offers incredible potential in a highly sought-after 55+gated community. in addition to the main living areas, the property includes two versatile bonus rooms perfect for a home office, guest space, or hobby room. While the home needs a little TLC, it presents a wonderful opportunity to customize and make it your own. guard-gated neighborhood, residents enjoy a wide range of amenities including a golf course and pickleball courts.
Key facts
- Gated community
- Pickleball courts
- Golf course
Tags
Neighborhood map
What this means for you Summary
Snapshot
- This is a 2-bed/2.0-bath single-family listed at $199k.
Deal economics
- At list price, monthly cash flow is $8 ($101/yr) — positive.
- The deal already cash-flows at list — no discount required.
- To meet the 1% rule (rent ≥ 1% of price), the offer needs to be $196k (1.7% below list).
- Recommended offer: $175k (12.0% below list) — sets the bar for market timing.
- Cap rate 6.3% vs local median 5.0% in Brownsville — meaningfully above typical; check what's discounted (condition, days-on-market, listing class) to confirm the premium yield is real.
Location & tenants
- Location reads 79/100 on livability (#62 in TX, #2,311 nationally) — a middle-class / working-renter tenant base. Strengths: commute A+, cost of living A+, housing A+; Watch: schools C-, amenities D, crime D-.
- Brownsville ISD (urban): math 20% / reading 34% proficiency, ranked #710 of 826 in TX (top 86%) — low school quality limits family demand, transient renter base, plan for 1-2y turnover; 83% free/reduced lunch — lower-income household profile, screen leases tightly.
- Market conditions: Rents rising fast (+11.4%/yr); 346 active listings in the ZIP; 4 comparable units currently listed for rent nearby; rentals lingering (median 44d on market — plan ~5-8 weeks vacancy on turnover, expect pricing pressure); 50% of comp listings sitting > 30 days — soft ceiling on asking rent; 2,326 units permitted in Cameron County in 2024 (503 in 5+ unit buildings).
- At $1,956/mo this rent would consume 47% of the median local household income ($50k/yr) (locally 1800% of renters already pay >50% of income on rent) — very limited rent-growth headroom before tenants either downsize or default.
Forward outlook
- Local home prices are declining (-3.0%/yr); year-one equity from $1k of loan paydown is wiped out by about $6k of value loss. Plan a longer hold.
- Cameron County population projected at +3% by 2050 — modest demand growth; plan on rents tracking national, not racing it.
Negotiation context
- It's been on market 148 days — a 12% lower offer ($175k) is reasonable based on typical stale-listing flexibility.
Risks & watch-outs
- Climate carrying-cost: moderate flood risk; severe wind risk, 99% chance of damaging wind over 30y; extreme-heat days projected 7→24/yr by 2055 (HVAC capex compounding) — expect insurance premiums to compound above CPI over the hold.
Questions for the listing agent
- It's been on market 148 days. Have you received any prior offers? Is the seller open to a 12% concession, seller financing, or rate buy-down credit?
- Why hasn't it sold? Are there any deal-killer items the seller is aware of (foundation, flood, title, zoning, code violations)?
- Is there a deadline driving the sale (1031 exchange, divorce, estate, relocation)? That informs how much negotiation room exists.
- Crime grade is D in this area — have there been break-ins, vandalism, or insurance claims at this property in the last 3 years? What carrier currently insures it and at what premium?
- What's the average days-on-market for RENTAL listings here right now (not sales)? A rising rental-DOM trend means longer vacancies and softer asking-rent achievability than the comps imply.
- What's the recent tenant-quality profile in this submarket — average credit score on applications, eviction rate, late-payment / NSF rate, and stable-employment percentage? A property-management company in the area should have these aggregated.
- How much new for-sale + rental construction is in the pipeline within 1–3 miles? Heavy new supply typically softens prices + rents 12–24 months out; constrained supply supports both.
Investment metrics
- 1% rule
- 0.98% ✗
- Cap rate
- 6.34%
- Cash-on-cash
- 0.18%
- DSCR
- 1.01
- GRM
- 8.5
CMA / ARV
- ARV (median comp)
- $279,945
- List price
- $199,000
- Delta
- -28.91%
- Verdict
- UNDERPRICED
- Comps
- 6 within 1.0 mi
Show comp detail 1 sale within ~0.75 mi
| Address | Dist | Beds/Ba | Sqft | Sold | Price | $/sf | Match |
|---|---|---|---|---|---|---|---|
| 4567 River Oak Cir | 0.50mi | 3/2.5 (+1) | 1,706 (-7%) | 13mo | $297,000 | $174 | 46 |
Match score weights: distance 35% · size 25% · config 20% · recency 20%. Top-matched comps best support the ARV.
Projected returns pro-forma
-3.0% appreciation · 8.0% rent growth · sell at horizon
- IRR
- -9.9%
- Equity multiple
- 0.62×
- Total profit
- $-21,247
- Equity at exit
- $29,672
- IRR
- 5.8%
- Equity multiple
- 1.53×
- Total profit
- $29,749
- Equity at exit
- $17,206
Cash invested: $55,720 (down + closing). Projections, not guarantees.
Landlord ↔ Tenant lean methodology
- Overall (STATE)
- 87 Strongly Landlord-Friendly
- State Texas
- 87 Strongly Landlord-Friendly · R+5
- County
- — inherits STATE
- City
- — inherits STATE
ZIP-level market 78520
- Home prices YoY
- -19.8%
- Rents YoY
- 11.4%
- Active inventory
- 346
- Price-to-rent
- 8.5×
Monthly cashflow live
- Estimated rent
- $1,956 medium interval (Pro) →
- Mortgage (P&I)
- −$1,044
- Tax from tax record
- −$410 /mo · $4,919/yr
- Insurance
- −$83
- HOA
- −$0
- Vacancy / Maint / Mgmt
- −$411
- Net cashflow
- $8
Break-even live
UW: 25.0% down · 7.5% · 30yr · 1.5% tax · 5.0% vac · 8.0% maint · 8.0% mgmt
Financing live
Cash to close
- Down payment
- $49,750
- Closing costs
- $5,970
- Reserves months
- —
- Total cash needed
- —
Loan-product check · same deal, 3 products live
Conventional
25% down · 7.5% · 30yr
- Down + closing
- —
- Monthly P&I
- —
- Monthly cashflow
- —
- DSCR
- —
- Eligible?
- —
Personal DTI + credit; lowest rate.
DSCR
20% down · 8.5% · 30yr
- Down + closing
- —
- Monthly P&I
- —
- Monthly cashflow
- —
- DSCR
- —
- Eligible?
- —
No personal income docs; deal must DSCR.
Hard money
10% down · 12.0% · 12mo
- Down + closing
- —
- Monthly P&I
- —
- Monthly cashflow
- —
- DSCR
- —
- Eligible?
- —
Short-term bridge; refi at stabilization.
Rent comps 4 comps
| Address | Beds | Baths | Sqft | Rent | $/sqft | DOM | Units | Dist |
|---|---|---|---|---|---|---|---|---|
| 33 Shenandoah River Dr Brownsville, TX | 2.0 | 2.0 | 1579 | $2,000 | $1.27 | 13d | 1 | 0.11mi |
| 5105 River Dr #5105 , TX | 3.0 | 2.5 | 1755 | $2,300 | $1.31 | 43d | 1 | 0.60mi |
| 4704 River Oak Cir Brownsville, TX | 3.0 | 2.5 | 1785 | $2,300 | $1.29 | 43d | 1 | 0.64mi |
| 4671 River Oak Cir Brownsville, TX | 3.0 | 2.5 | 1790 | $2,300 | $1.28 | 13d | 1 | 0.68mi |
Listing history 18 events
-
2026-06-18days on market $199,000 Active 148 DOM
-
2026-06-17days on market $199,000 Active 147 DOM
-
2026-06-16days on market $199,000 Active 146 DOM
-
2026-06-15days on market $199,000 Active 145 DOM
-
2026-06-14days on market $199,000 Active 143 DOM
-
2026-06-13days on market $199,000 Active 142 DOM
-
2026-06-10days on market $199,000 Active 140 DOM
-
2026-06-09days on market $199,000 Active 139 DOM
-
2026-06-08days on market $199,000 Active 138 DOM
-
2026-06-07days on market $199,000 Active 137 DOM
-
2026-06-05days on market $199,000 Active 134 DOM
-
2026-06-03days on market $199,000 Active 133 DOM
-
2026-06-02days on market $199,000 Active 132 DOM
-
2026-06-01days on market $199,000 Active 131 DOM
-
2026-05-31days on market $199,000 Active 130 DOM
-
2026-05-30days on market $199,000 Active 129 DOM
-
2026-01-21$199,000 Active 463-char remark
Show marketing remark (463 chars)
This 2- bedroom, 2-Bath home offers incredible potential in a highly sought-after 55+gated community. in addition to the main living areas, the property includes two versatile bonus rooms perfect for a home office, guest space, or hobby room. While the home needs a little TLC, it presents a wonderful opportunity to customize and make it your own. guard-gated neighborhood, residents enjoy a wide range of amenities including a golf course and pickleball courts.
-
2025-09-05price $199,000
ⓘ Source: listings_history table (triggers on properties + properties_extension) + one-shot
backfill from property_details.listing_events for pre-trigger history.
Tax reassessment forecast TX · Resets to sale price
- Current annual tax
- $4,919 · $410/mo
- Projected year-2 tax
- $4,919 · $410/mo
- Expected delta
- $0/yr ($0/mo · 0.0%)
ⓘ Screening estimate from a state-policy table — verify with the county assessor before closing.
Climate risk First Street
- Flood 5/10 Major FEMA zone X (unshaded) · 67% chance over 30 yrs
- Wildfire 4/10 Moderate
- Heat 9/10 Extreme 7 d/yr ≥110°F today · 24 d/yr by 30 yrs out
- Wind 9/10 Extreme 99% chance of damaging wind over 30 yrs
- Air quality 1/10 Low 0 unhealthy d/yr today · 0 by 30 yrs out
Nearby sold comps map
Loading sold comps map…
Walkable amenities ~0.75 mi
Loading nearby amenities…
Taxation est. · year 1
- Rental income
- $23,466
- − Mortgage interest
- −$11,147
- − Property taxes
- −$4,919
- − Insurance
- −$995
- − Repairs & maintenance
- −$1,877
- − Management
- −$1,877
- − Depreciation
- −$5,789
- Taxable loss
- −$3,139
- Est. tax savings @ 24.0%
- +$753
- After-tax cash flow
- $854/yr
For passive investors: Depreciation is non-cash, so a rental often shows a tax loss while cash-flowing — sheltering income. Rental losses are passive: they offset passive income freely, and up to $25,000/yr can offset ordinary (W-2) income if you actively participate and your MAGI is under $100k (phasing out to $0 by $150k); unused losses carry forward. On sale, claimed depreciation is recaptured at up to 25%, and gains may owe capital-gains tax (a 1031 exchange can defer both). Figures are a year-1 estimate at your 24.0% rate — not tax advice; consult a CPA.
Schools (NCES district)
- District
- Brownsville ISD
- NCES district ID
- 4811680
- Math proficiency
- 20% ▼ -36.00%
- Reading proficiency
- 34% ▼ -13.00%
- Median HH income
- $30,490
- Composite
- 21.8/100
- National rank
- #8249
- State rank
- #710 of 826 in TX
Livability — Brownsville
- Score
- 79/100
- State rank
- #62
- US rank
- #2311
Category grades
Schools grade is shown separately in the Schools card above.
Census & demographics
- Census place
- Brownsville, TX
- County
- Cameron County · 310,734 people
- City population
- 212,132
- Metro
- Brownsville-Harlingen, TX
- Population (ZIP)
- 64,740
- Household income
- $50,116
- Rent vs Own
- Severe rent burden
- 1800.0
Population outlook (Cameron County) Hauer SSP2
- Today (2025)
- 441,603 people
- By 2030
- 448,113 · +1.5%
- By 2040
- 456,385 · +3.3%
- By 2050
- 456,294 · +3.3%
- By 2075
- 423,851 · -4.0%
- By 2100
- 342,787 · -22.4%
Race, ethnicity, and origin ACS 2023
- Neighborhood character
- Predominantly Hispanic (93%)
- Race & ethnicity
- Hispanic / Latino 93% Two or more races 44% White 6%
- Hispanic origin (detail)
- Mexican 88%
- Foreign-born
- 26% · Canada
- Languages at home
- 18% English-only · Spanish 82%
Political lean MEDSL · Cameron
- 2024 margin
- Lean R (+5.8) · D 46.7% · R 52.5%
- 2008→2024 swing
- -34.6pp toward R · 2008: 28.8pp · 2024: -5.8pp
- All cycles
- 2024: R+5.8 2020: D+13.2 2016: D+32.5 2012: D+32.4 2008: D+28.8
Not yet ingested
- Civics
- —
Market trends
- HPI YoY
- ▼ -52.91%
- Current HPI
- 214.4335
- Rent YoY
- ▲ 11.41%
- Metro
- Brownsville-Harlingen, TX
- State GDP YoY
- ▲ 3.95%
- F500 in state
- 110
Industry mix (Fortune 500 HQ in TX)
| Industry | F500 HQs | Revenue |
|---|---|---|
| Energy | 16 | $1,198B |
|
||
| Technology | 5 | $198B |
|
||
| Engineering / Construction | 4 | $72B |
|
||
| Energy Services | 3 | $60B |
|
||
| Utilities | 3 | $41B |
|
||
| Healthcare | 2 | $330B |
|
||
Price history
+0.0% since first listed2 events — show timeline
- 2026-01-21 Listed $199,000 RGVMLS
- 2025-09-05 Price Changed $199,000 RGVMLS
Property tax history
+1.1%/yrLatest (2025): $4,919 · +14.7% YoY. Source: county tax records.
Cash-flow waterfall
monthlySold comps — $/sqft
last 12 mo · ≤1 miLoading sold comps…