42628 Mystery Ln · Magnolia, TX
Flood risk No data
- FEMA flood zone
- —
- Chance of flooding over 30 yrs
- —
- Est. flood insurance / yr
- —
Fire risk No data
- Est. fire insurance / yr
- —
Heat risk No data
- Hot days now (above threshold)
- —
- Hot days in 30 yrs
- —
Wind risk No data
- Chance of severe wind over 30 yrs
- —
Air-quality risk No data
- Unhealthy air days now
- —
- Unhealthy air days in 30 yrs
- —
Risk factors via First Street. Map © Google.
Why this score? — see what drove the F grade
The composite is a weighted blend of 9 inputs, each scored 0–100. Each bar is that input's sub-score; the figure is the points it added to the 100-point composite (weight × sub-score).
- Appreciation +10.0/10.0
- Cash flow +6.1/30.0
- Schools +3.9/10.0
- Livability +3.7/5.0
- ARV discount +3.3/15.0
- Rent growth +2.6/5.0
- Condition / age +2.5/5.0
- 1% rule +1.7/10.0
- DSCR +0.5/10.0
$323,493
🖨 Deal sheet 📄 Offer letter ✓ Due diligence
Listing remarks
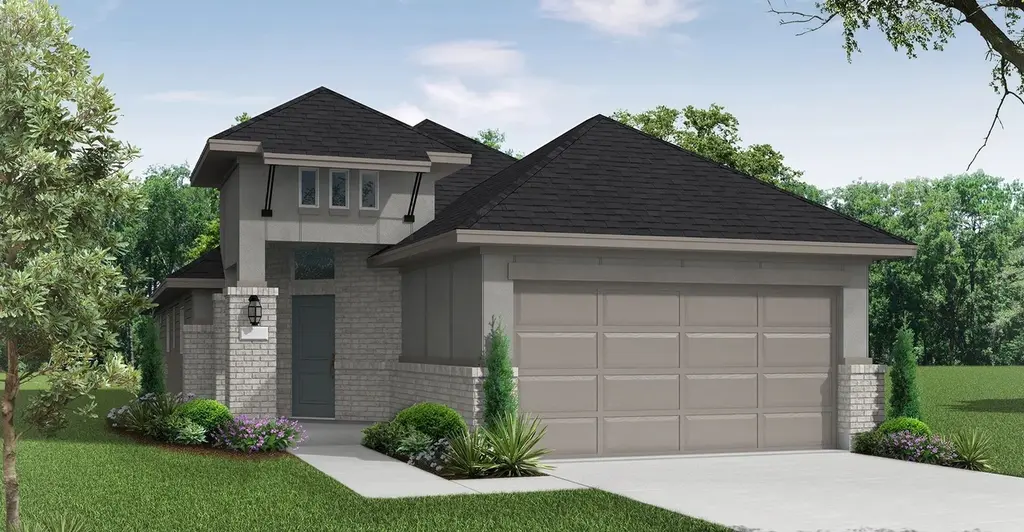
The Leona floor plan is a charming one-story design that perfectly combines space and convenience. Boasting 4 bedrooms and 2 bathrooms, this home provides a versatile layout tailored to meet the needs of families or those who love hosting guests. The open design of the living areas fosters connection, with the kitchen seamlessly flowing into the dining space and family room-ideal for both everyday life and special gatherings. The primary suite offers a peaceful retreat, complete with a private bathroom and a generously sized walk-in closet. The additional three bedrooms are thoughtfully positioned, offering flexibility for children, visitors, or even a home office. The two-car garage ensure
Key facts
- 6,192 sq ft lot
- 2 garage spots
- Built 2026
Property features AI
Finance
- Other: Address: 42628 Mystery Ln, Magnolia TX 77354; Listing provided by Zillow; information deemed reliable but not guaranteed
- Financial info: List price $323,493
Exterior
- Parking: 2-car garage (2 total parking spaces)
- Home design: Single-family property; Leona plan
- Exterior features: Living area of 1,739
Interior
- Bedrooms: 4 bedrooms
- Bathrooms: 2 full bathrooms
- Interior features: Spec home (Leona plan); Active listing
Neighborhood map
What this means for you Summary
Snapshot
- This is a 4-bed/2.0-bath single-family listed at $323k.
Deal economics
- At list price, monthly cash flow is $-600 ($-7k/yr) — negative.
- To cash-flow at today's rent, offer at most $237k (26.8% below list).
- To meet the 1% rule (rent ≥ 1% of price), the offer needs to be $217k (33.1% below list).
- Recommended offer: $217k (33.1% below list) — sets the bar for 1% rule.
Location & tenants
- Location reads 73/100 on livability (#222 in TX) — a middle-class / working-renter tenant base. Strengths: crime A+, cost of living A+, housing A+; Watch: schools D+, amenities F, commute F.
- Magnolia ISD (rural): math 42% / reading 45% proficiency, ranked #247 of 826 in TX (top 30%) — families likely to look elsewhere, expect single-tenant / working-renter base with shorter leases.
- Market conditions: Rents flat; 1604 active listings in the ZIP; high-income renter base; 13,259 units permitted in Montgomery County in 2024 (1,402 in 5+ unit buildings).
Forward outlook
- In year one you build about $35k of equity ($2k loan paydown + $32k appreciation (10.0% local appreciation)).
- Montgomery County population projected at +65% by 2050 — long-run rental-demand tailwind backs the buy-and-hold thesis.
- By year 2, paydown + projected appreciation supports a ~$56k cash-out refi (75% LTV) — recoverable capital for the next deal without selling this one.
Negotiation context
- Only 7 days on market — expect competitive offers; lowballing is unlikely to land.
Questions for the listing agent
- What do current leases actually rent for vs. the listed asking? Can we see a recent rent roll and the last 12 months of T-12 income?
- What does the HOA fee cover, when was the last increase, and are there any pending special assessments or reserve-fund shortfalls?
- Is there a deadline driving the sale (1031 exchange, divorce, estate, relocation)? That informs how much negotiation room exists.
- Schools are D-rated, which usually means shorter tenancies and higher turnover. Who's the typical renter profile here, and what's been the actual vacancy rate?
- The area grade is low — what's the realistic commute time and amenity access for the typical tenant pool here? Any planned neighborhood developments (good or bad) we should know about?
- What's the average days-on-market for RENTAL listings here right now (not sales)? A rising rental-DOM trend means longer vacancies and softer asking-rent achievability than the comps imply.
- What's the recent tenant-quality profile in this submarket — average credit score on applications, eviction rate, late-payment / NSF rate, and stable-employment percentage? A property-management company in the area should have these aggregated.
- How much new for-sale + rental construction is in the pipeline within 1–3 miles? Heavy new supply typically softens prices + rents 12–24 months out; constrained supply supports both.
Investment metrics
- 1% rule
- 0.67% ✗
- Cap rate
- 4.07%
- Cash-on-cash
- -7.95%
- DSCR
- 0.65
- GRM
- 12.4
CMA / ARV
- ARV (on-the-fly)
- $295,630
- Comps found
- 12
Show comp detail 12 sales within ~0.75 mi
| Address | Dist | Beds/Ba | Sqft | Sold | Price | $/sf | Match |
|---|---|---|---|---|---|---|---|
| 42563 Rustico Rd | 0.09mi | 4/2.0 | 1,739 (0%) | 1mo | $289,990 | $167 | 95 |
| 42676 Mystery Ln | 0.07mi | 4/2.0 | 1,739 (0%) | 3mo | $299,990 | $173 | 94 |
| 42559 Rustico Rd | 0.09mi | 3/2.0 (-1) | 1,644 (-6%) | 3mo | $279,990 | $170 | 79 |
| 42710 Loma Vista Ct | 0.37mi | 3/2.0 (-1) | 1,741 (+0%) | 0mo | $314,990 | $181 | 77 |
| 42668 Mystery Ln | 0.06mi | 4/2.0 | 1,942 (+12%) | 3mo | $319,990 | $165 | 75 |
| 42548 Edmund Rucker Ln | 0.08mi | 4/3.0 | 1,942 (+12%) | 1mo | $314,900 | $162 | 72 |
| 1338 Lakeside Creek Rd | 0.28mi | 3/2.0 (-1) | 1,831 (+5%) | 3mo | $280,000 | $153 | 70 |
| 42591 Rustico Rd | 0.08mi | 3/2.0 (-1) | 1,950 (+12%) | 2mo | $349,900 | $179 | 69 |
| 42635 Mystery Ln | 0.03mi | 3/2.0 (-1) | 1,984 (+14%) | 4mo | $336,900 | $170 | 67 |
| 42548 Rustico Rd | 0.08mi | 3/2.5 (-1) | 1,939 (+12%) | 4mo | $323,990 | $167 | 66 |
| 42595 Rustico Rd | 0.09mi | 3/2.0 (-1) | 1,984 (+14%) | 2mo | $371,900 | $187 | 66 |
| 42715 Loma Vista Ct | 0.37mi | 3/2.0 (-1) | 1,866 (+7%) | 0mo | $328,990 | $176 | 65 |
Match score weights: distance 35% · size 25% · config 20% · recency 20%. Top-matched comps best support the ARV.
Projected returns pro-forma
10.0% appreciation · 0.32% rent growth · sell at horizon
- IRR
- 18.0%
- Equity multiple
- 2.46×
- Total profit
- $132,378
- Equity at exit
- $291,428
- IRR
- 16.4%
- Equity multiple
- 5.52×
- Total profit
- $409,701
- Equity at exit
- $628,476
Cash invested: $90,578 (down + closing). Projections, not guarantees.
Landlord ↔ Tenant lean methodology
- Overall (STATE)
- 87 Strongly Landlord-Friendly
- State Texas
- 87 Strongly Landlord-Friendly · R+5
- County
- — inherits STATE
- City
- — inherits STATE
ZIP-level market 77354
- Home prices YoY
- 2.4%
- Rents YoY
- 0.3%
- Active inventory
- 1604
- Price-to-rent
- 12.4×
Monthly cashflow live
- Estimated rent
- $2,166 medium interval (Pro) →
- Mortgage (P&I)
- −$1,696
- Tax est. 1.5%
- −$404 /mo · $4,852/yr
- Insurance
- −$135
- HOA
- −$75
- Vacancy / Maint / Mgmt
- −$455
- Net cashflow
- $-600
Break-even live
UW: 25.0% down · 7.5% · 30yr · 1.5% tax · 5.0% vac · 8.0% maint · 8.0% mgmt
Financing live
Cash to close
- Down payment
- $80,873
- Closing costs
- $9,705
- Reserves months
- —
- Total cash needed
- —
Loan-product check · same deal, 3 products live
Conventional
25% down · 7.5% · 30yr
- Down + closing
- —
- Monthly P&I
- —
- Monthly cashflow
- —
- DSCR
- —
- Eligible?
- —
Personal DTI + credit; lowest rate.
DSCR
20% down · 8.5% · 30yr
- Down + closing
- —
- Monthly P&I
- —
- Monthly cashflow
- —
- DSCR
- —
- Eligible?
- —
No personal income docs; deal must DSCR.
Hard money
10% down · 12.0% · 12mo
- Down + closing
- —
- Monthly P&I
- —
- Monthly cashflow
- —
- DSCR
- —
- Eligible?
- —
Short-term bridge; refi at stabilization.
HOA detail
- Monthly dues
- $75 · $900/yr
Listing history 12 events
-
2026-06-18days on market $323,493 Active 7 DOM
-
2026-06-17days on market $323,493 Active 6 DOM
-
2026-06-16days on market $323,493 Active 5 DOM
-
2026-06-15days on market $323,493 Active 4 DOM
-
2026-06-13days on market $323,493 Active 2 DOM
-
2026-06-09days on market $323,493 Active 10 DOM
-
2026-06-08days on market $323,493 Active 9 DOM
-
2026-06-07days on market $323,493 Active 8 DOM
-
2026-06-04days on market $323,493 Active 5 DOM
-
2026-06-03days on market $323,493 Active 4 DOM
-
2026-06-02days on market $323,493 Active 3 DOM
-
2026-06-01days on market $323,493 Active 2 DOM
ⓘ Source: listings_history table (triggers on properties + properties_extension) + one-shot
backfill from property_details.listing_events for pre-trigger history.
Nearby sold comps map
Loading sold comps map…
Walkable amenities ~0.75 mi
Loading nearby amenities…
Taxation est. · year 1
- Rental income
- $25,988
- − Mortgage interest
- −$18,121
- − Property taxes
- −$4,852
- − Insurance
- −$1,617
- − Repairs & maintenance
- −$2,079
- − Management
- −$2,079
- − HOA
- −$900
- − Depreciation
- −$9,411
- Taxable loss
- −$13,071
- Est. tax savings @ 24.0%
- +$3,137
- After-tax cash flow
- $-4,059/yr
For passive investors: Depreciation is non-cash, so a rental often shows a tax loss while cash-flowing — sheltering income. Rental losses are passive: they offset passive income freely, and up to $25,000/yr can offset ordinary (W-2) income if you actively participate and your MAGI is under $100k (phasing out to $0 by $150k); unused losses carry forward. On sale, claimed depreciation is recaptured at up to 25%, and gains may owe capital-gains tax (a 1031 exchange can defer both). Figures are a year-1 estimate at your 24.0% rate — not tax advice; consult a CPA.
Schools (NCES district)
- District
- Magnolia ISD
- NCES district ID
- 4828740
- Math proficiency
- 42% ▼ -7.00%
- Reading proficiency
- 45% ▼ -4.00%
- Median HH income
- $71,692
- Composite
- 39.46/100
- National rank
- #3958
- State rank
- #247 of 826 in TX
Livability — Magnolia
- Score
- 73/100
- State rank
- #222
- US rank
- #5442
Category grades
Schools grade is shown separately in the Schools card above.
Census & demographics
- County
- Montgomery County · 663,713 people
- City population
- 32,847
- Metro
- Houston-The Woodlands-Sugar Land, TX
- Population (ZIP)
- 44,900
- Household income
- $112,504
- Rent vs Own
- Severe rent burden
- 586.0
Population outlook (Montgomery County) Hauer SSP2
- Today (2025)
- 713,896 people
- By 2030
- 805,263 · +12.8%
- By 2040
- 992,708 · +39.1%
- By 2050
- 1,179,590 · +65.2%
- By 2075
- 1,628,084 · +128.1%
- By 2100
- 1,937,880 · +171.5%
Race, ethnicity, and origin ACS 2023
- Neighborhood character
- Predominantly White (66%)
- Race & ethnicity
- White 66% Hispanic / Latino 25% Two or more races 18% Black 3% Asian 1%
- Hispanic origin (detail)
- Mexican 14% Puerto Rican 1%
- Common ancestry
- Lithuanian 4% Slovak 2% Italian 2%
- Foreign-born
- 11% · Canada, Vietnam
- Languages at home
- 83% English-only · Spanish 15% Other Indo-European 1% German/W. Germanic 1%
Political lean MEDSL · Montgomery
- 2024 margin
- Solid R (+45.5) · D 26.8% · R 72.3%
- 2008→2024 swing
- +7.2pp toward D · 2008: -52.7pp · 2024: -45.5pp
- All cycles
- 2024: R+45.5 2020: R+43.8 2016: R+51.4 2012: R+60.7 2008: R+52.7
Not yet ingested
- Civics
- —
Market trends
- HPI YoY
- ▲ 12.09%
- Current HPI
- 512.87
- Rent YoY
- ▲ 0.32%
- Metro
- Houston-The Woodlands-Sugar Land, TX
- State GDP YoY
- ▲ 3.95%
- F500 in state
- 110
Industry mix (Fortune 500 HQ in TX)
| Industry | F500 HQs | Revenue |
|---|---|---|
| Energy | 16 | $1,198B |
|
||
| Technology | 5 | $198B |
|
||
| Engineering / Construction | 4 | $72B |
|
||
| Energy Services | 3 | $60B |
|
||
| Utilities | 3 | $41B |
|
||
| Healthcare | 2 | $330B |
|
||
Cash-flow waterfall
monthlySold comps — $/sqft
last 12 mo · ≤1 miLoading sold comps…