31 Tranquility Trails Way Plan · Willis, TX
Flood risk No data
- FEMA flood zone
- —
- Chance of flooding over 30 yrs
- —
- Est. flood insurance / yr
- —
Fire risk No data
- Est. fire insurance / yr
- —
Heat risk No data
- Hot days now (above threshold)
- —
- Hot days in 30 yrs
- —
Wind risk No data
- Chance of severe wind over 30 yrs
- —
Air-quality risk No data
- Unhealthy air days now
- —
- Unhealthy air days in 30 yrs
- —
Risk factors via First Street. Map © Google.
Why this score? — see what drove the C grade
The composite is a weighted blend of 9 inputs, each scored 0–100. Each bar is that input's sub-score; the figure is the points it added to the 100-point composite (weight × sub-score).
- Cash flow +27.2/30.0
- DSCR +9.4/10.0
- 1% rule +7.4/10.0
- Condition / age +4.0/5.0
- Schools +3.2/10.0
- Livability +3.1/5.0
- Rent growth +2.0/5.0
- ARV discount +0.0/15.0
- Appreciation +0.0/10.0
$144,900
🖨 Deal sheet (PDF) 📄 Offer letter ✓ Due diligence
Listing remarks MLS
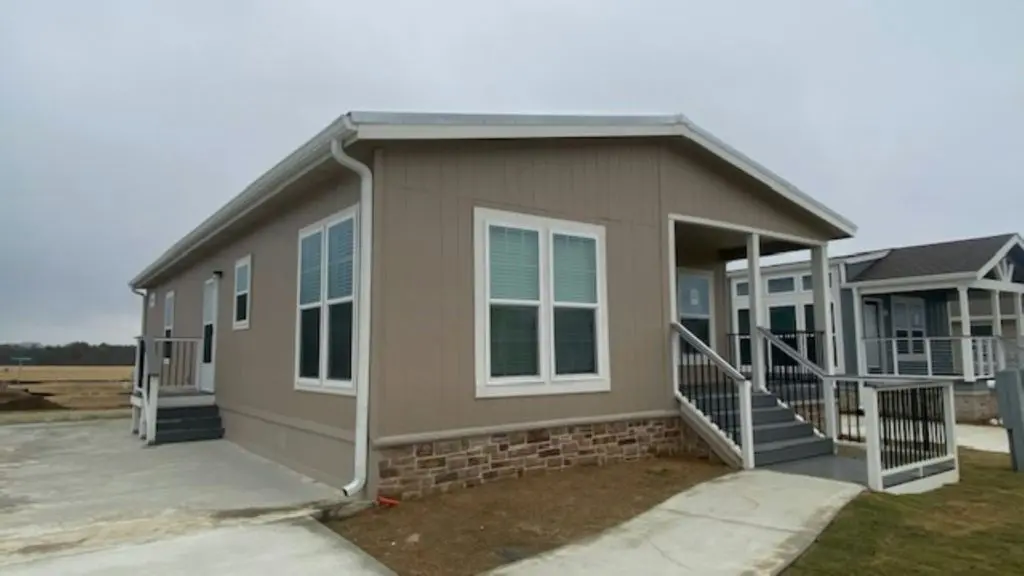
Rockrose Ranch at Lake Conroe is an active community where you can truly have it all. This spacious 1332 SQ. FT 3-bedroom, 2-bathroom home provides the perfect balance of indoor and outdoor living. The open concept living area opens onto a covered front porch, creating an ideal space for entertaining and relaxing. Come tour today! * * Photos are for representation purposes only. Actual property may differ in featured amenities, finishes, and in appearance from the model photos shown. Buy or lease today!
Key facts
- Listed 199 days
Neighborhood map
What this means for you Summary
Snapshot
- This is a 3-bed/2.0-bath manufactured listed at $145k. Condition is rated good.
Deal economics
- At list price, monthly cash flow is $412 ($5k/yr) — positive.
- The deal already cash-flows at list — no discount required.
- Meets the 1% rule at list price ($2k rent vs $145k).
- Recommended offer: $128k (12.0% below list) — sets the bar for market timing.
- Cap rate 9.7% vs local median 4.7% in Willis — top-decile yield for the area; either an underpriced asset or a hidden risk that comps aren't pricing in. Stress-test before assuming the spread holds.
Location & tenants
- Location reads 62/100 on livability (#933 in TX) — a middle-class / working-renter tenant base. Strengths: cost of living A+, housing A+; Watch: crime C-, employment D+, amenities F.
- Willis ISD (rural): math 33% / reading 40% proficiency, ranked #458 of 826 in TX (top 55%) — families likely to look elsewhere, expect single-tenant / working-renter base with shorter leases.
- Zoned schools: Parmley El (math 39% / reading 34%, grade F, #1,883 of 4,322 statewide, top 44%, 625 students, 72% FRL); Lynn Lucas Middle (math 23% / reading 32%, grade F, #1,156 of 1,662 statewide, top 71%, 971 students, 74% FRL); Willis H S (math 19% / reading 46%, grade F, #1,029 of 1,632 statewide, top 64%, 2,521 students, 57% FRL).
- Market conditions: Rents soft (-2.1%/yr); 1199 active listings in the ZIP; 8 comparable units currently listed for rent nearby; rentals lingering (median 45d on market — plan ~5-8 weeks vacancy on turnover, expect pricing pressure); 62% of comp listings sitting > 30 days — soft ceiling on asking rent; solid renter incomes; 13,259 units permitted in Montgomery County in 2024 (1,402 in 5+ unit buildings).
Forward outlook
- Local home prices are declining (-3.0%/yr); year-one equity from $1k of loan paydown is wiped out by about $4k of value loss. Plan a longer hold.
- Montgomery County population projected at +65% by 2050 — long-run rental-demand tailwind backs the buy-and-hold thesis.
Negotiation context
- It's been on market 199 days — a 12% lower offer ($128k) is reasonable based on typical stale-listing flexibility.
Questions for the listing agent
- It's been on market 199 days. Have you received any prior offers? Is the seller open to a 12% concession, seller financing, or rate buy-down credit?
- Why hasn't it sold? Are there any deal-killer items the seller is aware of (foundation, flood, title, zoning, code violations)?
- Is there a deadline driving the sale (1031 exchange, divorce, estate, relocation)? That informs how much negotiation room exists.
- Schools are D-rated, which usually means shorter tenancies and higher turnover. Who's the typical renter profile here, and what's been the actual vacancy rate?
- What's the average days-on-market for RENTAL listings here right now (not sales)? A rising rental-DOM trend means longer vacancies and softer asking-rent achievability than the comps imply.
- What's the recent tenant-quality profile in this submarket — average credit score on applications, eviction rate, late-payment / NSF rate, and stable-employment percentage? A property-management company in the area should have these aggregated.
- How much new for-sale + rental construction is in the pipeline within 1–3 miles? Heavy new supply typically softens prices + rents 12–24 months out; constrained supply supports both.
Investment metrics
- 1% rule
- 1.24% ✓
- Cap rate
- 9.71%
- Cash-on-cash
- 12.20%
- DSCR
- 1.54
- GRM
- 6.7
CMA / ARV
- ARV (median comp)
- $120,000
- List price
- $144,900
- Delta
- 20.75%
- Verdict
- OVERPRICED
- Comps
- 5 within 1.0 mi
Show comp detail 3 sales within ~0.75 mi
| Address | Dist | Beds/Ba | Sqft | Sold | Price | $/sf | Match |
|---|---|---|---|---|---|---|---|
| 11614 Vistawood St | 0.60mi | 3/2.0 | 1,216 (-9%) | 3mo | $139,900 | $115 | 55 |
| 9871 Arbor Oak | 0.65mi | 3/2.0 | 1,216 (-9%) | 2mo | $70,000 | $58 | 53 |
| 8786 Scarlet Oak | 0.73mi | 3/2.0 | 1,216 (-9%) | 1mo | $62,900 | $52 | 50 |
Match score weights: distance 35% · size 25% · config 20% · recency 20%. Top-matched comps best support the ARV.
Projected returns pro-forma
-3.0% appreciation · 0.0% rent growth · sell at horizon
- IRR
- -1.6%
- Equity multiple
- 0.94×
- Total profit
- $-2,426
- Equity at exit
- $21,605
- IRR
- 4.5%
- Equity multiple
- 1.28×
- Total profit
- $11,558
- Equity at exit
- $12,528
Cash invested: $40,572 (down + closing). Projections, not guarantees.
Landlord ↔ Tenant lean methodology
- Overall (STATE)
- 87 Strongly Landlord-Friendly
- State Texas
- 87 Strongly Landlord-Friendly · R+5
- County
- — inherits STATE
- City
- — inherits STATE
ZIP-level market 77318
- Home prices YoY
- -32.7%
- Rents YoY
- -2.1%
- Active inventory
- 1199
- Price-to-rent
- 6.7×
Monthly cashflow live
- Estimated rent
- $1,790 high interval (Pro) →
- Mortgage (P&I)
- −$760
- Tax est. 1.5%
- −$181 /mo · $2,174/yr
- Insurance
- −$60
- HOA
- −$0
- Vacancy / Maint / Mgmt
- −$376
- Net cashflow
- $412
Break-even live
Sensitivity live
| Price | -10% $513 | -5% $463 | +0% $412 | +5% $362 | +10% $312 |
|---|---|---|---|---|---|
| Rent | -10% $271 | -5% $342 | +0% $412 | +5% $483 | +10% $554 |
| Rate | -1.0pp $485 | -0.5pp $449 | base $412 | +0.5pp $375 | +1.0pp $337 |
UW: 25.0% down · 7.5% · 30yr · 1.5% tax · 5.0% vac · 8.0% maint · 8.0% mgmt
Financing live
Cash to close
- Down payment
- $36,225
- Closing costs
- $4,347
- Reserves months
- —
- Total cash needed
- —
Loan-product check · same deal, 3 products live
Conventional
25% down · 7.5% · 30yr
- Down + closing
- —
- Monthly P&I
- —
- Monthly cashflow
- —
- DSCR
- —
- Eligible?
- —
Personal DTI + credit; lowest rate.
DSCR
20% down · 8.5% · 30yr
- Down + closing
- —
- Monthly P&I
- —
- Monthly cashflow
- —
- DSCR
- —
- Eligible?
- —
No personal income docs; deal must DSCR.
Hard money
10% down · 12.0% · 12mo
- Down + closing
- —
- Monthly P&I
- —
- Monthly cashflow
- —
- DSCR
- —
- Eligible?
- —
Short-term bridge; refi at stabilization.
Rent comps 8 comps
| Address | Beds | Baths | Sqft | Rent | $/sqft | DOM | Units | Dist |
|---|---|---|---|---|---|---|---|---|
| 11561 Persimmon St Willis, TX | 3.0 | 2.0 | 1000 | $1,530 | $1.53 | 45d | 1 | 0.49mi |
| 11559 Persimmon St Willis, TX | 3.0 | 2.0 | 1000 | $1,490 | $1.49 | 45d | 1 | 0.49mi |
| 11555 Persimmon St Willis, TX | 3.0 | 2.0 | 1000 | $1,495 | $1.50 | 45d | 1 | 0.50mi |
| 9745 Black Gum Willis, TX | 3.0 | 2.0 | 1000 | $1,300 | $1.30 | 45d | 1 | 0.54mi |
| 9743 Black Gum Willis, TX | 3.0 | 2.0 | 1000 | $1,350 | $1.35 | 4d | 1 | 0.55mi |
| 14190 Green Wing Cir Willis, TX | 3.0 | 2.0 | 1402 | $1,795 | $1.28 | 5d | 1 | 1.22mi |
| 14210 Green Wing Cir Willis, TX | 4.0 | 2.0 | 1603 | $1,850 | $1.15 | 5d | 1 | 1.25mi |
| 14214 Green Wing Cir Willis, TX | 3.0 | 2.0 | 1200 | $1,950 | $1.62 | 45d | 1 | 1.25mi |
Listing history 15 events
-
2026-06-21days on market $144,900 Active 199 DOM
-
2026-06-18days on market $144,900 Active 196 DOM
-
2026-06-17days on market $144,900 Active 195 DOM
-
2026-06-16days on market $144,900 Active 194 DOM
-
2026-06-15days on market $144,900 Active 193 DOM
-
2026-06-13days on market $144,900 Active 191 DOM
-
2026-06-09days on market $144,900 Active 187 DOM
-
2026-06-08days on market $144,900 Active 186 DOM
-
2026-06-07days on market $144,900 Active 185 DOM
-
2026-06-04days on market $144,900 Active 182 DOM
-
2026-06-03days on market $144,900 Active 181 DOM
-
2026-06-02days on market $144,900 Active 180 DOM
-
2026-06-01days on market $144,900 Active 179 DOM
-
2026-05-31days on market $144,900 Active 178 DOM
-
2025-12-04$144,900 Active 510-char remark
Show marketing remark (510 chars)
Rockrose Ranch at Lake Conroe is an active community where you can truly have it all. This spacious 1332 SQ. FT 3-bedroom, 2-bathroom home provides the perfect balance of indoor and outdoor living. The open concept living area opens onto a covered front porch, creating an ideal space for entertaining and relaxing. Come tour today! * * Photos are for representation purposes only. Actual property may differ in featured amenities, finishes, and in appearance from the model photos shown. Buy or lease today!
ⓘ Source: listings_history table (triggers on properties + properties_extension) + one-shot
backfill from property_details.listing_events for pre-trigger history.
Nearby sold comps map
Loading sold comps map…
Walkable amenities ~0.75 mi
Loading nearby amenities…
Taxation est. · year 1
- Rental income
- $21,477
- − Mortgage interest
- −$8,117
- − Property taxes
- −$2,174
- − Insurance
- −$724
- − Repairs & maintenance
- −$1,718
- − Management
- −$1,718
- − Depreciation
- −$4,215
- Taxable income
- $2,810
- Est. tax owed @ 24.0%
- −$674
- After-tax cash flow
- $4,276/yr
For passive investors: Depreciation is non-cash, so a rental often shows a tax loss while cash-flowing — sheltering income. Rental losses are passive: they offset passive income freely, and up to $25,000/yr can offset ordinary (W-2) income if you actively participate and your MAGI is under $100k (phasing out to $0 by $150k); unused losses carry forward. On sale, claimed depreciation is recaptured at up to 25%, and gains may owe capital-gains tax (a 1031 exchange can defer both). Figures are a year-1 estimate at your 24.0% rate — not tax advice; consult a CPA.
Condition & rehab AI · 6 photos
This 1332 sq ft 3-bedroom, 2-bathroom home in Rockrose Ranch at Lake Conroe is in excellent condition with modern finishes and ample living space. It's move-in ready and offers a great balance of indoor and outdoor living.
Value-add opportunities
- Both Painting the exterior and interior walls — Fresh paint can enhance curb appeal and interior aesthetics.
- Both Landscaping improvements — Enhanced landscaping can increase curb appeal and attract potential buyers/tenants.
- Both Add a smart home system — Modern technology can increase the home's appeal and market value.
- Both Install smart locks — Smart locks can improve security and convenience for both buyers and tenants.
- Both Add a smart thermostat — Smart thermostats can save energy and appeal to environmentally conscious buyers/tenants.
Renovation cost estimate screening
Value-add ROI direction
- Both Painting the exterior and interior walls — Fresh paint can enhance curb appeal and interior aesthetics. ↑
- Both Landscaping improvements — Enhanced landscaping can increase curb appeal and attract potential buyers/tenants. ↑
- Both Add a smart home system — Modern technology can increase the home's appeal and market value. ↑
- Both Install smart locks — Smart locks can improve security and convenience for both buyers and tenants. ↑
- Both Add a smart thermostat — Smart thermostats can save energy and appeal to environmentally conscious buyers/tenants. ↑
ⓘ Cost ranges are severity-bucket heuristics (US national rule-of-thumb). Get contractor quotes + a written scope before underwriting a rehab budget.
Schools (NCES district)
- District
- Willis ISD
- NCES district ID
- 4845900
- Math proficiency
- 33% ▼ -15.00%
- Reading proficiency
- 40% ▼ -2.00%
- Median HH income
- $57,828
- Composite
- 32.32/100
- National rank
- #5746
- State rank
- #458 of 826 in TX
Livability — Willis
- Score
- 62/100
- State rank
- #933
- US rank
- #16579
Category grades
Schools grade is shown separately in the Schools card above.
Census & demographics
- County
- Montgomery County · 663,713 people
- City population
- 38,421
- Metro
- Houston-The Woodlands-Sugar Land, TX
- Population (ZIP)
- 20,792
- Household income
- $92,415
- Rent vs Own
- Severe rent burden
- 279.0
Population outlook (Montgomery County) Hauer SSP2
- Today (2025)
- 713,896 people
- By 2030
- 805,263 · +12.8%
- By 2040
- 992,708 · +39.1%
- By 2050
- 1,179,590 · +65.2%
- By 2075
- 1,628,084 · +128.1%
- By 2100
- 1,937,880 · +171.5%
Race, ethnicity, and origin ACS 2023
- Neighborhood character
- Predominantly White (72%)
- Race & ethnicity
- White 72% Hispanic / Latino 17% Two or more races 14% Black 3%
- Hispanic origin (detail)
- Mexican 12%
- Common ancestry
- Lithuanian 4% Slovak 2% Serbian 2%
- Foreign-born
- 6% · Canada, Jamaica
- Languages at home
- 88% English-only · Spanish 10%
Political lean MEDSL · Montgomery
- 2024 margin
- Solid R (+45.5) · D 26.8% · R 72.3%
- 2008→2024 swing
- +7.2pp toward D · 2008: -52.7pp · 2024: -45.5pp
- All cycles
- 2024: R+45.5 2020: R+43.8 2016: R+51.4 2012: R+60.7 2008: R+52.7
Not yet ingested
- Civics
- —
Market trends
- HPI YoY
- ▼ -114.58%
- Current HPI
- 236.256
- Rent YoY
- ▼ -2.09%
- Metro
- Houston-The Woodlands-Sugar Land, TX
- State GDP YoY
- ▲ 3.95%
- F500 in state
- 110
Industry mix (Fortune 500 HQ in TX)
| Industry | F500 HQs | Revenue |
|---|---|---|
| Energy | 16 | $1,198B |
|
||
| Technology | 5 | $198B |
|
||
| Engineering / Construction | 4 | $72B |
|
||
| Energy Services | 3 | $60B |
|
||
| Utilities | 3 | $41B |
|
||
| Healthcare | 2 | $330B |
|
||
Price history
1 event — show timeline
- 2025-12-04 Listed $144,900 Zillow
Cash-flow waterfall
monthlySold comps — $/sqft
last 12 mo · ≤1 miLoading sold comps…