18377 W Papago St · Goodyear, AZ
Flood risk No data
- FEMA flood zone
- —
- Chance of flooding over 30 yrs
- —
- Est. flood insurance / yr
- —
Fire risk No data
- Est. fire insurance / yr
- —
Heat risk No data
- Hot days now (above threshold)
- —
- Hot days in 30 yrs
- —
Wind risk No data
- Chance of severe wind over 30 yrs
- —
Air-quality risk No data
- Unhealthy air days now
- —
- Unhealthy air days in 30 yrs
- —
Risk factors via First Street. Map © Google.
Why this score? — see what drove the F grade
The composite is a weighted blend of 9 inputs, each scored 0–100. Each bar is that input's sub-score; the figure is the points it added to the 100-point composite (weight × sub-score).
- ARV discount +7.5/15.0
- Livability +3.8/5.0
- Schools +2.8/10.0
- Condition / age +2.5/5.0
- Rent growth +2.3/5.0
- Cash flow +1.1/30.0
- 1% rule +0.0/10.0
- DSCR +0.0/10.0
- Appreciation +0.0/10.0
$669,999
🖨 Deal sheet 📄 Offer letter ✓ Due diligence
Listing remarks MLS
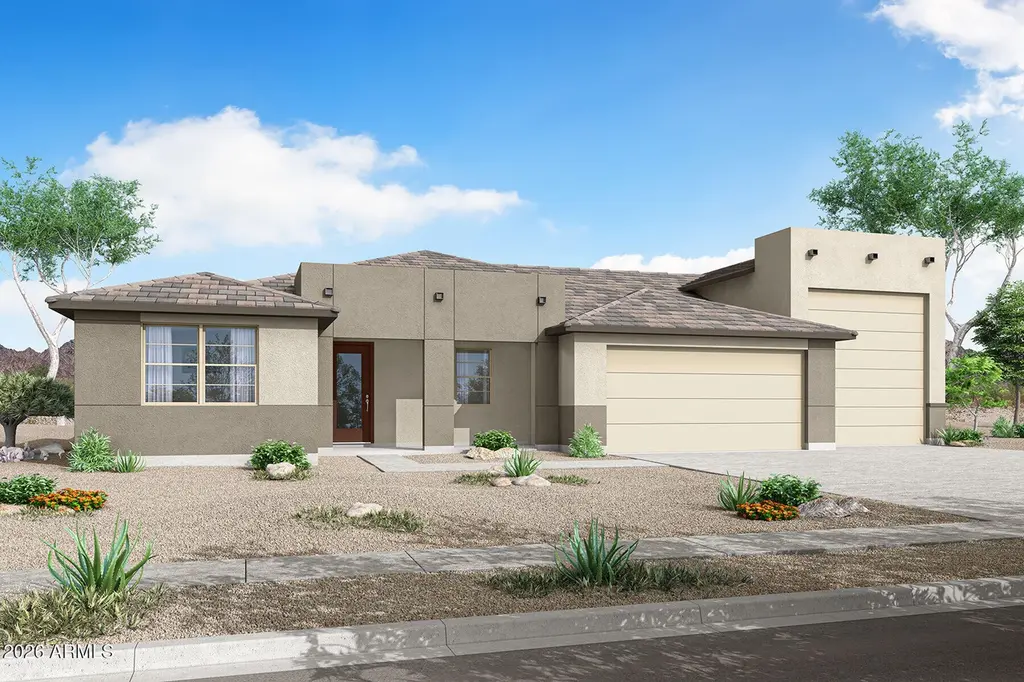
March Delivery - Features 45' RV Garage + 3 Car Tandem Garage. The Mulberry offers 2,688 sq ft of flexible living space with 4 bedrooms, 3.5 baths, and thoughtful design throughout. A welcoming front porch opens to a bright, open-concept layout. Two secondary bedrooms share a bath near the entry, plus a flex room that can serve as a study or optional 5th bedroom. The spacious Great Room flows into the dining area and kitchen with oversized island overlooking the covered patio. A private rear bedroom includes its own bath. The owner's suite features patio access, a large walk-in closet, and spa-inspired bath. Close to 1-10 and 303
Key facts
- Tandem garage
- Great room
- Oversized island
Tags
Neighborhood map
What this means for you Summary
Snapshot
- This is a 4-bed/3.5-bath land listed at $670k.
Deal economics
- At list price, monthly cash flow is $-3k ($-33k/yr) — negative.
- To cash-flow at today's rent, offer at most $273k (59.3% below list).
- To meet the 1% rule (rent ≥ 1% of price), the offer needs to be $258k (61.5% below list).
- Recommended offer: $258k (61.5% below list) — sets the bar for 1% rule.
- Cap rate 1.4% vs local median 3.0% in Goodyear — below-typical yield; the buyer is paying a premium for something (appreciation thesis, condition, location) that the cap rate doesn't capture.
Location & tenants
- Location reads 76/100 on livability (#15 in AZ, #3,737 nationally) — a middle-class / working-renter tenant base. Strengths: employment A+, housing A+, crime B+; Watch: health & safety D+, cost of living D, amenities F.
- Liberty Elementary District (4266) (rural): math 26% / reading 33% proficiency, ranked #100 of 249 in AZ (top 40%) — low school quality limits family demand, transient renter base, plan for 1-2y turnover.
- Market conditions: Rents soft (-0.7%/yr); 1088 active listings in the ZIP; 13 comparable units currently listed for rent nearby; rentals leasing fast (median 2d on market — plan ~1-2 weeks tenant-placement turnaround); solid renter incomes; 36,011 units permitted in Maricopa County in 2024 (12,801 in 5+ unit buildings).
- This rent runs 30% of the median local income ($102k/yr) — at the standard rent-burdened threshold; future hikes will face affordability resistance.
Forward outlook
- Local home prices are declining (-3.0%/yr); year-one equity from $5k of loan paydown is wiped out by about $20k of value loss. Plan a longer hold.
- Maricopa County population projected at +38% by 2050 — long-run rental-demand tailwind backs the buy-and-hold thesis.
Negotiation context
- It's been on market 26 days — a 2% lower offer ($660k) is reasonable based on typical stale-listing flexibility.
Questions for the listing agent
- What do current leases actually rent for vs. the listed asking? Can we see a recent rent roll and the last 12 months of T-12 income?
- What does the HOA fee cover, when was the last increase, and are there any pending special assessments or reserve-fund shortfalls?
- Is there a deadline driving the sale (1031 exchange, divorce, estate, relocation)? That informs how much negotiation room exists.
- Schools are B-rated — typically a magnet for longer-tenancy family renters. What's the average tenant stay here, and is there a school-zone premium baked into asking?
- The area grade is low — what's the realistic commute time and amenity access for the typical tenant pool here? Any planned neighborhood developments (good or bad) we should know about?
- What's the average days-on-market for RENTAL listings here right now (not sales)? A rising rental-DOM trend means longer vacancies and softer asking-rent achievability than the comps imply.
- What's the recent tenant-quality profile in this submarket — average credit score on applications, eviction rate, late-payment / NSF rate, and stable-employment percentage? A property-management company in the area should have these aggregated.
- How much new for-sale + rental construction is in the pipeline within 1–3 miles? Heavy new supply typically softens prices + rents 12–24 months out; constrained supply supports both.
Investment metrics
- 1% rule
- 0.39% ✗
- Cap rate
- 1.37%
- Cash-on-cash
- -17.57%
- DSCR
- 0.22
- GRM
- 21.6
CMA / ARV
No comps found within radius.
Projected returns pro-forma
-3.0% appreciation · 0.0% rent growth · sell at horizon
- IRR
- -54.4%
- Equity multiple
- -0.55×
- Total profit
- $-290,924
- Equity at exit
- $99,899
- IRR
- —
- Equity multiple
- -1.70×
- Total profit
- $-507,260
- Equity at exit
- $57,929
Cash invested: $187,600 (down + closing). Projections, not guarantees.
Landlord ↔ Tenant lean methodology
- Overall (STATE)
- 87 Strongly Landlord-Friendly
- State Arizona
- 87 Strongly Landlord-Friendly · R+3
- County
- — inherits STATE
- City
- — inherits STATE
ZIP-level market 85338
- Home prices YoY
- -23.9%
- Rents YoY
- -0.7%
- Active inventory
- 1088
- Price-to-rent
- 21.6×
Monthly cashflow live
- Estimated rent
- $2,581 high interval (Pro) →
- Mortgage (P&I)
- −$3,514
- Tax est. 1.5%
- −$837 /mo · $10,050/yr
- Insurance
- −$279
- HOA
- −$155
- Vacancy / Maint / Mgmt
- −$542
- Net cashflow
- $-2,747
Break-even live
UW: 25.0% down · 7.5% · 30yr · 1.5% tax · 5.0% vac · 8.0% maint · 8.0% mgmt
Financing live
Cash to close
- Down payment
- $167,500
- Closing costs
- $20,100
- Reserves months
- —
- Total cash needed
- —
Loan-product check · same deal, 3 products live
Conventional
25% down · 7.5% · 30yr
- Down + closing
- —
- Monthly P&I
- —
- Monthly cashflow
- —
- DSCR
- —
- Eligible?
- —
Personal DTI + credit; lowest rate.
DSCR
20% down · 8.5% · 30yr
- Down + closing
- —
- Monthly P&I
- —
- Monthly cashflow
- —
- DSCR
- —
- Eligible?
- —
No personal income docs; deal must DSCR.
Hard money
10% down · 12.0% · 12mo
- Down + closing
- —
- Monthly P&I
- —
- Monthly cashflow
- —
- DSCR
- —
- Eligible?
- —
Short-term bridge; refi at stabilization.
Rent comps 13 comps
| Address | Beds | Baths | Sqft | Rent | $/sqft | DOM | Units | Dist |
|---|---|---|---|---|---|---|---|---|
| 17456 W Ashley Dr Goodyear, AZ | 3.0 | 2.0 | 1762 | $2,350 | $1.33 | 1d | 1 | 0.69mi |
| 2506 S 186th Dr Goodyear, AZ | 4.0 | 3.0 | 3100 | $30,000 | $9.68 | 1d | 1 | 0.74mi |
| 18649 W Williams St Goodyear, AZ | 4.0 | 2.5 | 2822 | $2,695 | $0.95 | 4d | 1 | 1.00mi |
| 18649 W Williams St Goodyear, AZ | 4.0 | 2.5 | 2822 | $2,695 | $0.95 | 2d | 1 | 1.00mi |
| 3150 S 180th Ln Goodyear, AZ | 4.0 | 3.0 | 2083 | $2,300 | $1.10 | 43d | 1 | 1.08mi |
| 1613 S 174th Ln Goodyear, AZ | 5.0 | 3.0 | 2999 | $2,999 | $1.00 | 1d | 1 | 1.12mi |
| 17430 W Yavapai St Goodyear, AZ | 4.0 | 2.5 | 2277 | $1,995 | $0.88 | 1d | 1 | 1.16mi |
| 17421 W Papago St Goodyear, AZ | 4.0 | 2.5 | 2522 | $2,600 | $1.03 | 15d | 1 | 1.16mi |
| 17415 W Yavapai St Goodyear, AZ | 4.0 | 2.0 | 2277 | $2,295 | $1.01 | 16d | 1 | 1.18mi |
| 3349 S 179th Dr Goodyear, AZ | 3.0 | 2.5 | 1890 | $2,095 | $1.11 | 1d | 1 | 1.23mi |
| 56 S 190th Ln Buckeye, AZ | 4.0 | 2.5 | 2114 | $1,995 | $0.94 | 3d | 1 | 1.34mi |
| 17954 W Raymond St Goodyear, AZ | 5.0 | 3.0 | 3466 | $2,950 | $0.85 | 1d | 1 | 1.43mi |
| 3422 S 176th Dr Goodyear, AZ | 4.0 | 3.0 | 2647 | $3,350 | $1.27 | 1d | 1 | 1.50mi |
HOA detail
- Monthly dues
- $155 · $1,860/yr
Listing history 2 events
-
2026-05-06status Pending 637-char remark
Show marketing remark (637 chars)
March Delivery - Features 45' RV Garage + 3 Car Tandem Garage. The Mulberry offers 2,688 sq ft of flexible living space with 4 bedrooms, 3.5 baths, and thoughtful design throughout. A welcoming front porch opens to a bright, open-concept layout. Two secondary bedrooms share a bath near the entry, plus a flex room that can serve as a study or optional 5th bedroom. The spacious Great Room flows into the dining area and kitchen with oversized island overlooking the covered patio. A private rear bedroom includes its own bath. The owner's suite features patio access, a large walk-in closet, and spa-inspired bath. Close to 1-10 and 303
-
2026-04-10$669,999 Active 637-char remark
Show marketing remark (637 chars)
March Delivery - Features 45' RV Garage + 3 Car Tandem Garage. The Mulberry offers 2,688 sq ft of flexible living space with 4 bedrooms, 3.5 baths, and thoughtful design throughout. A welcoming front porch opens to a bright, open-concept layout. Two secondary bedrooms share a bath near the entry, plus a flex room that can serve as a study or optional 5th bedroom. The spacious Great Room flows into the dining area and kitchen with oversized island overlooking the covered patio. A private rear bedroom includes its own bath. The owner's suite features patio access, a large walk-in closet, and spa-inspired bath. Close to 1-10 and 303
ⓘ Source: listings_history table (triggers on properties + properties_extension) + one-shot
backfill from property_details.listing_events for pre-trigger history.
Nearby sold comps map
Loading sold comps map…
Walkable amenities ~0.75 mi
Loading nearby amenities…
Taxation est. · year 1
- Rental income
- $30,968
- − Mortgage interest
- −$37,530
- − Property taxes
- −$10,050
- − Insurance
- −$3,350
- − Repairs & maintenance
- −$2,477
- − Management
- −$2,477
- − HOA
- −$1,860
- − Depreciation
- −$19,491
- Taxable loss
- −$46,268
- Est. tax savings @ 24.0%
- +$11,104
- After-tax cash flow
- $-21,854/yr
For passive investors: Depreciation is non-cash, so a rental often shows a tax loss while cash-flowing — sheltering income. Rental losses are passive: they offset passive income freely, and up to $25,000/yr can offset ordinary (W-2) income if you actively participate and your MAGI is under $100k (phasing out to $0 by $150k); unused losses carry forward. On sale, claimed depreciation is recaptured at up to 25%, and gains may owe capital-gains tax (a 1031 exchange can defer both). Figures are a year-1 estimate at your 24.0% rate — not tax advice; consult a CPA.
Schools (NCES district)
- District
- Liberty Elementary District (4266)
- NCES district ID
- 0404320
- Math proficiency
- 26% ▼ -17.00%
- Reading proficiency
- 33% ▼ -8.00%
- Median HH income
- $71,731
- Composite
- 27.84/100
- National rank
- #6881
- State rank
- #100 of 249 in AZ
Livability — Goodyear
- Score
- 76/100
- State rank
- #15
- US rank
- #3737
Category grades
Schools grade is shown separately in the Schools card above.
Census & demographics
- Census place
- Goodyear, AZ
- County
- Maricopa County · 4,537,380 people
- City population
- 107,865
- Metro
- Phoenix-Mesa-Chandler, AZ
- Population (ZIP)
- 67,451
- Household income
- $101,744
- Rent vs Own
- Severe rent burden
- 1300.0
Population outlook (Maricopa County) Hauer SSP2
- Today (2025)
- 4,979,203 people
- By 2030
- 5,378,229 · +8.0%
- By 2040
- 6,156,598 · +23.6%
- By 2050
- 6,872,376 · +38.0%
- By 2075
- 8,401,270 · +68.7%
- By 2100
- 9,247,439 · +85.7%
Race, ethnicity, and origin ACS 2023
- Neighborhood character
- Diverse neighborhood (Simpson 0.61)
- Race & ethnicity
- White 48% Hispanic / Latino 39% Two or more races 19% Black 6% Asian 3% Native American 1%
- Hispanic origin (detail)
- Mexican 34%
- Common ancestry
- Romanian 2% Slovak 2% Lithuanian 2%
- Foreign-born
- 10% · Canada
- Languages at home
- 76% English-only · Spanish 21% Other Indo-European 1% Tagalog/Filipino 1%
Political lean MEDSL · Maricopa
- 2024 margin
- Toss-up / Even · D 47.7% · R 51.2% · Other 1.1%
- 2008→2024 swing
- +7.1pp toward D · 2008: -10.6pp · 2024: -3.5pp
- All cycles
- 2024: R+3.5 2020: D+2.2 2016: R+3.5 2012: R+12.0 2008: R+10.6
Not yet ingested
- Civics
- —
Market trends
- HPI YoY
- ▼ -79.22%
- Current HPI
- 252.0828
- Rent YoY
- ▼ -0.66%
- Metro
- Phoenix-Mesa-Chandler, AZ
- State GDP YoY
- ▲ 4.54%
- F500 in state
- 20
Industry mix (Fortune 500 HQ in AZ)
| Industry | F500 HQs | Revenue |
|---|---|---|
| Technology | 2 | $13B |
|
||
| Mining / Metals | 1 | $23B |
|
||
| Environmental Services | 1 | $16B |
|
||
| Metals / Steel | 1 | $14B |
|
||
| Technology Distribution | 1 | $9B |
|
||
| Homebuilding | 1 | $8B |
|
||
Price history
2 events — show timeline
- 2026-05-06 Pending — ARMLS
- 2026-04-10 Listed $669,999 ARMLS
Cash-flow waterfall
monthlySold comps — $/sqft
last 12 mo · ≤1 miLoading sold comps…