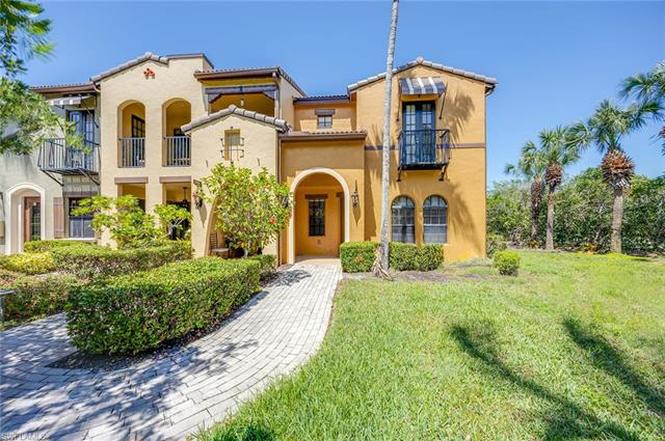
9134 Chula Vista St #125 · Lely Resort, FL
Flood risk 7/10 · Major
- FEMA flood zone
- AE
- Chance of flooding over 30 yrs
- 0.76%
- Est. flood insurance / yr
- $1,737 – $8,500
Fire risk 4/10 · Minor
- Est. fire insurance / yr
- $947 – $1,759
Heat risk 10/10 · Severe
- Hot days now (above 108°F)
- 7 days/yr
- Hot days in 30 yrs
- 30 days/yr
Wind risk 10/10 · Severe
- Chance of severe wind over 30 yrs
- 99.0%
Air-quality risk 2/10 · Minimal
- Unhealthy air days now
- 2 days/yr
- Unhealthy air days in 30 yrs
- 2 days/yr
Risk factors via First Street. Map © Google.
Why this score? — see what drove the C+ grade
The composite is a weighted blend of 9 inputs, each scored 0–100. Each bar is that input's sub-score; the figure is the points it added to the 100-point composite (weight × sub-score).
- Cash flow +22.1/30.0
- 1% rule +9.7/10.0
- ARV discount +7.5/15.0
- DSCR +7.1/10.0
- Schools +5.0/10.0
- Rent growth +3.9/5.0
- Livability +3.1/5.0
- Condition / age +2.5/5.0
- Appreciation +0.0/10.0
$399,900
🖨 Deal sheet (PDF) 📄 Offer letter ✓ Due diligence
Listing remarks
Experience vibrant resort living at Ole in Lely Resort! This desirable end unit, three-bedroom, 2.5-bath townhome with a spacious two-car garage, new roof and HVAC along with carpet and appliances has been lovingly maintained by original owners and is offered turnkey furnished. Enjoy enhanced natural light, added privacy and a thoughtful layout in one of Naples sought-after communities. Whether you're searching for a full-time residence, seasonal escape or potential income-producing investment, this home delivers unmatched flexibility with rental allowances up to 12 times per year, 30-day minimum. Ole offers a resort-style experience with a tropical lagoon-style pool and private cabanas, a
Key facts
- Business center
- Sports courts
- Private cabanas
Tags
Property features AI
Finance
- Other: Part of a larger community with multiple buildings and units (complex contains many units)
- HOA & community: Mandatory HOA; Professional management; Quarterly master HOA fee; Amenities include clubhouse, community pool and spa, exercise room, tennis, pickleball, bocce, bike/jog paths, theater, restaurant, business center, library, and internet access; HOA covers cable, insurance, internet/Wi‑Fi, lawn/land maintenance, manager, recreation facilities, reserves, street lights and maintenance, trash removal, and water; Total annual recurring fees reported; One-time fees applicable
Exterior
- Parking: Attached 2-car garage; No additional parking
- Security: Impact-resistant windows and doors; Smoke detectors
- Utilities: Central water; Central sewer; Cable available; Electric service (for heat and cooling)
- Home design: Residential townhouse; 2-story end unit; Rear exposure facing southeast; Built in 2007; Part of Lely Resort development
- Construction: Concrete block construction
- Exterior features: Stucco exterior; Tile roof; Impact-resistant windows; Impact-resistant doors; Zero lot line; Landscaped area view; Paved road access; Irrigation: central and reclaimed
Interior
- Kitchen: Pantry / walk-in pantry; Range; Microwave; Dishwasher; Disposal; Refrigerator
- Bedrooms: 3 bedrooms; Master bedroom located upstairs
- Flooring: Carpet; Tile
- Bathrooms: 2 full bathrooms; 1 half bathroom; Master bath with dual sinks, jetted tub, and separate tub and shower
- Heating & cooling: Central electric heat; Central electric air conditioning
- Interior features: High-speed internet available; Pantry / walk-in pantry; Smoke detectors; Volume ceilings; Walk-in closet; Pantry; Loft; Guest room; Guest bath; Laundry in residence; Turnkey furnished
- Laundry & utility: Washer and dryer in residence; Auto garage door
Neighborhood map
What this means for you Summary
Snapshot
- This is a 3-bed/2.5-bath condo listed at $400k.
Deal economics
- At list price, monthly cash flow is $219 ($3k/yr) — positive.
- The deal already cash-flows at list — no discount required.
- Meets the 1% rule at list price ($6k rent vs $400k).
- Recommended offer: $352k (12.0% below list) — sets the bar for market timing.
Location & tenants
- Location reads 61/100 on livability (#786 in FL) — a middle-class / working-renter tenant base. Strengths: crime A+, employment A-; Watch: health & safety D, amenities F, commute F.
- Collier (suburban): math 60% / reading 56% proficiency, ranked #16 of 73 in FL (top 22%) — acceptable for families but not a draw, mixed tenant base, ~2y average lease.
- Zoned schools: Lely Elementary School (math 45% / reading 46%, grade D-, #1,247 of 2,144 statewide, top 59%, 499 students, 62% FRL); Manatee Middle School (math 61% / reading 43%, grade C+, #217 of 571 statewide, top 40%, 749 students, 64% FRL); Lely High School (math 40% / reading 39%, grade F, #304 of 667 statewide, top 47%, 1,504 students, 54% FRL).
- Zoned-school proficiency averages 46% at this address vs 58% district-wide (-12 pts) — the specific schools serving this property underperform the Collier average; the district grade overstates school quality for this exact location.
- Market conditions: Rents rising fast (+5.6%/yr); 598 active listings in the ZIP; 40 comparable units currently listed for rent nearby; rentals at typical pace (median 25d on market — plan ~3-4 weeks tenant-placement turnaround); solid renter incomes; 3,520 units permitted in Collier County in 2024 (959 in 5+ unit buildings).
- At $5,881/mo this rent would consume 86% of the median local household income ($82k/yr) (locally 954% of renters already pay >50% of income on rent) — very limited rent-growth headroom before tenants either downsize or default.
Forward outlook
- Local home prices are declining (-3.0%/yr); year-one equity from $3k of loan paydown is wiped out by about $12k of value loss. Plan a longer hold.
- Collier County population projected at +30% by 2050 — long-run rental-demand tailwind backs the buy-and-hold thesis.
Negotiation context
- It's been on market 428 days — a 12% lower offer ($352k) is reasonable based on typical stale-listing flexibility.
- 3 sale attempts; this cycle's ask is 5232% above the opening price — seller raised mid-cycle; expect resistance to lowballs.
Risks & watch-outs
- Watch-outs: flood insurance adds $427/mo; HOA is 21% of rent.
- Climate carrying-cost: in FEMA flood zone AE (mandatory federal flood insurance); severe wind risk, 99% chance of damaging wind over 30y; extreme-heat days projected 7→30/yr by 2055 (HVAC capex compounding) — expect insurance premiums to compound above CPI over the hold.
Questions for the listing agent
- It's been on market 428 days. Have you received any prior offers? Is the seller open to a 12% concession, seller financing, or rate buy-down credit?
- What's the actual annual flood-insurance premium (NFIP or private), and is the property in a SFHA with mandatory coverage?
- What does the HOA fee cover, when was the last increase, and are there any pending special assessments or reserve-fund shortfalls?
- Any open or pending special assessments — roof, HVAC, plumbing, elevator, façade? What's the per-unit balance and payoff schedule, and is the seller paying it off at close or rolling it to the buyer?
- Why hasn't it sold? Are there any deal-killer items the seller is aware of (foundation, flood, title, zoning, code violations)?
- Is there a deadline driving the sale (1031 exchange, divorce, estate, relocation)? That informs how much negotiation room exists.
- Schools are F-rated, which usually means shorter tenancies and higher turnover. Who's the typical renter profile here, and what's been the actual vacancy rate?
- What's the average days-on-market for RENTAL listings here right now (not sales)? A rising rental-DOM trend means longer vacancies and softer asking-rent achievability than the comps imply.
- What's the recent tenant-quality profile in this submarket — average credit score on applications, eviction rate, late-payment / NSF rate, and stable-employment percentage? A property-management company in the area should have these aggregated.
- How much new apartment / multifamily construction is in the pipeline within 1–3 miles? Heavy new supply (>2% of stock underway) typically softens rents 12–24 months out; light construction supports rent growth.
Investment metrics
- 1% rule
- 1.47% ✓
- Cap rate
- 8.23%
- Cash-on-cash
- 6.92%
- DSCR
- 1.31
- GRM
- 5.7
CMA / ARV
No comps found within radius.
Projected returns pro-forma
-3.0% appreciation · 5.59% rent growth · sell at horizon
- IRR
- -7.9%
- Equity multiple
- 0.70×
- Total profit
- $-34,031
- Equity at exit
- $59,626
- IRR
- 6.2%
- Equity multiple
- 1.54×
- Total profit
- $60,860
- Equity at exit
- $34,576
Cash invested: $111,972 (down + closing). Projections, not guarantees.
Landlord ↔ Tenant lean methodology
- Overall (STATE)
- 87 Strongly Landlord-Friendly
- State Florida
- 87 Strongly Landlord-Friendly · R+3
- County
- — inherits STATE
- City
- — inherits STATE
ZIP-level market 34113
- Rents YoY
- 5.6%
- Active inventory
- 598
- Price-to-rent
- 5.7×
Monthly cashflow live
- Estimated rent
- $5,881 high interval (Pro) →
- Mortgage (P&I)
- −$2,097
- Tax est. 1.5%
- −$500 /mo · $5,998/yr
- Insurance
- −$167
- Flood insurance flood zone
- −$427 /mo · $5,118/yr
- HOA
- −$1,237
- Vacancy / Maint / Mgmt
- −$1,235
- Net cashflow
- $219
Break-even live
Sensitivity live
| Price | -10% $495 | -5% $357 | +0% $219 | +5% $81 | +10% $-58 |
|---|---|---|---|---|---|
| Rent | -10% $-246 | -5% $-13 | +0% $219 | +5% $451 | +10% $683 |
| Rate | -1.0pp $420 | -0.5pp $321 | base $219 | +0.5pp $115 | +1.0pp $10 |
UW: 25.0% down · 7.5% · 30yr · 1.5% tax · 5.0% vac · 8.0% maint · 8.0% mgmt
Financing live
Cash to close
- Down payment
- $99,975
- Closing costs
- $11,997
- Reserves months
- —
- Total cash needed
- —
Loan-product check · same deal, 3 products live
Conventional
25% down · 7.5% · 30yr
- Down + closing
- —
- Monthly P&I
- —
- Monthly cashflow
- —
- DSCR
- —
- Eligible?
- —
Personal DTI + credit; lowest rate.
DSCR
20% down · 8.5% · 30yr
- Down + closing
- —
- Monthly P&I
- —
- Monthly cashflow
- —
- DSCR
- —
- Eligible?
- —
No personal income docs; deal must DSCR.
Hard money
10% down · 12.0% · 12mo
- Down + closing
- —
- Monthly P&I
- —
- Monthly cashflow
- —
- DSCR
- —
- Eligible?
- —
Short-term bridge; refi at stabilization.
Rent comps 40 comps
| Address | Beds | Baths | Sqft | Rent | $/sqft | DOM | Units | Dist |
|---|---|---|---|---|---|---|---|---|
| 9118 Chula Vista St #12002 Naples, FL | 2.0 | 2.5 | 1531 | $4,200 | $2.74 | 25d | 1 | 0.06mi |
| 9151 Delano St #9702 Naples, FL | 3.0 | 2.5 | 1733 | $2,650 | $1.53 | 15d | 1 | 0.09mi |
| 9155 Delano St Unit 1545913P Naples, FL | 3.0 | 2.0 | 1797 | $3,871 | $2.15 | 15d | 1 | 0.10mi |
| 9161 Chula Vista St Unit 135-2 Naples, FL | 4.0 | 3.0 | 1776 | $7,500 | $4.22 | 25d | 1 | 0.10mi |
| 9159 Delano St #9905 Naples, FL | 3.0 | 2.0 | 1770 | $4,995 | $2.82 | 25d | 1 | 0.10mi |
| 9102 Chula Vista St #11302 Naples, FL | 2.0 | 2.5 | 1531 | $2,695 | $1.76 | 22d | 1 | 0.12mi |
| 9115 Capistrano St S #8207 Naples, FL | 2.0 | 2.5 | 1494 | $6,000 | $4.02 | 25d | 1 | 0.12mi |
| 9111 Capistrano St S #8303 Naples, FL | 2.0 | 2.5 | 1432 | $7,500 | $5.24 | 25d | 1 | 0.14mi |
| 9109 Yuba Ln Unit 80 Naples, FL | 3.0 | 2.5 | 1729 | $3,900 | $2.26 | 25d | 1 | 0.15mi |
| 9092 Chula Vista St #11003 Naples, FL | 2.0 | 2.0 | 1404 | $6,850 | $4.88 | 25d | 1 | 0.15mi |
| 9088 Chula Vista St Unit 108-3 Naples, FL | 2.0 | 2.0 | 1404 | $5,700 | $4.06 | 25d | 1 | 0.17mi |
| 9187 Celeste Dr Unit 1073494P Naples, FL | 2.0 | 2.0 | 1399 | $2,979 | $2.13 | 15d | 1 | 0.18mi |
| 9102 Capistrano St S Unit 72-3 Naples, FL | 2.0 | 2.5 | 1520 | $6,500 | $4.28 | 25d | 1 | 0.20mi |
| 9072 Rialto St #6302 Naples, FL | 3.0 | 2.0 | 1771 | $8,250 | $4.66 | 22d | 1 | 0.25mi |
| 9076 Rialto St Unit 62 Naples, FL | 3.0 | 2.5 | 1624 | $7,500 | $4.62 | 25d | 1 | 0.25mi |
| 9081 Albion Ln S #6510 Naples, FL | 3.0 | 2.5 | 2004 | $6,280 | $3.13 | 15d | 1 | 0.25mi |
| 9081 Albion Ln S #6505 Naples, FL | 2.0 | 2.0 | 1225 | $7,500 | $6.12 | 25d | 1 | 0.25mi |
| 9073 Rialto St #6002 Naples, FL | 3.0 | 2.0 | 1771 | $7,500 | $4.23 | 25d | 1 | 0.28mi |
| 8967 Lely Island Cir Naples, FL | 3.0 | 2.0 | 2056 | $17,000 | $8.27 | 25d | 1 | 0.30mi |
| 9071 Albion Ln N #5706 Naples, FL | 2.0 | 2.5 | 1441 | $2,200 | $1.53 | 25d | 1 | 0.31mi |
| 9082 Capistrano St N Unit 48-5 Naples, FL | 2.0 | 2.0 | 1227 | $6,500 | $5.30 | 25d | 1 | 0.33mi |
| 9066 Albion Ln N #5106 Naples, FL | 3.0 | 2.5 | 1715 | $6,500 | $3.79 | 22d | 1 | 0.34mi |
| 9066 Albion Ln N Unit 51-1 Naples, FL | 3.0 | 2.5 | 1989 | $7,000 | $3.52 | 25d | 1 | 0.34mi |
| 8965 Malibu Ln #802 Naples, FL | 3.0 | 2.0 | 1771 | $6,595 | $3.72 | 25d | 1 | 0.35mi |
| 8519 Chase Preserve Dr Naples, FL | 2.0 | 2.0 | 1827 | $9,000 | $4.93 | 25d | 1 | 0.42mi |
| 9054 Capistrano St N #4002 Naples, FL | 3.0 | 2.0 | 1674 | $6,000 | $3.58 | 25d | 1 | 0.45mi |
| 9054 Capistrano St N #4003 Naples, FL | 2.0 | 2.0 | 1385 | $2,495 | $1.80 | 25d | 1 | 0.45mi |
| 8175 Celeste Dr Naples, FL | 2.0 | 2.0 | 1460 | $2,395 | $1.64 | 25d | 1 | 0.51mi |
| 8175 Celeste Dr #1230 Naples, FL | 2.0 | 2.0 | 1476 | $2,775 | $1.88 | 25d | 1 | 0.51mi |
| 8175 Celeste Dr #1229 Naples, FL | 3.0 | 2.0 | 1640 | $2,975 | $1.81 | 25d | 1 | 0.51mi |
| 6590 Beach Resort Dr Unit 305 Naples, FL | 2.0 | 2.0 | 1351 | $4,500 | $3.33 | 15d | 1 | 0.52mi |
| 8135 Celeste Dr #4218 Naples, FL | 2.0 | 2.0 | 1476 | $7,500 | $5.08 | 25d | 1 | 0.53mi |
| 9025 Alturas St #3102 Naples, FL | 2.0 | 3.0 | 1531 | $3,400 | $2.22 | 25d | 1 | 0.54mi |
| 8340 Mystic Greens Way #1501 Naples, FL | 2.0 | 2.0 | 1880 | $4,995 | $2.66 | 25d | 1 | 0.56mi |
| 8986 Cambria Cir #2204 Naples, FL | 3.0 | 2.0 | 1771 | $7,500 | $4.23 | 25d | 1 | 0.59mi |
| 8986 Cambria Cir Unit 22 Naples, FL | 2.0 | 2.0 | 1404 | $6,000 | $4.27 | 25d | 1 | 0.59mi |
| 8540 Mystic Greens Way #305 Naples, FL | 2.0 | 2.0 | 1710 | $4,995 | $2.92 | 15d | 1 | 0.59mi |
| 6903 Mauna Loa Ln Naples, FL | 3.0 | 2.5 | 2224 | $13,500 | $6.07 | 25d | 1 | 0.63mi |
| 8125 Celeste Dr #5216 Naples, FL | 3.0 | 2.0 | 1640 | $4,500 | $2.74 | 25d | 1 | 0.64mi |
| 8125 Celeste Dr #5113 Naples, FL | 3.0 | 2.0 | 1635 | $7,000 | $4.28 | 25d | 1 | 0.64mi |
HOA detail condo
- Monthly dues
- $1,237 · $14,844/yr
- Likely covers
- pool
- Assessments
- None detected in remarks — confirm with the listing agent.
Listing history 18 events
-
2026-06-18days on market $399,900 Active 428 DOM
-
2026-06-17days on market $399,900 Active 427 DOM
-
2026-06-16days on market $399,900 Active 426 DOM
-
2026-06-15days on market $399,900 Active 425 DOM
-
2026-06-10days on market $399,900 Active 420 DOM
-
2026-06-09days on market $399,900 Active 419 DOM
-
2026-06-08days on market $399,900 Active 418 DOM
-
2026-06-07days on market $399,900 Active 417 DOM
-
2026-06-02days on market $399,900 Active 412 DOM
-
2026-06-01days on market $399,900 Active 411 DOM
-
2026-05-31days on market $399,900 Active 410 DOM
-
2026-05-30days on market $399,900 Active 409 DOM
-
2026-05-05price $399,900
-
2026-03-09price $409,000
-
2026-01-08$7,500
-
2026-01-08historical $7,500
-
2025-08-13$7,500
-
2025-04-16$479,000 Active
ⓘ Source: listings_history table (triggers on properties + properties_extension) + one-shot
backfill from property_details.listing_events for pre-trigger history.
Climate risk First Street
- Flood 7/10 Severe FEMA zone AE · 76% chance over 30 yrs
- Wildfire 4/10 Moderate
- Heat 10/10 Extreme 7 d/yr ≥108°F today · 30 d/yr by 30 yrs out
- Wind 10/10 Extreme 99% chance of damaging wind over 30 yrs
- Air quality 2/10 Low 2 unhealthy d/yr today · 2 by 30 yrs out
Nearby sold comps map
Loading sold comps map…
Walkable amenities ~0.75 mi
Loading nearby amenities…
Taxation est. · year 1
- Rental income
- $70,572
- − Mortgage interest
- −$22,401
- − Property taxes
- −$5,998
- − Insurance
- −$7,118
- − Repairs & maintenance
- −$5,646
- − Management
- −$5,646
- − HOA
- −$14,844
- − Depreciation
- −$11,633
- Taxable loss
- −$2,714
- Est. tax savings @ 24.0%
- +$651
- After-tax cash flow
- $3,277/yr
For passive investors: Depreciation is non-cash, so a rental often shows a tax loss while cash-flowing — sheltering income. Rental losses are passive: they offset passive income freely, and up to $25,000/yr can offset ordinary (W-2) income if you actively participate and your MAGI is under $100k (phasing out to $0 by $150k); unused losses carry forward. On sale, claimed depreciation is recaptured at up to 25%, and gains may owe capital-gains tax (a 1031 exchange can defer both). Figures are a year-1 estimate at your 24.0% rate — not tax advice; consult a CPA.
Schools (NCES district)
- District
- Collier
- NCES district ID
- 1200330
- Math proficiency
- 60% ▼ -4.00%
- Reading proficiency
- 56% ▼ -2.00%
- Median HH income
- $58,275
- Composite
- 50.23/100
- National rank
- #1892
- State rank
- #16 of 73 in FL
Livability — Lely Resort
- Score
- 61/100
- State rank
- #786
- US rank
- #17981
Category grades
Schools grade is shown separately in the Schools card above.
Census & demographics
- Census place
- Lely Resort, FL
- County
- Collier County · 396,295 people
- Metro
- Naples-Marco Island, FL
- Population (ZIP)
- 26,056
- Household income
- $81,674
- Rent vs Own
- Severe rent burden
- 954.0
Population outlook (Collier County) Hauer SSP2
- Today (2025)
- 420,858 people
- By 2030
- 450,054 · +6.9%
- By 2040
- 502,232 · +19.3%
- By 2050
- 544,932 · +29.5%
- By 2075
- 627,203 · +49.0%
- By 2100
- 659,015 · +56.6%
Race, ethnicity, and origin ACS 2023
- Neighborhood character
- Diverse neighborhood (Simpson 0.59)
- Race & ethnicity
- White 56% Hispanic / Latino 28% Black 12% Two or more races 11% Asian 2%
- Hispanic origin (detail)
- Mexican 17% Puerto Rican 3% Cuban 2%
- Common ancestry
- Hispanic 10% Romanian 3% Lithuanian 2%
- Foreign-born
- 26% · Canada, Jamaica, Vietnam
- Languages at home
- 63% English-only · Spanish 24% French/Haitian/Cajun 9% Other Indo-European 2%
Political lean MEDSL · Collier
- 2024 margin
- Solid R (+33.1) · D 33.1% · R 66.2%
- 2008→2024 swing
- -10.6pp toward R · 2008: -22.5pp · 2024: -33.1pp
- All cycles
- 2024: R+33.1 2020: R+24.7 2016: R+26.0 2012: R+30.1 2008: R+22.5
Not yet ingested
- Civics
- —
Market trends
- HPI YoY
- ▼ -194.86%
- Current HPI
- 279.4232
- Rent YoY
- ▲ 5.59%
- Metro
- Naples-Marco Island, FL
- State GDP YoY
- ▲ 3.28%
- F500 in state
- 36
Industry mix (Fortune 500 HQ in FL)
| Industry | F500 HQs | Revenue |
|---|---|---|
| Industrial Technology | 2 | $29B |
|
||
| Insurance | 2 | $17B |
|
||
| Retail | 1 | $60B |
|
||
| Technology Distribution | 1 | $58B |
|
||
| Homebuilding | 1 | $35B |
|
||
| Technology Manufacturing | 1 | $35B |
|
||
Price history
-16.5% since first listed6 events — show timeline
- 2026-05-05 Price Changed $399,900 NAPLESMLS
- 2026-03-09 Price Changed $409,000 NAPLESMLS
- 2026-01-08 Listed for Rent $7,500 FGCMLS
- 2026-01-08 Rental Removed $7,500 NAPLESMLS
- 2025-08-13 Listed for Rent $7,500 NAPLESMLS
- 2025-04-16 Listed $479,000 NAPLESMLS
Cash-flow waterfall
monthlySold comps — $/sqft
last 12 mo · ≤1 miLoading sold comps…