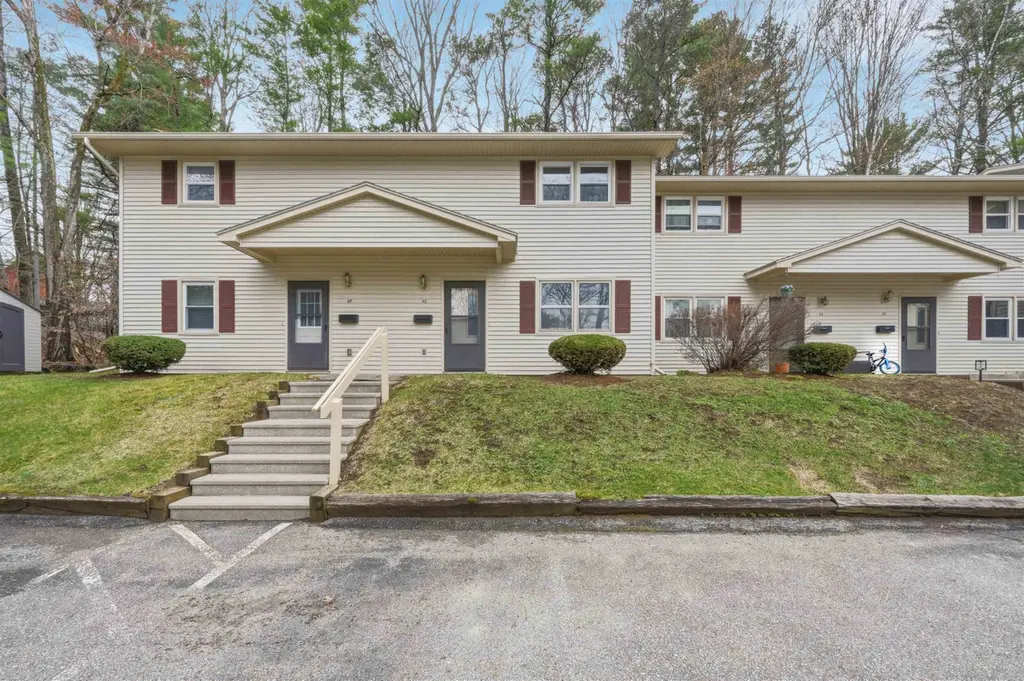
86 Pinecrest Dr Unit 4E · Essex, VT
Flood risk No data
- FEMA flood zone
- —
- Chance of flooding over 30 yrs
- —
- Est. flood insurance / yr
- —
Fire risk No data
- Est. fire insurance / yr
- —
Heat risk No data
- Hot days now (above threshold)
- —
- Hot days in 30 yrs
- —
Wind risk No data
- Chance of severe wind over 30 yrs
- —
Air-quality risk No data
- Unhealthy air days now
- —
- Unhealthy air days in 30 yrs
- —
Risk factors via First Street. Map © Google.
Why this score? — see what drove the D- grade
The composite is a weighted blend of 9 inputs, each scored 0–100. Each bar is that input's sub-score; the figure is the points it added to the 100-point composite (weight × sub-score).
- Cash flow +10.1/30.0
- ARV discount +7.5/15.0
- Schools +5.0/10.0
- 1% rule +3.9/10.0
- DSCR +2.9/10.0
- Rent growth +2.5/5.0
- Livability +2.5/5.0
- Condition / age +2.5/5.0
- Appreciation +0.0/10.0
$239,900
🖨 Deal sheet (PDF) 📄 Offer letter ✓ Due diligence
Listing remarks
Excellent value! This 2 bedroom, 1 bath condo is located in the desirable Royale Parke community and offers an opportunity that’s hard to find at this price point. Conveniently situated close to shopping, dining, and everyday amenities, this home combines comfort and location. Inside, you’ll find a functional layout with great natural light. A sliding glass door leads you out to a nice outdoor area perfect for relaxing or enjoying fresh air right from your living space. Don’t miss your chance to own an affordable condo in a well-located community!
Key facts
- Great natural light
- Outdoor area
- Functional layout
Tags
Neighborhood map
What this means for you Summary
Snapshot
- This is a 2-bed/1.0-bath condo listed at $240k.
Deal economics
- At list price, monthly cash flow is $-142 ($-2k/yr) — negative.
- To cash-flow at today's rent, offer at most $215k (10.5% below list).
- To meet the 1% rule (rent ≥ 1% of price), the offer needs to be $213k (11.3% below list).
- Recommended offer: $213k (11.3% below list) — sets the bar for 1% rule.
Location & tenants
- Location reads: area grade D — affects rentability + tenant quality, not the cash-flow math above.
- Market conditions: 95 active listings in the ZIP; 8 comparable units currently listed for rent nearby; rentals lingering (median 46d on market — plan ~5-8 weeks vacancy on turnover, expect pricing pressure); 62% of comp listings sitting > 30 days — soft ceiling on asking rent; solid renter incomes; 898 units permitted in Chittenden County in 2024 (554 in 5+ unit buildings).
Forward outlook
- Local home prices are declining (-3.0%/yr); year-one equity from $2k of loan paydown is wiped out by about $7k of value loss. Plan a longer hold.
- Chittenden County population projected at +8% by 2050 — modest demand growth; plan on rents tracking national, not racing it.
Negotiation context
- It's been on market 48 days — a 3% lower offer ($233k) is reasonable based on typical stale-listing flexibility.
Questions for the listing agent
- What do current leases actually rent for vs. the listed asking? Can we see a recent rent roll and the last 12 months of T-12 income?
- It's been on market 48 days. Have you received any prior offers? Is the seller open to a 11% concession, seller financing, or rate buy-down credit?
- Built in 1978 — when were the roof, HVAC, electrical panel, plumbing, and water heater last replaced?
- What does the HOA fee cover, when was the last increase, and are there any pending special assessments or reserve-fund shortfalls?
- Any open or pending special assessments — roof, HVAC, plumbing, elevator, façade? What's the per-unit balance and payoff schedule, and is the seller paying it off at close or rolling it to the buyer?
- Is there a deadline driving the sale (1031 exchange, divorce, estate, relocation)? That informs how much negotiation room exists.
- The area grade is low — what's the realistic commute time and amenity access for the typical tenant pool here? Any planned neighborhood developments (good or bad) we should know about?
- What's the average days-on-market for RENTAL listings here right now (not sales)? A rising rental-DOM trend means longer vacancies and softer asking-rent achievability than the comps imply.
- What's the recent tenant-quality profile in this submarket — average credit score on applications, eviction rate, late-payment / NSF rate, and stable-employment percentage? A property-management company in the area should have these aggregated.
- How much new apartment / multifamily construction is in the pipeline within 1–3 miles? Heavy new supply (>2% of stock underway) typically softens rents 12–24 months out; light construction supports rent growth.
Investment metrics
- 1% rule
- 0.89% ✗
- Cap rate
- 5.58%
- Cash-on-cash
- -2.54%
- DSCR
- 0.89
- GRM
- 9.4
CMA / ARV
No comps found within radius.
Projected returns pro-forma
-3.0% appreciation · 3.0% rent growth · sell at horizon
- IRR
- -20.4%
- Equity multiple
- 0.29×
- Total profit
- $-47,791
- Equity at exit
- $35,770
- IRR
- -13.5%
- Equity multiple
- 0.22×
- Total profit
- $-52,728
- Equity at exit
- $20,742
Cash invested: $67,172 (down + closing). Projections, not guarantees.
Landlord ↔ Tenant lean methodology
- Overall (STATE)
- 41 Moderately Tenant-Leaning
- State Vermont
- 41 Moderately Tenant-Leaning · D+15
- County
- — inherits STATE
- City
- — inherits STATE
ZIP-level market 05452
- Active inventory
- 95
- Price-to-rent
- 9.4×
Monthly cashflow live
- Estimated rent
- $2,127 high interval (Pro) →
- Mortgage (P&I)
- −$1,258
- Tax from tax record
- −$225 /mo · $2,696/yr
- Insurance
- −$100
- HOA
- −$240
- Vacancy / Maint / Mgmt
- −$447
- Net cashflow
- $-142
Break-even live
Sensitivity live
| Price | -10% $-6 | -5% $-74 | +0% $-142 | +5% $-210 | +10% $-278 |
|---|---|---|---|---|---|
| Rent | -10% $-310 | -5% $-226 | +0% $-142 | +5% $-58 | +10% $26 |
| Rate | -1.0pp $-21 | -0.5pp $-81 | base $-142 | +0.5pp $-204 | +1.0pp $-268 |
UW: 25.0% down · 7.5% · 30yr · 1.5% tax · 5.0% vac · 8.0% maint · 8.0% mgmt
Financing live
Cash to close
- Down payment
- $59,975
- Closing costs
- $7,197
- Reserves months
- —
- Total cash needed
- —
Loan-product check · same deal, 3 products live
Conventional
25% down · 7.5% · 30yr
- Down + closing
- —
- Monthly P&I
- —
- Monthly cashflow
- —
- DSCR
- —
- Eligible?
- —
Personal DTI + credit; lowest rate.
DSCR
20% down · 8.5% · 30yr
- Down + closing
- —
- Monthly P&I
- —
- Monthly cashflow
- —
- DSCR
- —
- Eligible?
- —
No personal income docs; deal must DSCR.
Hard money
10% down · 12.0% · 12mo
- Down + closing
- —
- Monthly P&I
- —
- Monthly cashflow
- —
- DSCR
- —
- Eligible?
- —
Short-term bridge; refi at stabilization.
Rent comps 8 comps
| Address | Beds | Baths | Sqft | Rent | $/sqft | DOM | Units | Dist |
|---|---|---|---|---|---|---|---|---|
| 85 Griffin Ln Essex Junction, VT | 2.0 | 2.0 | 1000 | $2,180 | $2.18 | 23d | 1 | 0.52mi |
| 65 Griffin Ln Unit 65-102 Essex Junction, VT | 2.0 | 1.0 | 960 | $1,975 | $2.06 | 46d | 1 | 0.52mi |
| 21 Pinecrest Dr Unit 305 Essex Junction, VT | 1.0 | 1.0 | 761 | $1,666 | $2.19 | 45d | 1 | 0.56mi |
| 239 Autumn Pond Way Unit 239-104 Essex Junction, VT | 1.0 | 1.0 | 788 | $2,200 | $2.79 | 45d | 1 | 0.76mi |
| 177 Autumn Pond Way Unit 177-208 Essex Junction, VT | 2.0 | 2.0 | 933 | $2,550 | $2.73 | 45d | 1 | 0.81mi |
| 177 Autumn Pond Way Unit 177-301 Essex Junction, VT | 2.0 | 2.0 | 1057 | $2,600 | $2.46 | 45d | 1 | 0.81mi |
| 375 Autumn Pond Way Essex Junction, VT | 1.0–2.0 | 1.0–2.0 | 957 | $2,650 | $2.77 | 23d | 9 | 0.84mi |
| 2 Brickyard Rd Unit A Essex Junction, VT | 1.0 | 1.0 | 900 | $2,000 | $2.22 | 23d | 1 | 1.30mi |
HOA detail condo
- Monthly dues
- $240 · $2,880/yr
- Assessments
- None detected in remarks — confirm with the listing agent.
Listing history 8 events
-
2026-06-08days on market $239,900 Active 48 DOM
-
2026-06-07days on market $239,900 Active 47 DOM
-
2026-06-02days on market $239,900 Active 42 DOM
-
2026-06-01days on market $239,900 Active 41 DOM
-
2026-05-31days on market $239,900 Active 40 DOM
-
2026-05-30days on market $239,900 Active 39 DOM
-
2026-05-08price $239,900 571-char remark
-
2026-04-21$249,900 Active 571-char remark
ⓘ Source: listings_history table (triggers on properties + properties_extension) + one-shot
backfill from property_details.listing_events for pre-trigger history.
Tax reassessment forecast VT · Partial reset (capped growth)
- Current annual tax
- $2,696 · $225/mo
- Projected year-2 tax
- $3,627 · $302/mo
- Expected delta
- +$931/yr (+$78/mo · 34.5%)
ⓘ Screening estimate from a state-policy table — verify with the county assessor before closing.
Nearby sold comps map
Loading sold comps map…
Walkable amenities ~0.75 mi
Loading nearby amenities…
Taxation est. · year 1
- Rental income
- $25,527
- − Mortgage interest
- −$13,438
- − Property taxes
- −$2,696
- − Insurance
- −$1,200
- − Repairs & maintenance
- −$2,042
- − Management
- −$2,042
- − HOA
- −$2,880
- − Depreciation
- −$6,979
- Taxable loss
- −$5,749
- Est. tax savings @ 24.0%
- +$1,380
- After-tax cash flow
- $-325/yr
For passive investors: Depreciation is non-cash, so a rental often shows a tax loss while cash-flowing — sheltering income. Rental losses are passive: they offset passive income freely, and up to $25,000/yr can offset ordinary (W-2) income if you actively participate and your MAGI is under $100k (phasing out to $0 by $150k); unused losses carry forward. On sale, claimed depreciation is recaptured at up to 25%, and gains may owe capital-gains tax (a 1031 exchange can defer both). Figures are a year-1 estimate at your 24.0% rate — not tax advice; consult a CPA.
Schools (NCES district)
No district data.
Livability — Essex
No livability data for this city. (Only ~50 U.S. cities are tracked.)
Census & demographics
- County
- Chittenden County · 110,603 people
- City population
- 22,626
- Metro
- Burlington-South Burlington, VT
- Population (ZIP)
- 22,626
- Household income
- $101,349
- Rent vs Own
- Severe rent burden
- 512.0
Population outlook (Chittenden County) Hauer SSP2
- Today (2025)
- 170,769 people
- By 2030
- 174,716 · +2.3%
- By 2040
- 180,337 · +5.6%
- By 2050
- 183,768 · +7.6%
- By 2075
- 194,646 · +14.0%
- By 2100
- 194,933 · +14.2%
Race, ethnicity, and origin ACS 2023
- Neighborhood character
- Predominantly White (84%)
- Race & ethnicity
- White 84% Two or more races 6% Asian 5% Black 4% Hispanic / Latino 2%
- Common ancestry
- Lithuanian 7% Romanian 4% Italian 3%
- Foreign-born
- 12% · Canada, India, China
- Languages at home
- 86% English-only · Other Indo-European 5% Russian/Polish/Slavic 2% French/Haitian/Cajun 2%
Political lean MEDSL · Chittenden
- 2024 margin
- Solid D (+53.6) · D 75.4% · R 21.7% · Other 2.9%
- 2008→2024 swing
- +8.9pp toward D · 2008: 44.8pp · 2024: 53.6pp
- All cycles
- 2024: D+53.6 2020: D+54.5 2016: D+46.8 2012: D+41.9 2008: D+44.8
Not yet ingested
- Civics
- —
Market trends
- HPI YoY
- ▼ -218.29%
- Current HPI
- 310.788
- Rent YoY
- —
- Metro
- Burlington-South Burlington, VT
- State GDP YoY
- —
- F500 in state
- 0
Price history
1 event — show timeline
- 2026-05-08 Price Changed $239,900 PrimeMLS
Property tax history
+20.3%/yrLatest (2024): $2,696 · +11.8% YoY. Source: county tax records.
Cash-flow waterfall
monthlySold comps — $/sqft
last 12 mo · ≤1 miLoading sold comps…