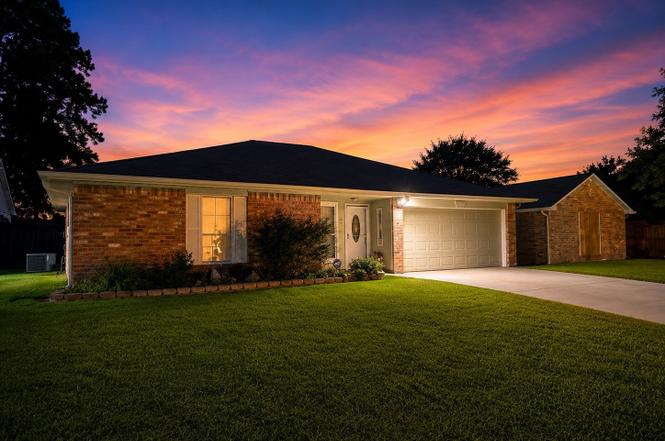
5810 Sunnygate Dr · Spring, TX
Flood risk 1/10 · Minimal
- FEMA flood zone
- X (unshaded)
- Chance of flooding over 30 yrs
- 0.0%
- Est. flood insurance / yr
- $507 – $1,088
Fire risk 3/10 · Minor
- Est. fire insurance / yr
- $1,222 – $2,270
Heat risk 9/10 · Severe
- Hot days now (above 111°F)
- 7 days/yr
- Hot days in 30 yrs
- 25 days/yr
Wind risk 8/10 · Major
- Chance of severe wind over 30 yrs
- 99.0%
Air-quality risk 3/10 · Minor
- Unhealthy air days now
- 3 days/yr
- Unhealthy air days in 30 yrs
- 3 days/yr
Risk factors via First Street. Map © Google.
Why this score? — see what drove the D+ grade
The composite is a weighted blend of 9 inputs, each scored 0–100. Each bar is that input's sub-score; the figure is the points it added to the 100-point composite (weight × sub-score).
- Cash flow +20.5/30.0
- DSCR +6.5/10.0
- 1% rule +6.3/10.0
- Livability +3.3/5.0
- ARV discount +3.0/15.0
- Condition / age +2.5/5.0
- Rent growth +2.4/5.0
- Schools +2.0/10.0
- Appreciation +0.0/10.0
$200,000
🖨 Deal sheet 📄 Offer letter ✓ Due diligence
Listing remarks
Well-maintained 4-bedroom, 2-bath home offering a great mix of comfort, updates, and practical features. The interior includes granite countertops, updated double-pane windows, durable LVP flooring, and a bright, functional layout. Outside, enjoy a covered patio with nice lighting, an outdoor fireplace, and plenty of space for entertaining or relaxing. Additional features include water treatment filters, a wide driveway with ample parking, a large shed on a concrete pad, and a huge gas tank already in place for future generator installation. The community also offers great amenities for families, including a clubhouse available to reserve for events, a community pool, tennis/pickleball cour
Key facts
- Outdoor fireplace
- Covered patio
- Lvp flooring
Tags
Property features AI
Finance
- HOA & community: Association managed by Consolidated Mgnt; Annual association fee of $350; Association fee covers clubhouse, common areas, and recreation facilities; Community amenities include clubhouse, playground, pickleball, park, pool, and tennis courts; Community pool
Exterior
- Parking: Attached garage (2 spaces)
- Security: Owned security system
- Utilities: Public water; Public sewer
- Home design: Residential property; Full ownership; Built in 1977; Slab foundation; Composition roof
- Construction: Brick construction
- Exterior features: Subdivision lot; Concrete road surface; Association pool
Interior
- Kitchen: Granite counters; Dishwasher; Electric oven; Electric range
- Bedrooms: Primary bedroom on the first floor (14 x 13); Bedroom on the first floor (13 x 11); Bedroom on the first floor (11 x 11); Bedroom on the first floor (11 x 11)
- Flooring: Plank flooring; Vinyl flooring
- Bathrooms: 2 full bathrooms
- Heating & cooling: Central heating (electric); Central air (electric)
- Interior features: Entrance foyer; Granite counters; High ceilings; Vaulted ceilings; Kitchen/family room combo; Kitchen/dining combo; Tub with shower; Ceiling fans; Programmable thermostat; Low emissivity windows; Ventilation for improved indoor air quality
- Laundry & utility: Washer included; Electric dryer hookup
Neighborhood map
What this means for you Summary
Snapshot
- This is a 3-bed/2.0-bath single-family listed at $200k.
Deal economics
- At list price, monthly cash flow is $264 ($3k/yr) — positive.
- The deal already cash-flows at list — no discount required.
- Meets the 1% rule at list price ($2k rent vs $200k).
- Cap rate 7.9% vs local median 4.5% in Spring — top-decile yield for the area; either an underpriced asset or a hidden risk that comps aren't pricing in. Stress-test before assuming the spread holds.
Location & tenants
- Location reads 66/100 on livability (#635 in TX) — a middle-class / working-renter tenant base. Strengths: cost of living A+, housing A+, employment B; Watch: crime D, amenities F, commute F.
- Spring ISD (suburban): math 19% / reading 26% proficiency, ranked #730 of 826 in TX (top 88%) — low school quality limits family demand, transient renter base, plan for 1-2y turnover; 66% free/reduced lunch — lower-income household profile, screen leases tightly.
- Zoned schools: Chet Burchett El (math 30% / reading 35%, grade F, #2,234 of 4,322 statewide, top 52%, 904 students, 82% FRL); Dueitt Middle (math 12% / reading 23%, grade F, #1,507 of 1,662 statewide, top 91%, 773 students, 84% FRL); Spring H S (math 12% / reading 21%, grade F, #1,497 of 1,632 statewide, top 92%, 2,760 students, 72% FRL).
- Market conditions: Rents soft (-0.3%/yr); 595 active listings in the ZIP; solid renter incomes; 29,883 units permitted in Harris County in 2024 (8,621 in 5+ unit buildings).
- This rent runs 30% of the median local income ($89k/yr) — at the standard rent-burdened threshold; future hikes will face affordability resistance.
Forward outlook
- Local home prices are declining (-3.0%/yr); year-one equity from $1k of loan paydown is wiped out by about $6k of value loss. Plan a longer hold.
- Harris County population projected at +47% by 2050 — long-run rental-demand tailwind backs the buy-and-hold thesis.
Negotiation context
- Only 5 days on market — expect competitive offers; lowballing is unlikely to land.
- Current owner paid $42k; list at $200k implies a 371% gain — meaningful room to come down on a strong offer.
Risks & watch-outs
- Climate carrying-cost: severe wind risk, 99% chance of damaging wind over 30y; extreme-heat days projected 7→25/yr by 2055 (HVAC capex compounding) — expect insurance premiums to compound above CPI over the hold.
Questions for the listing agent
- Built in 1977 — when were the roof, HVAC, electrical panel, plumbing, and water heater last replaced?
- What does the HOA fee cover, when was the last increase, and are there any pending special assessments or reserve-fund shortfalls?
- Is there a deadline driving the sale (1031 exchange, divorce, estate, relocation)? That informs how much negotiation room exists.
- Crime grade is D in this area — have there been break-ins, vandalism, or insurance claims at this property in the last 3 years? What carrier currently insures it and at what premium?
- The area grade is low — what's the realistic commute time and amenity access for the typical tenant pool here? Any planned neighborhood developments (good or bad) we should know about?
- What's the average days-on-market for RENTAL listings here right now (not sales)? A rising rental-DOM trend means longer vacancies and softer asking-rent achievability than the comps imply.
- What's the recent tenant-quality profile in this submarket — average credit score on applications, eviction rate, late-payment / NSF rate, and stable-employment percentage? A property-management company in the area should have these aggregated.
- How much new for-sale + rental construction is in the pipeline within 1–3 miles? Heavy new supply typically softens prices + rents 12–24 months out; constrained supply supports both.
Investment metrics
- 1% rule
- 1.13% ✓
- Cap rate
- 7.87%
- Cash-on-cash
- 5.65%
- DSCR
- 1.25
- GRM
- 7.4
CMA / ARV
- ARV (on-the-fly)
- $182,000
- Comps found
- 5
Show comp detail 5 sales within ~0.75 mi
| Address | Dist | Beds/Ba | Sqft | Sold | Price | $/sf | Match |
|---|---|---|---|---|---|---|---|
| 5715 Walnutgate Dr | 0.06mi | 3/2.0 | 1,565 (+12%) | 4mo | $220,000 | $141 | 74 |
| 22731 Melham Ln | 0.20mi | 3/2.0 | 1,533 (+10%) | 13mo | $190,000 | $124 | 64 |
| 6422 Brookgate Dr | 0.50mi | 3/2.0 | 1,446 (+3%) | 12mo | $187,900 | $130 | 61 |
| 5603 Rivergate Dr | 0.33mi | 3/2.0 | 1,537 (+10%) | 20mo | $190,000 | $124 | 52 |
| 22510 Arborgate Dr | 0.59mi | 4/2.0 (+1) | 1,420 (+1%) | 18mo | $190,000 | $134 | 50 |
Match score weights: distance 35% · size 25% · config 20% · recency 20%. Top-matched comps best support the ARV.
Projected returns pro-forma
-3.0% appreciation · 0.0% rent growth · sell at horizon
- IRR
- -11.2%
- Equity multiple
- 0.61×
- Total profit
- $-22,106
- Equity at exit
- $29,821
- IRR
- -7.5%
- Equity multiple
- 0.60×
- Total profit
- $-22,663
- Equity at exit
- $17,292
Cash invested: $56,000 (down + closing). Projections, not guarantees.
Landlord ↔ Tenant lean methodology
- Overall (STATE)
- 87 Strongly Landlord-Friendly
- State Texas
- 87 Strongly Landlord-Friendly · R+5
- County
- — inherits STATE
- City
- — inherits STATE
ZIP-level market 77373
- Rents YoY
- -0.3%
- Active inventory
- 595
- Price-to-rent
- 7.4×
Monthly cashflow live
- Estimated rent
- $2,251 medium interval (Pro) →
- Mortgage (P&I)
- −$1,049
- Tax from tax record
- −$354 /mo · $4,245/yr
- Insurance
- −$83
- HOA
- −$29
- Vacancy / Maint / Mgmt
- −$473
- Net cashflow
- $264
Break-even live
UW: 25.0% down · 7.5% · 30yr · 1.5% tax · 5.0% vac · 8.0% maint · 8.0% mgmt
Financing live
Cash to close
- Down payment
- $50,000
- Closing costs
- $6,000
- Reserves months
- —
- Total cash needed
- —
Loan-product check · same deal, 3 products live
Conventional
25% down · 7.5% · 30yr
- Down + closing
- —
- Monthly P&I
- —
- Monthly cashflow
- —
- DSCR
- —
- Eligible?
- —
Personal DTI + credit; lowest rate.
DSCR
20% down · 8.5% · 30yr
- Down + closing
- —
- Monthly P&I
- —
- Monthly cashflow
- —
- DSCR
- —
- Eligible?
- —
No personal income docs; deal must DSCR.
Hard money
10% down · 12.0% · 12mo
- Down + closing
- —
- Monthly P&I
- —
- Monthly cashflow
- —
- DSCR
- —
- Eligible?
- —
Short-term bridge; refi at stabilization.
HOA detail
- Monthly dues
- $29 · $348/yr
- Likely covers
- watergaspool
Listing history 6 events
-
2026-06-18days on market $200,000 Pending 5 DOM
-
2026-06-18status $200,000 Pending 4 DOM
-
2026-06-17days on market $200,000 Active 4 DOM
-
2026-06-16days on market $200,000 Active 3 DOM
-
2026-06-15remarks 699-char remark
-
2026-06-15$200,000 Active 2 DOM
ⓘ Source: listings_history table (triggers on properties + properties_extension) + one-shot
backfill from property_details.listing_events for pre-trigger history.
Tax reassessment forecast TX · Resets to sale price
- Current annual tax
- $4,245 · $354/mo
- Projected year-2 tax
- $4,245 · $354/mo
- Expected delta
- $0/yr ($0/mo · 0.0%)
ⓘ Screening estimate from a state-policy table — verify with the county assessor before closing.
Climate risk First Street
- Flood 1/10 Low FEMA zone X (unshaded) · 0% chance over 30 yrs
- Wildfire 3/10 Moderate
- Heat 9/10 Extreme 7 d/yr ≥111°F today · 25 d/yr by 30 yrs out
- Wind 8/10 Severe 99% chance of damaging wind over 30 yrs
- Air quality 3/10 Moderate 3 unhealthy d/yr today · 3 by 30 yrs out
Nearby sold comps map
Loading sold comps map…
Walkable amenities ~0.75 mi
Loading nearby amenities…
Taxation est. · year 1
- Rental income
- $27,014
- − Mortgage interest
- −$11,203
- − Property taxes
- −$4,245
- − Insurance
- −$1,000
- − Repairs & maintenance
- −$2,161
- − Management
- −$2,161
- − HOA
- −$348
- − Depreciation
- −$5,818
- Taxable income
- $78
- Est. tax owed @ 24.0%
- −$19
- After-tax cash flow
- $3,144/yr
For passive investors: Depreciation is non-cash, so a rental often shows a tax loss while cash-flowing — sheltering income. Rental losses are passive: they offset passive income freely, and up to $25,000/yr can offset ordinary (W-2) income if you actively participate and your MAGI is under $100k (phasing out to $0 by $150k); unused losses carry forward. On sale, claimed depreciation is recaptured at up to 25%, and gains may owe capital-gains tax (a 1031 exchange can defer both). Figures are a year-1 estimate at your 24.0% rate — not tax advice; consult a CPA.
Schools (NCES district)
- District
- Spring ISD
- NCES district ID
- 4841220
- Math proficiency
- 19% ▼ -13.00%
- Reading proficiency
- 26% ▼ -6.00%
- Median HH income
- $51,584
- Composite
- 20.12/100
- National rank
- #8643
- State rank
- #730 of 826 in TX
Livability — Spring
- Score
- 66/100
- State rank
- #635
- US rank
- #12101
Category grades
Schools grade is shown separately in the Schools card above.
Census & demographics
- Census place
- Spring, TX
- County
- Harris County · 4,702,590 people
- City population
- 430,529
- Metro
- Houston-The Woodlands-Sugar Land, TX
- Population (ZIP)
- 69,739
- Household income
- $88,617
- Rent vs Own
- Severe rent burden
- 1050.0
Population outlook (Harris County) Hauer SSP2
- Today (2025)
- 5,571,493 people
- By 2030
- 6,089,821 · +9.3%
- By 2040
- 7,142,806 · +28.2%
- By 2050
- 8,185,864 · +46.9%
- By 2075
- 10,574,329 · +89.8%
- By 2100
- 12,109,958 · +117.4%
Race, ethnicity, and origin ACS 2023
- Neighborhood character
- Diverse neighborhood (Simpson 0.69)
- Race & ethnicity
- Hispanic / Latino 40% White 30% Black 23% Two or more races 22% Asian 3%
- Hispanic origin (detail)
- Mexican 27% Puerto Rican 2% Cuban 2% Dominican 2%
- Common ancestry
- Lithuanian 2% Italian 1% Slovak 1%
- Foreign-born
- 17% · Canada, Jamaica, Vietnam
- Languages at home
- 64% English-only · Spanish 32% Vietnamese 1% Other Indo-European 1%
Political lean MEDSL · Harris
- 2024 margin
- Lean D (+5.5) · D 52.0% · R 46.4% · Other 1.6%
- 2008→2024 swing
- +3.9pp toward D · 2008: 1.6pp · 2024: 5.5pp
- All cycles
- 2024: D+5.5 2020: D+13.3 2016: D+12.4 2012: D+0.1 2008: D+1.6
Not yet ingested
- Civics
- —
Market trends
- HPI YoY
- ▼ -142.98%
- Current HPI
- 251.7231
- Rent YoY
- ▼ -0.30%
- Metro
- Houston-The Woodlands-Sugar Land, TX
- State GDP YoY
- ▲ 3.95%
- F500 in state
- 110
Industry mix (Fortune 500 HQ in TX)
| Industry | F500 HQs | Revenue |
|---|---|---|
| Energy | 16 | $1,198B |
|
||
| Technology | 5 | $198B |
|
||
| Engineering / Construction | 4 | $72B |
|
||
| Energy Services | 3 | $60B |
|
||
| Utilities | 3 | $41B |
|
||
| Healthcare | 2 | $330B |
|
||
Price history
+370.6% since first listed4 events — show timeline
- 2026-06-13 Listed $200,000 HARMLS
- 2026-06-13 Coming Soon $200,000 HARMLS
- 2002-07-16 Sold (Public Records) — Public Records
- 1989-01-20 Sold (Public Records) $42,500 Public Records
Property tax history
+3.8%/yrLatest (2025): $4,245 · -4.8% YoY. Source: county tax records.
Cash-flow waterfall
monthlySold comps — $/sqft
last 12 mo · ≤1 miLoading sold comps…