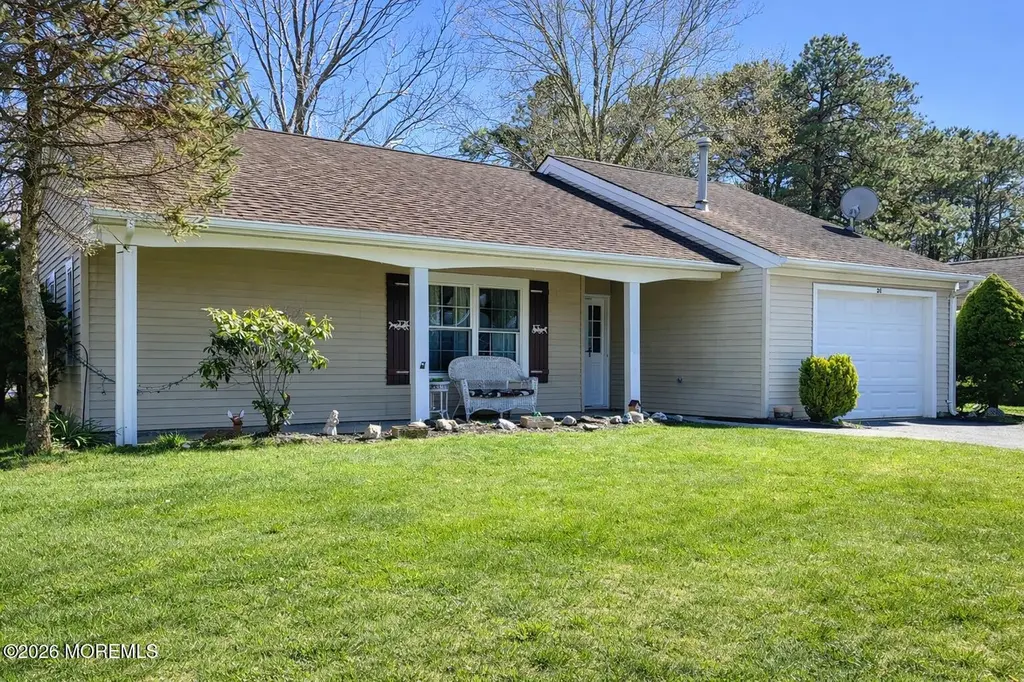
20 Norwick Dr · Forked River, NJ
Flood risk 1/10 · Minimal
- FEMA flood zone
- X (unshaded)
- Chance of flooding over 30 yrs
- 0.0%
- Est. flood insurance / yr
- $507 – $1,088
Fire risk 3/10 · Minor
- Est. fire insurance / yr
- $526 – $976
Heat risk 7/10 · Major
- Hot days now (above 98°F)
- 7 days/yr
- Hot days in 30 yrs
- 15 days/yr
Wind risk 7/10 · Major
- Chance of severe wind over 30 yrs
- 78.0%
Air-quality risk 2/10 · Minimal
- Unhealthy air days now
- 1 days/yr
- Unhealthy air days in 30 yrs
- 3 days/yr
Risk factors via First Street. Map © Google.
Why this score? — see what drove the C- grade
The composite is a weighted blend of 9 inputs, each scored 0–100. Each bar is that input's sub-score; the figure is the points it added to the 100-point composite (weight × sub-score).
- Cash flow +17.5/30.0
- ARV discount +15.0/15.0
- DSCR +5.5/10.0
- 1% rule +4.9/10.0
- Livability +3.1/5.0
- Schools +3.0/10.0
- Rent growth +2.5/5.0
- Condition / age +2.5/5.0
- Appreciation +0.0/10.0
$300,000
🖨 Deal sheet 📄 Offer letter ✓ Due diligence
Listing remarks MLS
Welcome to this great opportunity in the desirable Pheasant Run adult community! This Cambridge model is ideally situated on a corner lot and offers comfortable, easy living. Enjoy a bright enclosed porch filled with natural light, perfect for relaxing. The home features a spacious living room, formal dining area, and an eat-in kitchen. There are 2 bedrooms, 2 full bathrooms, and a 1-car garage. Additional highlights include a newer hot water heater, pull-down attic access for extra storage, and all appliances included. Residents of Pheasant Run enjoy a beautiful clubhouse with a pool, along with affordable HOA fees. Come see all this home and community have to offer. You'll be glad you did!
Key facts
- Formal dining area
- Enclosed porch
- Eat-in kitchen
Tags
Neighborhood map
What this means for you Summary
Snapshot
- This is a 2-bed/2.0-bath single-family listed at $300k.
Deal economics
- At list price, monthly cash flow is $231 ($3k/yr) — positive.
- The deal already cash-flows at list — no discount required.
- To meet the 1% rule (rent ≥ 1% of price), the offer needs to be $298k (0.8% below list).
- Recommended offer: $291k (3.0% below list) — sets the bar for market timing.
- Cap rate 7.2% vs local median 3.2% in Forked River — top-decile yield for the area; either an underpriced asset or a hidden risk that comps aren't pricing in. Stress-test before assuming the spread holds.
Location & tenants
- Location reads 61/100 on livability (#464 in NJ) — a middle-class / working-renter tenant base. Strengths: housing A+, crime A-, employment A-; Watch: amenities F, commute F, cost of living F.
- Lacey Township School District (suburban): math 22% / reading 43% proficiency, ranked #299 of 472 in NJ (top 63%) — families likely to look elsewhere, expect single-tenant / working-renter base with shorter leases; only 19% free/reduced lunch — higher-income household profile.
- Market conditions: 190 active listings in the ZIP; 4,434 units permitted in Ocean County in 2024 (868 in 5+ unit buildings).
Forward outlook
- Local home prices are declining (-3.0%/yr); year-one equity from $2k of loan paydown is wiped out by about $9k of value loss. Plan a longer hold.
- Ocean County population projected to shrink 8% by 2050 — rents likely to lag national; underwrite the cash flow, not the appreciation.
Negotiation context
- It's been on market 33 days — a 3% lower offer ($291k) is reasonable based on typical stale-listing flexibility.
- 6 sale attempts since 16y ago with the ask held roughly flat each time — persistent listings suggest the price (not the market) is what's stuck; bring a comps-based counter.
- Current owner paid $95k; list at $300k implies a 216% gain — meaningful room to come down on a strong offer.
Risks & watch-outs
- Climate carrying-cost: major wind risk, 78% chance of damaging wind over 30y; extreme-heat days projected 7→15/yr by 2055 (HVAC capex compounding) — expect insurance premiums to compound above CPI over the hold.
Questions for the listing agent
- It's been on market 33 days. Have you received any prior offers? Is the seller open to a 3% concession, seller financing, or rate buy-down credit?
- What does the HOA fee cover, when was the last increase, and are there any pending special assessments or reserve-fund shortfalls?
- Is there a deadline driving the sale (1031 exchange, divorce, estate, relocation)? That informs how much negotiation room exists.
- What's the average days-on-market for RENTAL listings here right now (not sales)? A rising rental-DOM trend means longer vacancies and softer asking-rent achievability than the comps imply.
- What's the recent tenant-quality profile in this submarket — average credit score on applications, eviction rate, late-payment / NSF rate, and stable-employment percentage? A property-management company in the area should have these aggregated.
- How much new for-sale + rental construction is in the pipeline within 1–3 miles? Heavy new supply typically softens prices + rents 12–24 months out; constrained supply supports both.
Investment metrics
- 1% rule
- 0.99% ✗
- Cap rate
- 7.22%
- Cash-on-cash
- 3.31%
- DSCR
- 1.15
- GRM
- 8.4
CMA / ARV
- ARV (median comp)
- $384,545
- List price
- $300,000
- Delta
- -21.99%
- Verdict
- UNDERPRICED
- Comps
- 20 within 1.0 mi
Show comp detail 12 sales within ~0.75 mi
| Address | Dist | Beds/Ba | Sqft | Sold | Price | $/sf | Match |
|---|---|---|---|---|---|---|---|
| 20 Norwick Dr | 0.00mi | 2/2.0 | 1,232 (+1%) | 0mo | $280,000 | $227 | 99 |
| 40 Canterbury Dr | 0.29mi | 2/2.0 | 1,224 (0%) | 10mo | $361,800 | $296 | 79 |
| 11 Portsmouth Dr | 0.25mi | 2/2.0 | 1,127 (-8%) | 5mo | $300,000 | $266 | 70 |
| 2028 Brookdale Dr | 0.05mi | 2/2.0 | 1,405 (+15%) | 8mo | $345,000 | $246 | 66 |
| 69 Canterbury Dr | 0.22mi | 2/2.0 | 1,405 (+15%) | 2mo | $385,000 | $274 | 63 |
| 5 Portsmouth | 0.21mi | 2/2.0 | 1,404 (+15%) | 8mo | $335,000 | $239 | 59 |
| 1800 Ravine Dr | 0.42mi | 3/2.0 (+1) | 1,126 (-8%) | 4mo | $409,000 | $363 | 58 |
| 1991 Glen Oak Dr | 0.48mi | 3/2.0 (+1) | 1,308 (+7%) | 5mo | $495,000 | $378 | 57 |
| 1515 Clair Rd | 0.58mi | 2/1.5 | 1,358 (+11%) | 6mo | $386,000 | $284 | 47 |
| 1506 Beverly Rd | 0.65mi | 3/2.0 (+1) | 1,152 (-6%) | 10mo | $395,000 | $343 | 46 |
| 38 Sheffield Dr | 0.69mi | 2/2.0 | 1,405 (+15%) | 3mo | $435,000 | $310 | 41 |
| 2253 Crestwood Pl | 0.67mi | 3/2.0 (+1) | 1,394 (+14%) | 1mo | $510,000 | $366 | 40 |
Match score weights: distance 35% · size 25% · config 20% · recency 20%. Top-matched comps best support the ARV.
Projected returns pro-forma
-3.0% appreciation · 3.0% rent growth · sell at horizon
- IRR
- -11.1%
- Equity multiple
- 0.60×
- Total profit
- $-33,798
- Equity at exit
- $44,731
- IRR
- -1.8%
- Equity multiple
- 0.88×
- Total profit
- $-10,150
- Equity at exit
- $25,939
Cash invested: $84,000 (down + closing). Projections, not guarantees.
Landlord ↔ Tenant lean methodology
- Overall (STATE)
- 21 Tenant-Leaning
- State New Jersey
- 21 Tenant-Leaning · D+6
- County
- — inherits STATE
- City
- — inherits STATE
ZIP-level market 08731
- Active inventory
- 190
- Price-to-rent
- 8.4×
Monthly cashflow live
- Estimated rent
- $2,977 medium interval (Pro) →
- Mortgage (P&I)
- −$1,573
- Tax from tax record
- −$352 /mo · $4,223/yr
- Insurance
- −$125
- HOA
- −$70
- Vacancy / Maint / Mgmt
- −$625
- Net cashflow
- $231
Break-even live
UW: 25.0% down · 7.5% · 30yr · 1.5% tax · 5.0% vac · 8.0% maint · 8.0% mgmt
Financing live
Cash to close
- Down payment
- $75,000
- Closing costs
- $9,000
- Reserves months
- —
- Total cash needed
- —
Loan-product check · same deal, 3 products live
Conventional
25% down · 7.5% · 30yr
- Down + closing
- —
- Monthly P&I
- —
- Monthly cashflow
- —
- DSCR
- —
- Eligible?
- —
Personal DTI + credit; lowest rate.
DSCR
20% down · 8.5% · 30yr
- Down + closing
- —
- Monthly P&I
- —
- Monthly cashflow
- —
- DSCR
- —
- Eligible?
- —
No personal income docs; deal must DSCR.
Hard money
10% down · 12.0% · 12mo
- Down + closing
- —
- Monthly P&I
- —
- Monthly cashflow
- —
- DSCR
- —
- Eligible?
- —
Short-term bridge; refi at stabilization.
HOA detail
- Monthly dues
- $70 · $840/yr
- Likely covers
- waterpool
Listing history 14 events
-
2026-05-12status Pending 704-char remark
Show marketing remark (704 chars)
Welcome to this great opportunity in the desirable Pheasant Run adult community! This Cambridge model is ideally situated on a corner lot and offers comfortable, easy living. Enjoy a bright enclosed porch filled with natural light, perfect for relaxing. The home features a spacious living room, formal dining area, and an eat-in kitchen. There are 2 bedrooms, 2 full bathrooms, and a 1-car garage. Additional highlights include a newer hot water heater, pull-down attic access for extra storage, and all appliances included. Residents of Pheasant Run enjoy a beautiful clubhouse with a pool, along with affordable HOA fees. Come see all this home and community have to offer. You'll be glad you did!
-
2026-04-09$300,000 Active 704-char remark
Show marketing remark (704 chars)
Welcome to this great opportunity in the desirable Pheasant Run adult community! This Cambridge model is ideally situated on a corner lot and offers comfortable, easy living. Enjoy a bright enclosed porch filled with natural light, perfect for relaxing. The home features a spacious living room, formal dining area, and an eat-in kitchen. There are 2 bedrooms, 2 full bathrooms, and a 1-car garage. Additional highlights include a newer hot water heater, pull-down attic access for extra storage, and all appliances included. Residents of Pheasant Run enjoy a beautiful clubhouse with a pool, along with affordable HOA fees. Come see all this home and community have to offer. You'll be glad you did!
-
2025-11-21historical
-
2025-05-22$329,000 Active
-
2024-12-21historical
-
2024-08-21price $330,000
-
2024-07-27price $340,000
-
2024-07-14$350,000 Active
-
2012-10-17soldstatus $95,000
-
2012-10-17soldstatus $95,000
-
2012-04-26$95,000
-
2012-04-26$95,000
-
2010-11-03$109,900
-
1985-09-01soldstatus $66,900
ⓘ Source: listings_history table (triggers on properties + properties_extension) + one-shot
backfill from property_details.listing_events for pre-trigger history.
Tax reassessment forecast NJ · Partial reset (capped growth)
- Current annual tax
- $4,223 · $352/mo
- Projected year-2 tax
- $5,846 · $487/mo
- Expected delta
- +$1,624/yr (+$135/mo · 38.4%)
ⓘ Screening estimate from a state-policy table — verify with the county assessor before closing.
Climate risk First Street
- Flood 1/10 Low FEMA zone X (unshaded) · 0% chance over 30 yrs
- Wildfire 3/10 Moderate
- Heat 7/10 Severe 7 d/yr ≥98°F today · 15 d/yr by 30 yrs out
- Wind 7/10 Severe 78% chance of damaging wind over 30 yrs
- Air quality 2/10 Low 1 unhealthy d/yr today · 3 by 30 yrs out
Nearby sold comps map
Loading sold comps map…
Walkable amenities ~0.75 mi
Loading nearby amenities…
Taxation est. · year 1
- Rental income
- $35,720
- − Mortgage interest
- −$16,805
- − Property taxes
- −$4,223
- − Insurance
- −$1,500
- − Repairs & maintenance
- −$2,858
- − Management
- −$2,858
- − HOA
- −$840
- − Depreciation
- −$8,727
- Taxable loss
- −$2,090
- Est. tax savings @ 24.0%
- +$502
- After-tax cash flow
- $3,279/yr
For passive investors: Depreciation is non-cash, so a rental often shows a tax loss while cash-flowing — sheltering income. Rental losses are passive: they offset passive income freely, and up to $25,000/yr can offset ordinary (W-2) income if you actively participate and your MAGI is under $100k (phasing out to $0 by $150k); unused losses carry forward. On sale, claimed depreciation is recaptured at up to 25%, and gains may owe capital-gains tax (a 1031 exchange can defer both). Figures are a year-1 estimate at your 24.0% rate — not tax advice; consult a CPA.
Schools (NCES district)
- District
- Lacey Township School District
- NCES district ID
- 3408100
- Math proficiency
- 22% ▼ -18.00%
- Reading proficiency
- 43% ▼ -11.00%
- Median HH income
- $73,331
- Composite
- 30.42/100
- National rank
- #6242
- State rank
- #299 of 472 in NJ
Livability — Forked River
- Score
- 61/100
- State rank
- #464
- US rank
- #17753
Category grades
Schools grade is shown separately in the Schools card above.
Census & demographics
- Population (ZIP)
- 21,136
Population outlook (Ocean County) Hauer SSP2
- Today (2025)
- 586,991 people
- By 2030
- 581,403 · -1.0%
- By 2040
- 564,913 · -3.8%
- By 2050
- 538,149 · -8.3%
- By 2075
- 468,845 · -20.1%
- By 2100
- 350,297 · -40.3%
Race, ethnicity, and origin ACS 2023
- Neighborhood character
- Predominantly White (82%)
- Race & ethnicity
- White 82% Hispanic / Latino 15% Two or more races 6%
- Hispanic origin (detail)
- Mexican 2% Puerto Rican 8%
- Common ancestry
- Romanian 12% Slovak 2% Scotch-Irish 2%
- Foreign-born
- 6% · Canada
- Languages at home
- 92% English-only · Spanish 4% Other Indo-European 1% Russian/Polish/Slavic 1%
Political lean MEDSL · Ocean
- 2024 margin
- Solid R (+36.0) · D 31.4% · R 67.4% · Other 1.2%
- 2008→2024 swing
- -17.6pp toward R · 2008: -18.4pp · 2024: -36.0pp
- All cycles
- 2024: R+36.0 2020: R+28.7 2016: R+34.0 2012: R+17.7 2008: R+18.4
Not yet ingested
- Civics
- —
Market trends
- HPI YoY
- ▼ -328.91%
- Current HPI
- 352.355
- Rent YoY
- —
- Metro
- —
- State GDP YoY
- ▲ 2.05%
- F500 in state
- 34
Industry mix (Fortune 500 HQ in NJ)
| Industry | F500 HQs | Revenue |
|---|---|---|
| Consumer Goods | 3 | $31B |
|
||
| Pharmaceuticals | 2 | $153B |
|
||
| Technology | 2 | $21B |
|
||
| Insurance | 2 | $20B |
|
||
| Healthcare | 2 | $19B |
|
||
| Financial Services | 1 | $70B |
|
||
Price history
+348.4% since first listed14 events — show timeline
- 2026-05-12 Pending — MOMLS
- 2026-04-09 Listed $300,000 MOMLS
- 2025-11-21 Listing Removed — BRIGHT MLS
- 2025-05-22 Listed $329,000 BRIGHT MLS
- 2024-12-21 Listing Removed — BRIGHT MLS
- 2024-08-21 Price Changed $330,000 BRIGHT MLS
- 2024-07-27 Price Changed $340,000 BRIGHT MLS
- 2024-07-14 Listed $350,000 BRIGHT MLS
- 2012-10-17 Sold (MLS) $95,000 BRIGHT MLS
- 2012-10-17 Sold (MLS) $95,000 MOMLS
- 2012-04-26 Listed $95,000 BRIGHT MLS
- 2012-04-26 Listed $95,000 MOMLS
- 2010-11-03 Listed $109,900 MOMLS
- 1985-09-01 Sold (Public Records) $66,900 Public Records
Property tax history
+3.8%/yrLatest (2025): $4,223 · +7.9% YoY. Source: county tax records.
Cash-flow waterfall
monthlySold comps — $/sqft
last 12 mo · ≤1 miLoading sold comps…