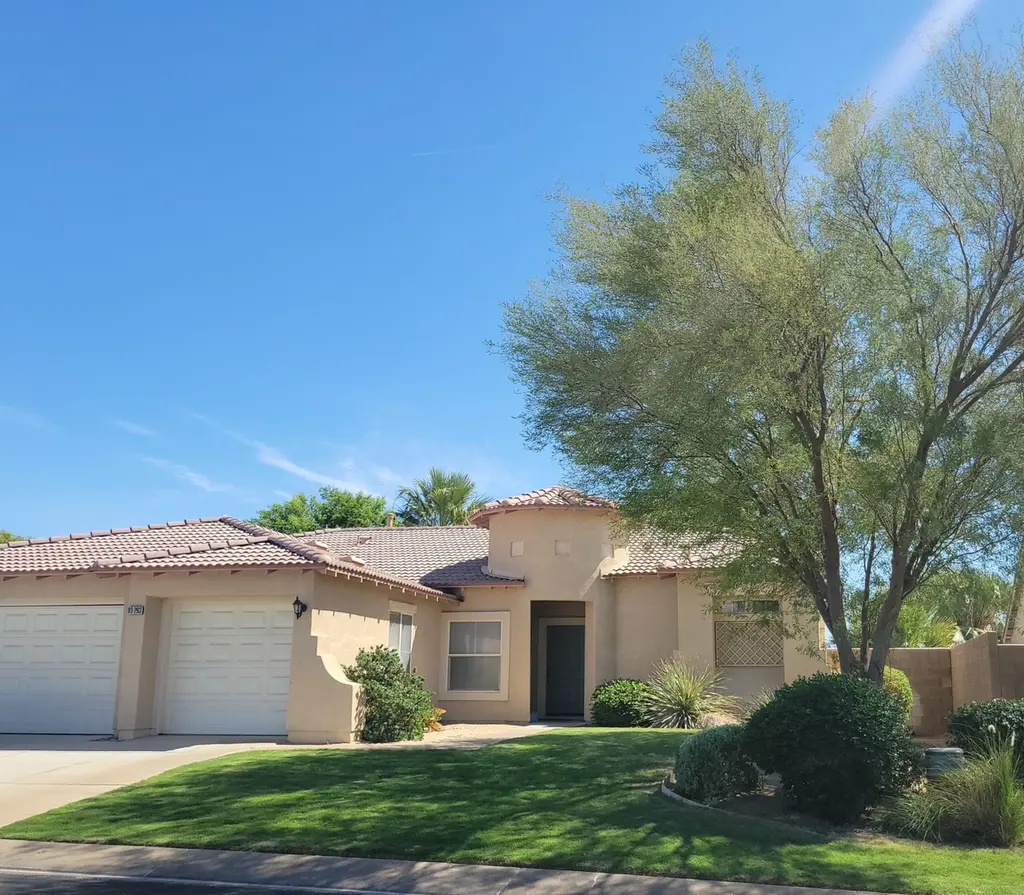
83293 Fairbanks Ave · Indio, CA
Flood risk 1/10 · Minimal
- FEMA flood zone
- X (unshaded)
- Chance of flooding over 30 yrs
- 0.0%
- Est. flood insurance / yr
- $507 – $1,088
Fire risk 6/10 · Moderate
- Est. fire insurance / yr
- $659 – $1,223
Heat risk 10/10 · Severe
- Hot days now (above 114°F)
- 6 days/yr
- Hot days in 30 yrs
- 16 days/yr
Wind risk 1/10 · Minimal
- Chance of severe wind over 30 yrs
- —
Air-quality risk 3/10 · Minor
- Unhealthy air days now
- 3 days/yr
- Unhealthy air days in 30 yrs
- 5 days/yr
Risk factors via First Street. Map © Google.
Why this score? — see what drove the D- grade
The composite is a weighted blend of 9 inputs, each scored 0–100. Each bar is that input's sub-score; the figure is the points it added to the 100-point composite (weight × sub-score).
- ARV discount +11.8/15.0
- Cash flow +8.2/30.0
- Rent growth +5.0/5.0
- Schools +3.8/10.0
- 1% rule +3.0/10.0
- Livability +2.7/5.0
- Condition / age +2.5/5.0
- DSCR +2.2/10.0
- Appreciation +0.0/10.0
$499,000
🖨 Deal sheet (PDF) 📄 Offer letter ✓ Due diligence
Listing remarks MLS
This large open floor plan has 3 Bedrooms & 2 Bathrooms. The backyard opens through French doors, where the home is equipped with a Patio cover the length of the home, and also includes an outdoor ceiling fan. RV, or toy parking area is located on the side yard. There are mini split AC units in two of the bedrooms and the 2 main AC units have been well maintained including regular duct cleaning. Don't miss the chance to see this Beautiful home located in the sought after neighborhood of Shadow Hills, just North of the I10 Fwy, shopping, restaurants, and the Municipal Golf Course, in the City of Festivals. Shadow Hills Community has No age restrictions and low HOA's.
Key facts
- Open floor plan
- Outdoor ceiling fan
- Mini split ac units
Tags
Neighborhood map
What this means for you Summary
Snapshot
- This is a 3-bed/2.0-bath single-family listed at $499k.
Deal economics
- At list price, monthly cash flow is $-463 ($-6k/yr) — negative.
- To cash-flow at today's rent, offer at most $417k (16.4% below list).
- To meet the 1% rule (rent ≥ 1% of price), the offer needs to be $399k (20.0% below list).
- Recommended offer: $399k (20.0% below list) — sets the bar for 1% rule.
- Cap rate 5.2% vs local median 4.3% in Indio — meaningfully above typical; check what's discounted (condition, days-on-market, listing class) to confirm the premium yield is real.
Location & tenants
- Location reads 53/100 on livability (#927 in CA) — a working-class tenant base; expect higher turnover. Strengths: housing B+; Watch: employment D, crime F, amenities F.
- Desert Sands Unified (suburban): math 31% / reading 56% proficiency, ranked #199 of 517 in CA (top 38%) — families likely to look elsewhere, expect single-tenant / working-renter base with shorter leases.
- Zoned schools: Desert Ridge Academy (math 24% / reading 75%, grade C, #98 of 498 statewide, top 21%, 1,030 students, 81% FRL); Shadow Hills High (math 30% / reading 53%, grade F, #498 of 1,170 statewide, top 43%, 1,751 students, 77% FRL) — zoned schools average 79% FRL vs 56% district-wide (23 pts higher); higher-poverty schools than district average — tighter screening recommended.
- Market conditions: Rents rising fast (+11.6%/yr); 447 active listings in the ZIP; 30 comparable units currently listed for rent nearby; rentals lingering (median 46d on market — plan ~5-8 weeks vacancy on turnover, expect pricing pressure); 60% of comp listings sitting > 30 days — soft ceiling on asking rent; solid renter incomes; 9,195 units permitted in Riverside County in 2024 (1,512 in 5+ unit buildings).
- At $3,993/mo this rent would consume 49% of the median local household income ($97k/yr) (locally 565% of renters already pay >50% of income on rent) — very limited rent-growth headroom before tenants either downsize or default.
Forward outlook
- Local home prices are declining (-3.0%/yr); year-one equity from $3k of loan paydown is wiped out by about $15k of value loss. Plan a longer hold.
- Riverside County population projected at +22% by 2050 — long-run rental-demand tailwind backs the buy-and-hold thesis.
Negotiation context
- It's been on market 279 days — a 12% lower offer ($439k) is reasonable based on typical stale-listing flexibility.
- 4 sale attempts since 20y ago; this cycle's ask has dropped $40k (7%) from the opening price — seller is motivated, your offer sets the floor, not the list.
- Current owner paid $360k; 39% above their basis — modest negotiation headroom, anchor on the comps not their cost.
Risks & watch-outs
- Climate carrying-cost: major wildfire risk; extreme-heat days projected 6→16/yr by 2055 (HVAC capex compounding) — expect insurance premiums to compound above CPI over the hold.
Questions for the listing agent
- What do current leases actually rent for vs. the listed asking? Can we see a recent rent roll and the last 12 months of T-12 income?
- It's been on market 279 days. Have you received any prior offers? Is the seller open to a 20% concession, seller financing, or rate buy-down credit?
- What does the HOA fee cover, when was the last increase, and are there any pending special assessments or reserve-fund shortfalls?
- Why hasn't it sold? Are there any deal-killer items the seller is aware of (foundation, flood, title, zoning, code violations)?
- Is there a deadline driving the sale (1031 exchange, divorce, estate, relocation)? That informs how much negotiation room exists.
- Schools are F-rated, which usually means shorter tenancies and higher turnover. Who's the typical renter profile here, and what's been the actual vacancy rate?
- Crime grade is F in this area — have there been break-ins, vandalism, or insurance claims at this property in the last 3 years? What carrier currently insures it and at what premium?
- The area grade is low — what's the realistic commute time and amenity access for the typical tenant pool here? Any planned neighborhood developments (good or bad) we should know about?
- What's the average days-on-market for RENTAL listings here right now (not sales)? A rising rental-DOM trend means longer vacancies and softer asking-rent achievability than the comps imply.
- What's the recent tenant-quality profile in this submarket — average credit score on applications, eviction rate, late-payment / NSF rate, and stable-employment percentage? A property-management company in the area should have these aggregated.
- How much new for-sale + rental construction is in the pipeline within 1–3 miles? Heavy new supply typically softens prices + rents 12–24 months out; constrained supply supports both.
Investment metrics
- 1% rule
- 0.80% ✗
- Cap rate
- 5.18%
- Cash-on-cash
- -3.98%
- DSCR
- 0.82
- GRM
- 10.4
CMA / ARV
- ARV (median comp)
- $551,732
- List price
- $499,000
- Delta
- -9.56%
- Verdict
- FAIR
- Comps
- 20 within 1.0 mi
Show comp detail 12 sales within ~0.75 mi
| Address | Dist | Beds/Ba | Sqft | Sold | Price | $/sf | Match |
|---|---|---|---|---|---|---|---|
| 83094 Prairie Dunes Way | 0.22mi | 3/2.0 | 2,229 (0%) | 8mo | $533,000 | $239 | 83 |
| 82892 Tyler Ct | 0.43mi | 3/2.0 | 2,179 (-2%) | 0mo | $540,000 | $248 | 76 |
| 83051 Carmel Mountain Dr | 0.35mi | 3/3.0 | 2,107 (-6%) | 5mo | $545,000 | $259 | 67 |
| 83287 Long Cove Dr | 0.33mi | 3/2.0 | 2,410 (+8%) | 7mo | $510,000 | $212 | 65 |
| 83065 Carmel Mountain Dr | 0.33mi | 4/3.0 (+1) | 2,107 (-6%) | 6mo | $563,000 | $267 | 61 |
| 82781 Larsen Dr | 0.52mi | 4/2.0 (+1) | 2,091 (-6%) | 4mo | $545,000 | $261 | 57 |
| 42073 Hideaway St | 0.61mi | 3/2.5 | 2,072 (-7%) | 3mo | $540,000 | $261 | 56 |
| 41371 Doyle St | 0.40mi | 4/2.5 (+1) | 2,491 (+12%) | 2mo | $610,000 | $245 | 53 |
| 83631 Himilaya Dr | 0.52mi | 3/2.0 | 1,930 (-13%) | 3mo | $610,000 | $316 | 51 |
| 41371 Edwards Ct | 0.66mi | 3/2.5 | 2,491 (+12%) | 4mo | $520,000 | $209 | 44 |
| 41097 Rawling Ct | 0.62mi | 4/2.5 (+1) | 2,451 (+10%) | 6mo | $535,000 | $218 | 42 |
| 82577 Belfort Ct | 0.74mi | 4/3.0 (+1) | 2,405 (+8%) | 7mo | $595,000 | $247 | 38 |
Match score weights: distance 35% · size 25% · config 20% · recency 20%. Top-matched comps best support the ARV.
Projected returns pro-forma
-3.0% appreciation · 8.0% rent growth · sell at horizon
- IRR
- -17.3%
- Equity multiple
- 0.36×
- Total profit
- $-89,070
- Equity at exit
- $74,403
- IRR
- -1.6%
- Equity multiple
- 0.87×
- Total profit
- $-18,797
- Equity at exit
- $43,144
Cash invested: $139,720 (down + closing). Projections, not guarantees.
Landlord ↔ Tenant lean methodology
- Overall (STATE)
- 18 Strongly Tenant-Friendly
- State California
- 18 Strongly Tenant-Friendly · D+13
- County
- — inherits STATE
- City
- — inherits STATE
ZIP-level market 92203
- Home prices YoY
- -25.0%
- Rents YoY
- 11.6%
- Active inventory
- 447
- Price-to-rent
- 10.4×
Monthly cashflow live
- Estimated rent
- $3,993 high interval (Pro) →
- Mortgage (P&I)
- −$2,617
- Tax from tax record
- −$680 /mo · $8,160/yr
- Insurance
- −$208
- HOA
- −$113
- Vacancy / Maint / Mgmt
- −$839
- Net cashflow
- $-463
Break-even live
Sensitivity live
| Price | -10% $-180 | -5% $-322 | +0% $-463 | +5% $-604 | +10% $-745 |
|---|---|---|---|---|---|
| Rent | -10% $-778 | -5% $-621 | +0% $-463 | +5% $-305 | +10% $-147 |
| Rate | -1.0pp $-212 | -0.5pp $-336 | base $-463 | +0.5pp $-592 | +1.0pp $-724 |
UW: 25.0% down · 7.5% · 30yr · 1.5% tax · 5.0% vac · 8.0% maint · 8.0% mgmt
Financing live
Cash to close
- Down payment
- $124,750
- Closing costs
- $14,970
- Reserves months
- —
- Total cash needed
- —
Loan-product check · same deal, 3 products live
Conventional
25% down · 7.5% · 30yr
- Down + closing
- —
- Monthly P&I
- —
- Monthly cashflow
- —
- DSCR
- —
- Eligible?
- —
Personal DTI + credit; lowest rate.
DSCR
20% down · 8.5% · 30yr
- Down + closing
- —
- Monthly P&I
- —
- Monthly cashflow
- —
- DSCR
- —
- Eligible?
- —
No personal income docs; deal must DSCR.
Hard money
10% down · 12.0% · 12mo
- Down + closing
- —
- Monthly P&I
- —
- Monthly cashflow
- —
- DSCR
- —
- Eligible?
- —
Short-term bridge; refi at stabilization.
Rent comps 30 comps
| Address | Beds | Baths | Sqft | Rent | $/sqft | DOM | Units | Dist |
|---|---|---|---|---|---|---|---|---|
| 83125 Broadmoor Dr Indio, CA | 3.0 | 2.0 | 1630 | $3,150 | $1.93 | 45d | 1 | 0.37mi |
| 82814 Plymouth Dr Indio, CA | 4.0 | 3.0 | 2451 | $3,200 | $1.31 | 13d | 1 | 0.48mi |
| 83631 Himilaya Dr Indio, CA | 3.0 | 2.0 | 1930 | $3,300 | $1.71 | 45d | 1 | 0.53mi |
| 82686 Castleton Dr Indio, CA | 3.0 | 2.0 | 1841 | $2,700 | $1.47 | 3d | 1 | 0.64mi |
| 40632 Pine Grove St Indio, CA | 3.0 | 2.5 | 2955 | $6,500 | $2.20 | 26d | 1 | 0.71mi |
| 42696 Saragoza Ct Indio, CA | 4.0 | 3.0 | 2502 | $3,195 | $1.28 | 4d | 1 | 0.75mi |
| 42217 Whisper Rock St Indio, CA | 3.0 | 3.0 | 2273 | $3,000 | $1.32 | 1d | 1 | 0.78mi |
| 83721 Mirabella Dr Indio, CA | 3.0 | 2.5 | 1995 | $5,000 | $2.51 | 45d | 1 | 0.86mi |
| 40834 Adriatico Ct Indio, CA | 3.0 | 2.5 | 2867 | $9,900 | $3.45 | 45d | 1 | 0.93mi |
| 82442 Sardinia Rd Indio, CA | 4.0 | 2.5 | 2662 | $5,000 | $1.88 | 45d | 1 | 0.94mi |
| 82423 Sardinia Rd Indio, CA | 4.0 | 3.0 | 2500 | $3,300 | $1.32 | 45d | 1 | 0.95mi |
| 42811 Incantata Pl Indio, CA | 3.0 | 2.0 | 1720 | $3,750 | $2.18 | 45d | 1 | 1.06mi |
| 42753 Della Pl Indio, CA | 4.0 | 3.0 | 2338 | $6,000 | $2.57 | 45d | 1 | 1.09mi |
| 42753 Della Pl Indio, CA | 4.0 | 3.0 | 2338 | $6,500 | $2.78 | 7d | 1 | 1.09mi |
| 84136 Olona Ct Indio, CA | 4.0 | 3.0 | 1920 | $5,000 | $2.60 | 45d | 1 | 1.09mi |
| 83907 Avenida Serena Indio, CA | 4.0 | 2.0 | 1765 | $3,200 | $1.81 | 45d | 1 | 1.11mi |
| 41424 Trumble Ct Indio, CA | 3.0 | 2.0 | 1886 | $3,950 | $2.09 | 0d | 1 | 1.11mi |
| 84175 Tramonto Way Indio, CA | 3.0 | 2.0 | 1737 | $3,500 | $2.01 | 16d | 1 | 1.19mi |
| 84330 Tramonto Way Indio, CA | 3.0 | 2.0 | 1637 | $3,645 | $2.23 | 26d | 1 | 1.32mi |
| 40082 Catania Ct Indio, CA | 4.0 | 2.0 | 2099 | $3,600 | $1.72 | 20d | 1 | 1.36mi |
| 81968 Avenida Bienvenida Indio, CA | 2.0 | 2.0 | 1488 | $2,750 | $1.85 | 45d | 1 | 1.36mi |
| 81919 Avenida Bienvenida Indio, CA | 2.0 | 1.5 | 1488 | $2,500 | $1.68 | 45d | 1 | 1.40mi |
| 40759 Calle Guapo Indio, CA | 2.0 | 2.0 | 1488 | $4,500 | $3.02 | 45d | 1 | 1.40mi |
| 43151 Passagio Lago Way Indio, CA | 4.0 | 4.0 | 2653 | $3,195 | $1.20 | 1d | 1 | 1.42mi |
| 81876 Camino Los Milagros Indio, CA | 3.0 | 3.0 | 2014 | $7,500 | $3.72 | 45d | 1 | 1.45mi |
| 82193 Lemon Grove Ave Indio, CA | 3.0 | 2.0 | 1600 | $3,100 | $1.94 | 45d | 1 | 1.45mi |
| 42816 Dell Lago Ct Indio, CA | 3.0 | 2.0 | 2012 | $25,000 | $12.43 | 45d | 1 | 1.45mi |
| 43275 Passagio Lago Way Indio, CA | 4.0 | 4.0 | 2697 | $4,000 | $1.48 | 45d | 1 | 1.45mi |
| 42942 Dell Lago Ct Indio, CA | 4.0 | 3.0 | 2234 | $10,500 | $4.70 | 45d | 1 | 1.48mi |
| 43329 Passagio Lago Way Indio, CA | 4.0 | 4.0 | 2697 | $4,200 | $1.56 | 12d | 1 | 1.48mi |
HOA detail
- Monthly dues
- $113 · $1,356/yr
Listing history 13 events
-
2026-05-19price $499,000 680-char remark
Show marketing remark (680 chars)
This large open floor plan has 3 Bedrooms & 2 Bathrooms. The backyard opens through French doors, where the home is equipped with a Patio cover the length of the home, and also includes an outdoor ceiling fan. RV, or toy parking area is located on the side yard. There are mini split AC units in two of the bedrooms and the 2 main AC units have been well maintained including regular duct cleaning. Don't miss the chance to see this Beautiful home located in the sought after neighborhood of Shadow Hills, just North of the I10 Fwy, shopping, restaurants, and the Municipal Golf Course, in the City of Festivals. Shadow Hills Community has No age restrictions and low HOA's.
-
2026-05-14price $529,000 680-char remark
Show marketing remark (680 chars)
This large open floor plan has 3 Bedrooms & 2 Bathrooms. The backyard opens through French doors, where the home is equipped with a Patio cover the length of the home, and also includes an outdoor ceiling fan. RV, or toy parking area is located on the side yard. There are mini split AC units in two of the bedrooms and the 2 main AC units have been well maintained including regular duct cleaning. Don't miss the chance to see this Beautiful home located in the sought after neighborhood of Shadow Hills, just North of the I10 Fwy, shopping, restaurants, and the Municipal Golf Course, in the City of Festivals. Shadow Hills Community has No age restrictions and low HOA's.
-
2025-08-20$539,000 Active 680-char remark
Show marketing remark (680 chars)
This large open floor plan has 3 Bedrooms & 2 Bathrooms. The backyard opens through French doors, where the home is equipped with a Patio cover the length of the home, and also includes an outdoor ceiling fan. RV, or toy parking area is located on the side yard. There are mini split AC units in two of the bedrooms and the 2 main AC units have been well maintained including regular duct cleaning. Don't miss the chance to see this Beautiful home located in the sought after neighborhood of Shadow Hills, just North of the I10 Fwy, shopping, restaurants, and the Municipal Golf Course, in the City of Festivals. Shadow Hills Community has No age restrictions and low HOA's.
-
2007-05-18soldstatus $360,000
-
2007-04-25historical
-
2007-04-11$368,000
-
2007-03-31historical
-
2007-03-16price $369,000
-
2007-03-06price $389,900
-
2007-01-29price $399,900
-
2006-11-18$409,000
-
2006-11-07historical
-
2006-08-01$418,000
ⓘ Source: listings_history table (triggers on properties + properties_extension) + one-shot
backfill from property_details.listing_events for pre-trigger history.
Tax reassessment forecast CA · Resets to sale price
- Current annual tax
- $8,160 · $680/mo
- Projected year-2 tax
- $8,160 · $680/mo
- Expected delta
- $0/yr ($0/mo · -0.0%)
ⓘ Screening estimate from a state-policy table — verify with the county assessor before closing.
Climate risk First Street
- Flood 1/10 Low FEMA zone X (unshaded) · 0% chance over 30 yrs
- Wildfire 6/10 Major
- Heat 10/10 Extreme 6 d/yr ≥114°F today · 16 d/yr by 30 yrs out
- Wind 1/10 Low
- Air quality 3/10 Moderate 3 unhealthy d/yr today · 5 by 30 yrs out
Nearby sold comps map
Loading sold comps map…
Walkable amenities ~0.75 mi
Loading nearby amenities…
Taxation est. · year 1
- Rental income
- $47,922
- − Mortgage interest
- −$27,952
- − Property taxes
- −$8,160
- − Insurance
- −$2,495
- − Repairs & maintenance
- −$3,834
- − Management
- −$3,834
- − HOA
- −$1,356
- − Depreciation
- −$14,516
- Taxable loss
- −$14,225
- Est. tax savings @ 24.0%
- +$3,414
- After-tax cash flow
- $-2,140/yr
For passive investors: Depreciation is non-cash, so a rental often shows a tax loss while cash-flowing — sheltering income. Rental losses are passive: they offset passive income freely, and up to $25,000/yr can offset ordinary (W-2) income if you actively participate and your MAGI is under $100k (phasing out to $0 by $150k); unused losses carry forward. On sale, claimed depreciation is recaptured at up to 25%, and gains may owe capital-gains tax (a 1031 exchange can defer both). Figures are a year-1 estimate at your 24.0% rate — not tax advice; consult a CPA.
Schools (NCES district)
- District
- Desert Sands Unified
- NCES district ID
- 0611110
- Math proficiency
- 31% ▼ -4.00%
- Reading proficiency
- 56% ▲ 7.00%
- Median HH income
- $54,957
- Composite
- 37.77/100
- National rank
- #4346
- State rank
- #199 of 517 in CA
Livability — Indio
- Score
- 53/100
- State rank
- #927
- US rank
- #24244
Category grades
Schools grade is shown separately in the Schools card above.
Census & demographics
- Census place
- Indio, CA
- County
- Riverside County · 2,287,001 people
- City population
- 100,560
- Metro
- Riverside-San Bernardino-Ontario, CA
- Population (ZIP)
- 34,735
- Household income
- $97,311
- Rent vs Own
- Severe rent burden
- 565.0
Population outlook (Riverside County) Hauer SSP2
- Today (2025)
- 2,664,475 people
- By 2030
- 2,802,692 · +5.2%
- By 2040
- 3,050,904 · +14.5%
- By 2050
- 3,256,783 · +22.2%
- By 2075
- 3,655,058 · +37.2%
- By 2100
- 3,766,594 · +41.4%
Race, ethnicity, and origin ACS 2023
- Neighborhood character
- Diverse neighborhood (Simpson 0.57)
- Race & ethnicity
- Hispanic / Latino 51% White 41% Two or more races 29% Asian 3% Black 2%
- Hispanic origin (detail)
- Mexican 48%
- Common ancestry
- Italian 3% Lithuanian 2% Romanian 2%
- Foreign-born
- 14% · Canada
- Languages at home
- 64% English-only · Spanish 33% Tagalog/Filipino 1% Other Indo-European 1%
Political lean MEDSL · Riverside
- 2024 margin
- Toss-up / Even · D 48.0% · R 49.3% · Other 2.6%
- 2008→2024 swing
- -3.6pp toward R · 2008: 2.3pp · 2024: -1.3pp
- All cycles
- 2024: R+1.3 2020: D+8.0 2016: D+4.3 2012: R+0.4 2008: D+2.3
Not yet ingested
- Civics
- —
Market trends
- HPI YoY
- ▼ -98.51%
- Current HPI
- 295.6456
- Rent YoY
- ▲ 11.64%
- Metro
- Riverside-San Bernardino-Ontario, CA
- State GDP YoY
- ▲ 3.21%
- F500 in state
- 116
Industry mix (Fortune 500 HQ in CA)
| Industry | F500 HQs | Revenue |
|---|---|---|
| Technology | 27 | $1,492B |
|
||
| Financial Services | 3 | $174B |
|
||
| Retail | 3 | $44B |
|
||
| Insurance | 3 | $26B |
|
||
| Media / Entertainment | 2 | $115B |
|
||
| Pharmaceuticals / Biotech | 2 | $62B |
|
||
Price history
+19.4% since first listed13 events — show timeline
- 2026-05-19 Price Changed $499,000 GPSMLS
- 2026-05-14 Price Changed $529,000 GPSMLS
- 2025-08-20 Listed $539,000 GPSMLS
- 2007-05-18 Sold (Public Records) $360,000 Public Records
- 2007-04-25 Listing Removed — GPSMLS
- 2007-04-11 Listed $368,000 GPSMLS
- 2007-03-31 Listing Removed — GPSMLS
- 2007-03-16 Price Changed $369,000 GPSMLS
- 2007-03-06 Price Changed $389,900 GPSMLS
- 2007-01-29 Price Changed $399,900 GPSMLS
- 2006-11-18 Listed $409,000 GPSMLS
- 2006-11-07 Listing Removed — GPSMLS
- 2006-08-01 Listed $418,000 GPSMLS
Property tax history
+2.4%/yrLatest (2025): $8,160 · +2.9% YoY. Source: county tax records.
Cash-flow waterfall
monthlySold comps — $/sqft
last 12 mo · ≤1 miLoading sold comps…