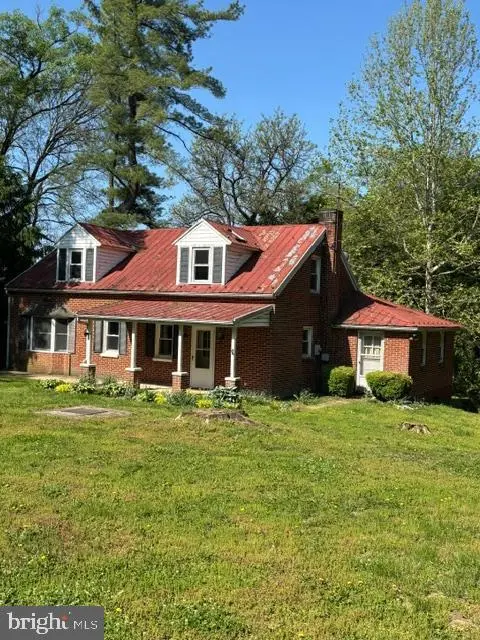
1610 Holly Pike · Mount Holly Springs, PA
Flood risk 1/10 · Minimal
- FEMA flood zone
- X (unshaded)
- Chance of flooding over 30 yrs
- 0.0%
- Est. flood insurance / yr
- $507 – $1,088
Fire risk 1/10 · Minimal
- Est. fire insurance / yr
- $511 – $949
Heat risk 4/10 · Minor
- Hot days now (above 101°F)
- 7 days/yr
- Hot days in 30 yrs
- 15 days/yr
Wind risk 3/10 · Minor
- Chance of severe wind over 30 yrs
- 5.0%
Air-quality risk 2/10 · Minimal
- Unhealthy air days now
- 1 days/yr
- Unhealthy air days in 30 yrs
- 3 days/yr
Risk factors via First Street. Map © Google.
Why this score? — see what drove the C+ grade
The composite is a weighted blend of 9 inputs, each scored 0–100. Each bar is that input's sub-score; the figure is the points it added to the 100-point composite (weight × sub-score).
- Cash flow +20.7/30.0
- ARV discount +15.0/15.0
- DSCR +6.6/10.0
- 1% rule +6.2/10.0
- Schools +4.8/10.0
- Livability +3.2/5.0
- Rent growth +2.5/5.0
- Condition / age +2.5/5.0
- Appreciation +0.0/10.0
$169,700
🖨 Deal sheet 📄 Offer letter ✓ Due diligence
Listing remarks
This Cape Cod home is tucked away off of the Holly Pike and provides privacy but easy access to Route 81, Mount Holly Springs and Boiling Springs. With some sweat equity this home can shine and be a great private retreat. It features 3 bedrooms and 1 full bath. There are two (2) kitchens and plenty of room inside and outside with . 80 acres of land - wooded lots are to the rear and to the right of this home and provide the privacy you might be seeking.
Key facts
- 0.8 acre lot
- Built 1900
- Listed 6 days
Property features AI
Finance
- Other: Ownership is fee simple; Assessed values reported by assessor
Exterior
- Parking: Off-street parking
- Utilities: Well water; Private septic system (septic exists); Electric hot water
- Home design: Detached single-family property; Above-grade finished living area of 1,751 (assessor)
- Construction: Brick construction; Permanent foundation; Building not winterized
- Exterior features: Not in a federal flood zone; No tidal water on property
Interior
- Bedrooms: Three bedrooms on the upper level
- Bathrooms: One full bathroom on the main level; One full bathroom total
- Heating & cooling: 90% forced air heating; Oil fired heat; Electric hot water
- Interior features: Level entry to main level; Unfinished basement
Neighborhood map
What this means for you Summary
Snapshot
- This is a 2-bed/1.0-bath single-family listed at $170k.
Deal economics
- At list price, monthly cash flow is $229 ($3k/yr) — positive.
- The deal already cash-flows at list — no discount required.
- Meets the 1% rule at list price ($2k rent vs $170k).
Location & tenants
- Location reads 65/100 on livability (#1,143 in PA) — a middle-class / working-renter tenant base. Strengths: crime A+, cost of living A+, housing B; Watch: employment C-, amenities F, commute F.
- South Middleton SD (town): math 45% / reading 63% proficiency, ranked #106 of 539 in PA (top 20%) — acceptable for families but not a draw, mixed tenant base, ~2y average lease; only 16% free/reduced lunch — higher-income household profile.
- Zoned schools: Boiling Springs Hs (math 72% / reading 72%, grade B+, #39 of 437 statewide, top 9%, 777 students, 22% FRL).
- Zoned-school proficiency averages 72% at this address vs 54% district-wide (+18 pts) — the actual schools serving this property are materially stronger than the South Middleton SD average implies; a family-tenant draw the district grade alone would hide.
- Market conditions: 188 active listings in the ZIP; solid renter incomes; 1,052 units permitted in Cumberland County in 2024 (310 in 5+ unit buildings).
Forward outlook
- Local home prices are declining (-3.0%/yr); year-one equity from $1k of loan paydown is wiped out by about $5k of value loss. Plan a longer hold.
- Cumberland County population projected at +17% by 2050 — long-run rental-demand tailwind backs the buy-and-hold thesis.
Negotiation context
- Only 6 days on market — expect competitive offers; lowballing is unlikely to land.
- Current owner paid $87k; list at $170k implies a 95% gain — meaningful room to come down on a strong offer.
Risks & watch-outs
- Watch-outs: built in 1900 — expect roof / HVAC / electrical / plumbing capex.
Questions for the listing agent
- Built in 1900 — when were the roof, HVAC, electrical panel, plumbing, and water heater last replaced?
- Is there a deadline driving the sale (1031 exchange, divorce, estate, relocation)? That informs how much negotiation room exists.
- Schools are D-rated, which usually means shorter tenancies and higher turnover. Who's the typical renter profile here, and what's been the actual vacancy rate?
- What's the average days-on-market for RENTAL listings here right now (not sales)? A rising rental-DOM trend means longer vacancies and softer asking-rent achievability than the comps imply.
- What's the recent tenant-quality profile in this submarket — average credit score on applications, eviction rate, late-payment / NSF rate, and stable-employment percentage? A property-management company in the area should have these aggregated.
- How much new for-sale + rental construction is in the pipeline within 1–3 miles? Heavy new supply typically softens prices + rents 12–24 months out; constrained supply supports both.
Investment metrics
- 1% rule
- 1.12% ✓
- Cap rate
- 7.91%
- Cash-on-cash
- 5.79%
- DSCR
- 1.26
- GRM
- 7.5
CMA / ARV
- ARV (on-the-fly)
- $315,180
- Comps found
- 1
Show comp detail 1 sale within ~0.75 mi
| Address | Dist | Beds/Ba | Sqft | Sold | Price | $/sf | Match |
|---|---|---|---|---|---|---|---|
| 142 E Old York Rd | 0.72mi | 3/2.5 (+1) | 1,638 (-6%) | 20mo | $295,000 | $180 | 28 |
Match score weights: distance 35% · size 25% · config 20% · recency 20%. Top-matched comps best support the ARV.
Projected returns pro-forma
-3.0% appreciation · 3.0% rent growth · sell at horizon
- IRR
- -7.3%
- Equity multiple
- 0.73×
- Total profit
- $-12,822
- Equity at exit
- $25,303
- IRR
- 2.3%
- Equity multiple
- 1.17×
- Total profit
- $7,976
- Equity at exit
- $14,673
Cash invested: $47,516 (down + closing). Projections, not guarantees.
Landlord ↔ Tenant lean methodology
- Overall (STATE)
- 62 Landlord-Friendly
- State Pennsylvania
- 62 Landlord-Friendly · EVEN
- County
- — inherits STATE
- City
- — inherits STATE
ZIP-level market 17015
- Home prices YoY
- -25.2%
- Active inventory
- 188
- Price-to-rent
- 7.5×
Monthly cashflow live
- Estimated rent
- $1,895 medium interval (Pro) →
- Mortgage (P&I)
- −$890
- Tax from tax record
- −$307 /mo · $3,689/yr
- Insurance
- −$71
- HOA
- −$0
- Vacancy / Maint / Mgmt
- −$398
- Net cashflow
- $229
Break-even live
UW: 25.0% down · 7.5% · 30yr · 1.5% tax · 5.0% vac · 8.0% maint · 8.0% mgmt
Financing live
Cash to close
- Down payment
- $42,425
- Closing costs
- $5,091
- Reserves months
- —
- Total cash needed
- —
Loan-product check · same deal, 3 products live
Conventional
25% down · 7.5% · 30yr
- Down + closing
- —
- Monthly P&I
- —
- Monthly cashflow
- —
- DSCR
- —
- Eligible?
- —
Personal DTI + credit; lowest rate.
DSCR
20% down · 8.5% · 30yr
- Down + closing
- —
- Monthly P&I
- —
- Monthly cashflow
- —
- DSCR
- —
- Eligible?
- —
No personal income docs; deal must DSCR.
Hard money
10% down · 12.0% · 12mo
- Down + closing
- —
- Monthly P&I
- —
- Monthly cashflow
- —
- DSCR
- —
- Eligible?
- —
Short-term bridge; refi at stabilization.
Listing history 9 events
-
2026-06-05status $169,700 Pending 6 DOM
-
2026-06-03days on market $169,700 Active 6 DOM
-
2026-06-02days on market $169,700 Active 5 DOM
-
2026-06-01days on market $169,700 Active 4 DOM
-
2026-05-31days on market $169,700 Active 3 DOM
-
2026-05-31days on market $169,700 Active 2 DOM
-
2026-05-21historical $169,700
-
1990-07-23soldstatus $87,000
-
1986-10-24soldstatus $63,500
ⓘ Source: listings_history table (triggers on properties + properties_extension) + one-shot
backfill from property_details.listing_events for pre-trigger history.
Tax reassessment forecast PA · Partial reset (capped growth)
- Current annual tax
- $3,689 · $307/mo
- Projected year-2 tax
- $3,689 · $307/mo
- Expected delta
- $0/yr ($0/mo · 0.0%)
ⓘ Screening estimate from a state-policy table — verify with the county assessor before closing.
Climate risk First Street
- Flood 1/10 Low FEMA zone X (unshaded) · 0% chance over 30 yrs
- Wildfire 1/10 Low
- Heat 4/10 Moderate 7 d/yr ≥101°F today · 15 d/yr by 30 yrs out
- Wind 3/10 Moderate 5% chance of damaging wind over 30 yrs
- Air quality 2/10 Low 1 unhealthy d/yr today · 3 by 30 yrs out
Nearby sold comps map
Loading sold comps map…
Walkable amenities ~0.75 mi
Loading nearby amenities…
Taxation est. · year 1
- Rental income
- $22,741
- − Mortgage interest
- −$9,506
- − Property taxes
- −$3,689
- − Insurance
- −$848
- − Repairs & maintenance
- −$1,819
- − Management
- −$1,819
- − Depreciation
- −$4,937
- Taxable income
- $123
- Est. tax owed @ 24.0%
- −$29
- After-tax cash flow
- $2,719/yr
For passive investors: Depreciation is non-cash, so a rental often shows a tax loss while cash-flowing — sheltering income. Rental losses are passive: they offset passive income freely, and up to $25,000/yr can offset ordinary (W-2) income if you actively participate and your MAGI is under $100k (phasing out to $0 by $150k); unused losses carry forward. On sale, claimed depreciation is recaptured at up to 25%, and gains may owe capital-gains tax (a 1031 exchange can defer both). Figures are a year-1 estimate at your 24.0% rate — not tax advice; consult a CPA.
Schools (NCES district)
- District
- South Middleton SD
- NCES district ID
- 4222050
- Math proficiency
- 45% ▼ -8.00%
- Reading proficiency
- 63% ▼ -7.00%
- Median HH income
- $67,822
- Composite
- 47.74/100
- National rank
- #2236
- State rank
- #106 of 539 in PA
Livability — Mount Holly Springs
- Score
- 65/100
- State rank
- #1143
- US rank
- #13131
Category grades
Schools grade is shown separately in the Schools card above.
Census & demographics
- County
- Cumberland County · 257,673 people
- Metro
- Harrisburg-Carlisle, PA
- Population (ZIP)
- 24,385
- Household income
- $86,981
- Rent vs Own
- Severe rent burden
- 172.0
Population outlook (Cumberland County) Hauer SSP2
- Today (2025)
- 267,950 people
- By 2030
- 278,105 · +3.8%
- By 2040
- 296,552 · +10.7%
- By 2050
- 312,937 · +16.8%
- By 2075
- 349,233 · +30.3%
- By 2100
- 361,875 · +35.1%
Race, ethnicity, and origin ACS 2023
- Neighborhood character
- Predominantly White (94%)
- Race & ethnicity
- White 94% Two or more races 2% Hispanic / Latino 2%
- Common ancestry
- Romanian 3% Lithuanian 2% Slovak 2%
- Foreign-born
- 2% · Canada
- Languages at home
- 97% English-only · German/W. Germanic 1% Spanish 1% Other Indo-European 1%
Political lean MEDSL · Cumberland
- 2024 margin
- Lean R (+9.4) · D 44.6% · R 54.1% · Other 1.3%
- 2008→2024 swing
- +4.2pp toward D · 2008: -13.6pp · 2024: -9.4pp
- All cycles
- 2024: R+9.4 2020: R+10.6 2016: R+18.6 2012: R+18.5 2008: R+13.6
Not yet ingested
- Civics
- —
Market trends
- HPI YoY
- ▼ -89.66%
- Current HPI
- 265.9175
- Rent YoY
- —
- Metro
- Harrisburg-Carlisle, PA
- State GDP YoY
- ▲ 1.68%
- F500 in state
- 34
Industry mix (Fortune 500 HQ in PA)
| Industry | F500 HQs | Revenue |
|---|---|---|
| Healthcare | 2 | $309B |
|
||
| Insurance | 2 | $27B |
|
||
| Telecommunications / Media | 1 | $124B |
|
||
| Industrial Distribution | 1 | $22B |
|
||
| Financial Services | 1 | $20B |
|
||
| Chemicals / Materials | 1 | $18B |
|
||
Price history
+167.2% since first listed3 events — show timeline
- 2026-05-21 Coming Soon $169,700 BRIGHT MLS
- 1990-07-23 Sold (Public Records) $87,000 Public Records
- 1986-10-24 Sold (Public Records) $63,500 Public Records
Property tax history
+3.8%/yrLatest (2026): $3,689 · +4.5% YoY. Source: county tax records.
Cash-flow waterfall
monthlySold comps — $/sqft
last 12 mo · ≤1 miLoading sold comps…