448 Wolf Crest Blvd · Seguin, TX
Flood risk No data
- FEMA flood zone
- —
- Chance of flooding over 30 yrs
- —
- Est. flood insurance / yr
- —
Fire risk No data
- Est. fire insurance / yr
- —
Heat risk No data
- Hot days now (above threshold)
- —
- Hot days in 30 yrs
- —
Wind risk No data
- Chance of severe wind over 30 yrs
- —
Air-quality risk No data
- Unhealthy air days now
- —
- Unhealthy air days in 30 yrs
- —
Risk factors via First Street. Map © Google.
Why this score? — see what drove the C- grade
The composite is a weighted blend of 9 inputs, each scored 0–100. Each bar is that input's sub-score; the figure is the points it added to the 100-point composite (weight × sub-score).
- Cash flow +19.0/30.0
- ARV discount +10.8/15.0
- DSCR +6.0/10.0
- 1% rule +5.1/10.0
- Livability +3.3/5.0
- Rent growth +3.0/5.0
- Schools +2.4/10.0
- Condition / age +1.0/5.0
- Appreciation +0.0/10.0
$178,499
🖨 Deal sheet 📄 Offer letter ✓ Due diligence
Listing remarks
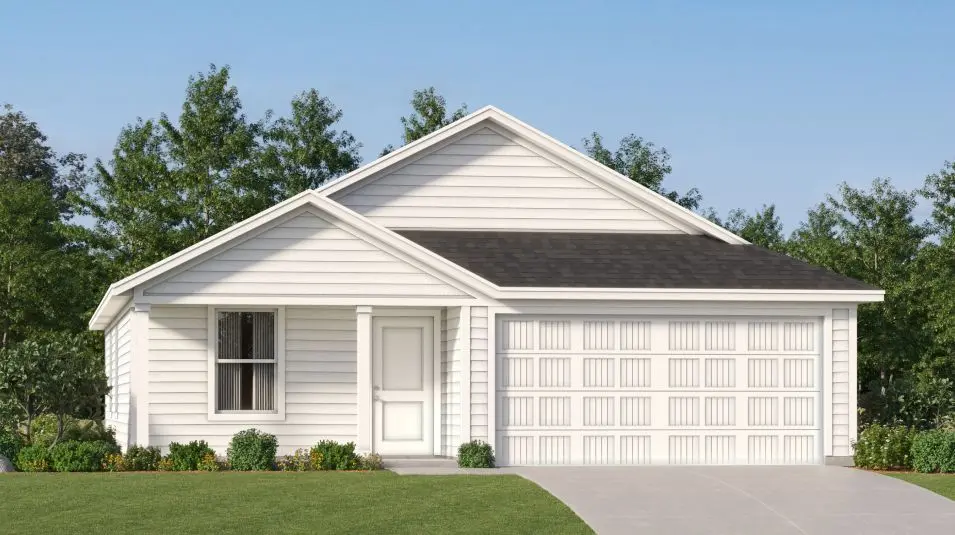
This new home is conveniently laid out on a single floor for maximum comfort and convenience. At its heart stands an open-concept layout connecting a spacious family room, a multi-functional kitchen and lovely dining area. The owner's suite is situated in a private corner and comes complete with an adjoining bathroom, while the two secondary bedrooms are located near the foyer.
Key facts
- Adjoining bathroom
- Owner's suite
- Open-concept layout
Tags
Property features AI
Finance
- Other: Virtual tour available
- Financial info: List price $187,999
Exterior
- Parking: 2 parking spaces; 2-car garage
- Home design: Beckman plan; New construction (spec)
- Construction: Living area approximately 1,260; Built 2026 (new construction)
- Exterior features: Located at 448 Wolf Crest Blvd, Seguin, TX 78155; Spec new construction (Beckman plan)
Interior
- Kitchen: Standard kitchen (appliances not specified)
- Bedrooms: 3 bedrooms
- Bathrooms: 2 full bathrooms
- Interior features: Open living area
Neighborhood map
What this means for you Summary
Snapshot
- This is a 3-bed/2.0-bath single-family listed at $178k. Condition is rated poor.
Deal economics
- At list price, monthly cash flow is $188 ($2k/yr) — positive.
- The deal already cash-flows at list — no discount required.
- Meets the 1% rule at list price ($2k rent vs $178k).
- Recommended offer: $176k (1.5% below list) — sets the bar for market timing.
- Cap rate 7.6% vs local median 3.7% in Seguin — top-decile yield for the area; either an underpriced asset or a hidden risk that comps aren't pricing in. Stress-test before assuming the spread holds.
Location & tenants
- Location reads 66/100 on livability (#592 in TX) — a middle-class / working-renter tenant base. Strengths: cost of living A+, housing A+; Watch: employment D, schools F, amenities F.
- Seguin ISD (town): math 26% / reading 30% proficiency, ranked #663 of 826 in TX (top 80%) — low school quality limits family demand, transient renter base, plan for 1-2y turnover; 63% free/reduced lunch — lower-income household profile, screen leases tightly.
- Market conditions: Rents rising (+2.0%/yr); 1342 active listings in the ZIP; 17 comparable units currently listed for rent nearby; rentals at typical pace (median 17d on market — plan ~3-4 weeks tenant-placement turnaround); 2,064 units permitted in Guadalupe County in 2024 (133 in 5+ unit buildings).
- This rent runs 30% of the median local income ($71k/yr) — at the standard rent-burdened threshold; future hikes will face affordability resistance.
Forward outlook
- Local home prices are declining (-3.0%/yr); year-one equity from $1k of loan paydown is wiped out by about $5k of value loss. Plan a longer hold.
- Guadalupe County population projected at +61% by 2050 — long-run rental-demand tailwind backs the buy-and-hold thesis.
Negotiation context
- It's been on market 18 days — a 2% lower offer ($176k) is reasonable based on typical stale-listing flexibility.
Questions for the listing agent
- Have any recent inspections been done? Can we get a copy of the seller's disclosures and any deferred-maintenance estimates?
- Is there a deadline driving the sale (1031 exchange, divorce, estate, relocation)? That informs how much negotiation room exists.
- Schools are F-rated, which usually means shorter tenancies and higher turnover. Who's the typical renter profile here, and what's been the actual vacancy rate?
- What's the average days-on-market for RENTAL listings here right now (not sales)? A rising rental-DOM trend means longer vacancies and softer asking-rent achievability than the comps imply.
- What's the recent tenant-quality profile in this submarket — average credit score on applications, eviction rate, late-payment / NSF rate, and stable-employment percentage? A property-management company in the area should have these aggregated.
- How much new for-sale + rental construction is in the pipeline within 1–3 miles? Heavy new supply typically softens prices + rents 12–24 months out; constrained supply supports both.
Investment metrics
- 1% rule
- 1.01% ✓
- Cap rate
- 7.55%
- Cash-on-cash
- 4.51%
- DSCR
- 1.20
- GRM
- 8.3
CMA / ARV
- ARV (on-the-fly)
- $192,780
- Comps found
- 12
Show comp detail 12 sales within ~0.75 mi
| Address | Dist | Beds/Ba | Sqft | Sold | Price | $/sf | Match |
|---|---|---|---|---|---|---|---|
| 516 Wolf Crest Blvd | 0.11mi | 3/2.0 | 1,260 (0%) | 1mo | $192,999 | $153 | 94 |
| 507 Wolf Crest Blvd | 0.10mi | 3/2.0 | 1,260 (0%) | 3mo | $194,999 | $155 | 93 |
| 732 Summit Ter | 0.07mi | 3/2.0 | 1,260 (0%) | 8mo | $184,999 | $147 | 90 |
| 540 Wolf Crest Blvd | 0.18mi | 3/2.0 | 1,260 (0%) | 2mo | $189,999 | $151 | 90 |
| 727 Summit Ter | 0.09mi | 3/2.0 | 1,260 (0%) | 9mo | $192,999 | $153 | 89 |
| 706 Wolf Crest Blvd | 0.20mi | 3/2.0 | 1,260 (0%) | 5mo | $182,999 | $145 | 86 |
| 811 Summit Terraces | 0.13mi | 3/2.0 | 1,260 (0%) | 11mo | $186,999 | $148 | 85 |
| 830 Summit Terraces | 0.15mi | 3/2.0 | 1,260 (0%) | 10mo | $182,099 | $145 | 85 |
| 763 Armadillo | 0.58mi | 3/2.0 | 1,262 (+0%) | 1mo | $229,900 | $182 | 72 |
| 816 El Camino Ct | 0.12mi | 3/2.0 | 1,413 (+12%) | 12mo | $195,999 | $139 | 64 |
| 712 Monarch | 0.72mi | 3/2.0 | 1,262 (+0%) | 8mo | $235,000 | $186 | 59 |
| 813 Wild Olive Way | 0.75mi | 3/2.0 | 1,409 (+12%) | 11mo | $284,950 | $202 | 36 |
Match score weights: distance 35% · size 25% · config 20% · recency 20%. Top-matched comps best support the ARV.
Projected returns pro-forma
-3.0% appreciation · 2.04% rent growth · sell at horizon
- IRR
- -10.3%
- Equity multiple
- 0.63×
- Total profit
- $-18,666
- Equity at exit
- $26,615
- IRR
- -2.4%
- Equity multiple
- 0.85×
- Total profit
- $-7,680
- Equity at exit
- $15,433
Cash invested: $49,980 (down + closing). Projections, not guarantees.
Landlord ↔ Tenant lean methodology
- Overall (STATE)
- 87 Strongly Landlord-Friendly
- State Texas
- 87 Strongly Landlord-Friendly · R+5
- County
- — inherits STATE
- City
- — inherits STATE
ZIP-level market 78155
- Rents YoY
- 2.0%
- Active inventory
- 1342
- Price-to-rent
- 8.3×
Monthly cashflow live
- Estimated rent
- $1,799 high interval (Pro) →
- Mortgage (P&I)
- −$936
- Tax est. 1.5%
- −$223 /mo · $2,677/yr
- Insurance
- −$74
- HOA
- −$0
- Vacancy / Maint / Mgmt
- −$378
- Net cashflow
- $188
Break-even live
UW: 25.0% down · 7.5% · 30yr · 1.5% tax · 5.0% vac · 8.0% maint · 8.0% mgmt
Financing live
Cash to close
- Down payment
- $44,625
- Closing costs
- $5,355
- Reserves months
- —
- Total cash needed
- —
Loan-product check · same deal, 3 products live
Conventional
25% down · 7.5% · 30yr
- Down + closing
- —
- Monthly P&I
- —
- Monthly cashflow
- —
- DSCR
- —
- Eligible?
- —
Personal DTI + credit; lowest rate.
DSCR
20% down · 8.5% · 30yr
- Down + closing
- —
- Monthly P&I
- —
- Monthly cashflow
- —
- DSCR
- —
- Eligible?
- —
No personal income docs; deal must DSCR.
Hard money
10% down · 12.0% · 12mo
- Down + closing
- —
- Monthly P&I
- —
- Monthly cashflow
- —
- DSCR
- —
- Eligible?
- —
Short-term bridge; refi at stabilization.
Rent comps 17 comps
| Address | Beds | Baths | Sqft | Rent | $/sqft | DOM | Units | Dist |
|---|---|---|---|---|---|---|---|---|
| 805 Riviera Ct Seguin, TX | 4.0 | 2.5 | 1874 | $1,795 | $0.96 | 24d | 1 | 0.22mi |
| 805 Riviera Ct Seguin, TX | 4.0 | 2.5 | 1874 | $1,795 | $0.96 | 11d | 1 | 0.22mi |
| 401 Alta Vista Ter Seguin, TX | 4.0 | 2.0 | 1667 | $1,995 | $1.20 | 24d | 1 | 0.24mi |
| 829 Margay Loop Seguin, TX | 3.0 | 2.0 | 1575 | $1,775 | $1.13 | 43d | 1 | 0.48mi |
| 829 Margay Loop Seguin, TX | 3.0 | 2.0 | 1575 | $1,775 | $1.13 | 17d | 1 | 0.48mi |
| 1060 Pronghorn Trl Seguin, TX | 3.0 | 2.0 | 1406 | $1,650 | $1.17 | 43d | 1 | 0.58mi |
| 771 Monarch Dr Seguin, TX | 4.0 | 2.0 | 1612 | $1,740 | $1.08 | 2d | 1 | 0.61mi |
| 723 Armadillo Dr Seguin, TX | 4.0 | 2.0 | 1781 | $1,900 | $1.07 | 1d | 1 | 0.64mi |
| 728 Armadillo Dr Seguin, TX | 4.0 | 2.0 | 1612 | $1,745 | $1.08 | 1d | 1 | 0.65mi |
| 800 Nodding Nixie Seguin, TX | 4.0 | 2.0 | 1781 | $1,745 | $0.98 | 43d | 1 | 0.65mi |
| 912 Cinnamon Teal Seguin, TX | 4.0 | 2.0 | 1796 | $1,945 | $1.08 | 16d | 1 | 0.66mi |
| 812 Indigo Way Seguin, TX | 3.0 | 2.0 | 1574 | $1,900 | $1.21 | 1d | 1 | 0.75mi |
| 817 Pronghorn Trl Seguin, TX | 3.0 | 2.0 | 1575 | $1,695 | $1.08 | 19d | 1 | 0.77mi |
| 1051 Country Club Dr #28 Seguin, TX | 3.0 | 2.0 | 1032 | $1,300 | $1.26 | 3d | 1 | 0.86mi |
| 1048 Country Club Dr Seguin, TX | 1.0–3.0 | 1.0–2.0 | 829 | $1,150 | $1.39 | 1d | 5 | 0.87mi |
| 1051 Country Club Dr Seguin, TX | 2.0–3.0 | 2.0 | 990 | $1,400 | $1.41 | 43d | 3 | 0.88mi |
| 541 Chaco Loop Seguin, TX | 3.0 | 2.0 | 1263 | $1,800 | $1.43 | 1d | 1 | 0.90mi |
Listing history 13 events
-
2026-06-18days on market $178,499 Active 18 DOM
-
2026-06-17days on market $178,499 Active 17 DOM
-
2026-06-16days on market $178,499 Active 16 DOM
-
2026-06-13days on market $178,499 Active 13 DOM
-
2026-06-09days on market $178,499 Active 9 DOM
-
2026-06-08days on market $178,499 Active 8 DOM
-
2026-06-08price $178,499 Active 7 DOM
-
2026-06-07pricedays on market $182,499 Active 7 DOM
-
2026-06-04days on market $181,999 Active 4 DOM
-
2026-06-03days on market $181,999 Active 3 DOM
-
2026-06-02pricedays on market $181,999 Active 2 DOM
-
2026-06-01remarks 380-char remark
-
2026-06-01$187,999 Active 1 DOM
ⓘ Source: listings_history table (triggers on properties + properties_extension) + one-shot
backfill from property_details.listing_events for pre-trigger history.
Nearby sold comps map
Loading sold comps map…
Walkable amenities ~0.75 mi
Loading nearby amenities…
Taxation est. · year 1
- Rental income
- $21,588
- − Mortgage interest
- −$9,999
- − Property taxes
- −$2,677
- − Insurance
- −$892
- − Repairs & maintenance
- −$1,727
- − Management
- −$1,727
- − Depreciation
- −$5,193
- Taxable loss
- −$627
- Est. tax savings @ 24.0%
- +$150
- After-tax cash flow
- $2,403/yr
For passive investors: Depreciation is non-cash, so a rental often shows a tax loss while cash-flowing — sheltering income. Rental losses are passive: they offset passive income freely, and up to $25,000/yr can offset ordinary (W-2) income if you actively participate and your MAGI is under $100k (phasing out to $0 by $150k); unused losses carry forward. On sale, claimed depreciation is recaptured at up to 25%, and gains may owe capital-gains tax (a 1031 exchange can defer both). Figures are a year-1 estimate at your 24.0% rate — not tax advice; consult a CPA.
Condition & rehab AI · 2 photos
This home requires extensive repairs and maintenance, including a new roof, siding repair and painting, and landscaping. Significant updates are needed to improve its condition and value.
Repairs flagged
- Major roof — Significant damage and potential leaks.
- Major siding — Peeling paint and possible rot.
- Major landscaping — Overgrown and unkempt, needs trimming and maintenance.
Value-add opportunities
- Resale roof repair — A new roof would significantly improve the home's appearance and value.
- Resale siding repair and painting — New siding and paint would enhance the home's curb appeal and value.
- Both landscaping — A well-maintained landscape would improve both resale and rental value.
- Resale interior painting and updates — Fresh paint and updates inside would make the home more attractive to potential buyers.
- Both HVAC and mechanicals — Upgrading HVAC and mechanicals would improve comfort and energy efficiency, benefiting both resale and rental value.
Renovation cost estimate screening
| Repair item | Severity | Est. cost |
|---|---|---|
| roof · Significant damage and potential leaks. | Major | $15,000–50,000 |
| siding · Peeling paint and possible rot. | Major | $15,000–50,000 |
| landscaping · Overgrown and unkempt, needs trimming and maintenance. | Major | $15,000–50,000 |
| Total estimated repair cost · 3 items | $45,000–150,000 |
Value-add ROI direction
- Resale roof repair — A new roof would significantly improve the home's appearance and value. ↑
- Resale siding repair and painting — New siding and paint would enhance the home's curb appeal and value. ↑
- Both landscaping — A well-maintained landscape would improve both resale and rental value. ↑
- Resale interior painting and updates — Fresh paint and updates inside would make the home more attractive to potential buyers. ↑
- Both HVAC and mechanicals — Upgrading HVAC and mechanicals would improve comfort and energy efficiency, benefiting both resale and rental value. ↑
ⓘ Cost ranges are severity-bucket heuristics (US national rule-of-thumb). Get contractor quotes + a written scope before underwriting a rehab budget.
Schools (NCES district)
- District
- Seguin ISD
- NCES district ID
- 4839690
- Math proficiency
- 26% ▼ -8.00%
- Reading proficiency
- 30% ▼ -5.00%
- Median HH income
- $46,210
- Composite
- 24.17/100
- National rank
- #7738
- State rank
- #663 of 826 in TX
Livability — Seguin
- Score
- 66/100
- State rank
- #592
- US rank
- #11298
Category grades
Schools grade is shown separately in the Schools card above.
Census & demographics
- Census place
- Seguin, TX
- County
- Guadalupe County · 147,291 people
- City population
- 55,600
- Metro
- San Antonio-New Braunfels, TX
- Population (ZIP)
- 55,600
- Household income
- $71,039
- Rent vs Own
- Severe rent burden
- 1053.0
Population outlook (Guadalupe County) Hauer SSP2
- Today (2025)
- 196,854 people
- By 2030
- 220,210 · +11.9%
- By 2040
- 268,004 · +36.1%
- By 2050
- 316,333 · +60.7%
- By 2075
- 434,747 · +120.8%
- By 2100
- 520,447 · +164.4%
Race, ethnicity, and origin ACS 2023
- Neighborhood character
- Diverse neighborhood (Simpson 0.58)
- Race & ethnicity
- Hispanic / Latino 49% White 43% Two or more races 26% Black 5%
- Hispanic origin (detail)
- Mexican 41%
- Common ancestry
- Lithuanian 2% Slovak 1% Romanian 1%
- Foreign-born
- 8% · Canada
- Languages at home
- 74% English-only · Spanish 24% German/W. Germanic 1%
Political lean MEDSL · Guadalupe
- 2024 margin
- Strong R (+29.5) · D 34.8% · R 64.3%
- 2008→2024 swing
- +1.5pp toward D · 2008: -31.0pp · 2024: -29.5pp
- All cycles
- 2024: R+29.5 2020: R+24.2 2016: R+31.8 2012: R+35.1 2008: R+31.0
Not yet ingested
- Civics
- —
Market trends
- HPI YoY
- ▼ -147.43%
- Current HPI
- 160.5435
- Rent YoY
- ▲ 2.04%
- Metro
- San Antonio-New Braunfels, TX
- State GDP YoY
- ▲ 3.95%
- F500 in state
- 110
Industry mix (Fortune 500 HQ in TX)
| Industry | F500 HQs | Revenue |
|---|---|---|
| Energy | 16 | $1,198B |
|
||
| Technology | 5 | $198B |
|
||
| Engineering / Construction | 4 | $72B |
|
||
| Energy Services | 3 | $60B |
|
||
| Utilities | 3 | $41B |
|
||
| Healthcare | 2 | $330B |
|
||
Cash-flow waterfall
monthlySold comps — $/sqft
last 12 mo · ≤1 miLoading sold comps…