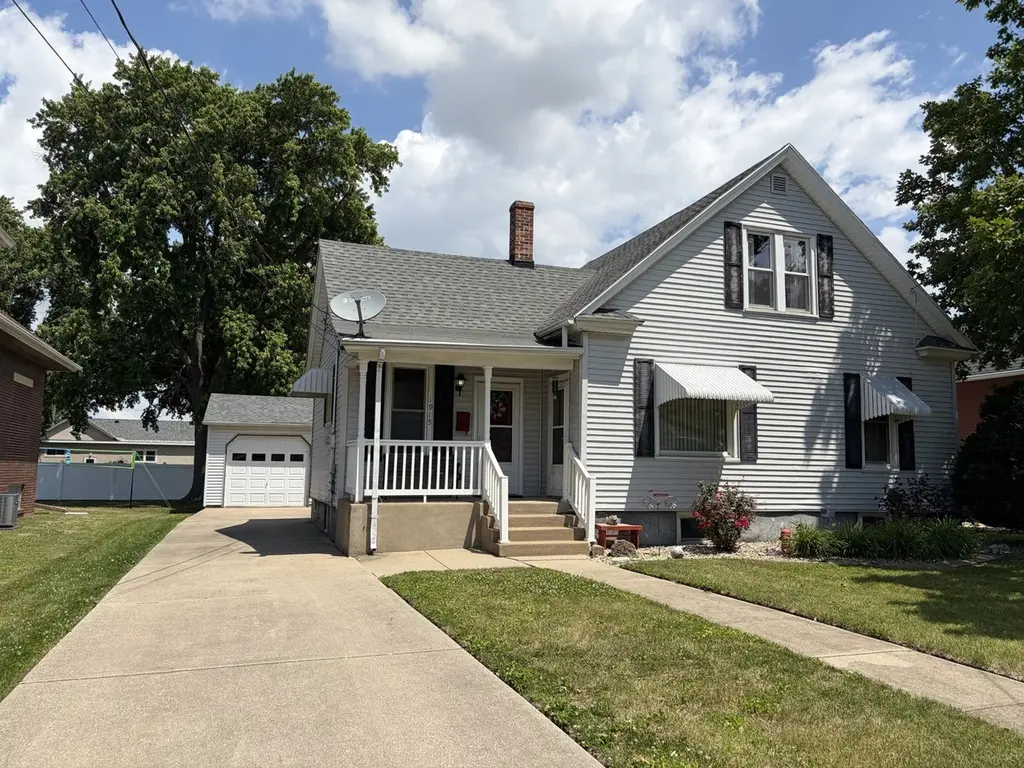
1915 9th St · Peru, IL
Flood risk 1/10 · Minimal
- FEMA flood zone
- X (unshaded)
- Chance of flooding over 30 yrs
- 0.0%
- Est. flood insurance / yr
- $473 – $860
Fire risk 3/10 · Minor
- Est. fire insurance / yr
- $804 – $1,492
Heat risk 3/10 · Minor
- Hot days now (above 104°F)
- 7 days/yr
- Hot days in 30 yrs
- 16 days/yr
Wind risk 2/10 · Minimal
- Chance of severe wind over 30 yrs
- 0.0%
Air-quality risk 2/10 · Minimal
- Unhealthy air days now
- 1 days/yr
- Unhealthy air days in 30 yrs
- 1 days/yr
Risk factors via First Street. Map © Google.
Why this score? — see what drove the D+ grade
The composite is a weighted blend of 9 inputs, each scored 0–100. Each bar is that input's sub-score; the figure is the points it added to the 100-point composite (weight × sub-score).
- Cash flow +16.6/30.0
- ARV discount +12.7/15.0
- DSCR +5.1/10.0
- 1% rule +4.2/10.0
- Livability +3.5/5.0
- Rent growth +2.5/5.0
- Condition / age +2.5/5.0
- Schools +1.7/10.0
- Appreciation +0.0/10.0
$157,900
🖨 Deal sheet (PDF) 📄 Offer letter ✓ Due diligence
Listing remarks
Move right into this neat 2 bedroom, 1.5 bath home located in a nice Peru neighborhood. Home features maintenance free vinyl siding, spacious living room, easy stair access to the attic through one of the bedrooms. Clean attic for possible expansion. Water heater new in 2025. Covered rear concrete stoop, 2+car detached garage. All items in the house will remain. This home is a must see!
Key facts
- 7,405 sq ft lot
- 2 garage spots
- Built 1895
Tags
Property features AI
Finance
- Other: Directions: Rt 6 east to Peru Street, north to 9th Street, east
- HOA & community: No master association fee required
Exterior
- Parking: Detached garage (garage owned) with 2 garage spaces; Concrete driveway; Total parking for 4 vehicles; Garage door opener
- Utilities: Public water; Storm sewer; Electric service with circuit breakers
- Home design: Detached single-family home; One story; Fee simple ownership; Property more than 100 years old; Built before 1978
- Construction: Vinyl siding; Asphalt roof; Stone foundation
- Exterior features: Patio; Lot dimensions approximately 60 x 125; Less than 0.25 acre lot; Curbs, sidewalks, street lights, paved streets; Park nearby
Interior
- Kitchen: Kitchen with island (11 x 12, laminate flooring)
- Bedrooms: Master bedroom on main level (11 x 11, carpet); Second bedroom on main level (10 x 11, carpet); Additional bedrooms listed
- Flooring: Carpet in bedrooms and living areas; Laminate in kitchen
- Bathrooms: One full bathroom; One half bathroom
- Heating & cooling: Natural gas forced air heating; Central air conditioning
- Interior features: Four total rooms; Unfinished full basement; School bus service available
- Laundry & utility: Laundry room; Washer and dryer included
Neighborhood map
What this means for you Summary
Snapshot
- This is a 2-bed/1.5-bath single-family listed at $158k.
Deal economics
- At list price, monthly cash flow is $95 ($1k/yr) — positive.
- The deal already cash-flows at list — no discount required.
- To meet the 1% rule (rent ≥ 1% of price), the offer needs to be $145k (8.2% below list).
- Recommended offer: $145k (8.2% below list) — sets the bar for 1% rule.
Location & tenants
- Location reads 70/100 on livability (#383 in IL) — a middle-class / working-renter tenant base. Strengths: cost of living A+, housing A+; Watch: health & safety C-, employment D+, amenities F.
- La Salle-Peru Twp Hsd 120 (town): math 15% / reading 26% proficiency, ranked #427 of 620 in IL (top 69%) — low school quality limits family demand, transient renter base, plan for 1-2y turnover.
- Zoned schools: Northview Elem School (math 27% / reading 32%, grade F, #658 of 2,056 statewide, top 35%, 575 students, 0% FRL); Parkside Middle School (math 17% / reading 29%, grade F, #377 of 665 statewide, top 58%, 368 students, 0% FRL); La Salle-Peru Twp High School (math 15% / reading 26%, grade F, #350 of 693 statewide, top 51%, 1,198 students, 0% FRL).
- Market conditions: 51 active listings in the ZIP; 1 comparable units currently listed for rent nearby; 82 units permitted in LaSalle County in 2024 (0 in 5+ unit buildings).
Forward outlook
- Local home prices are declining (-3.0%/yr); year-one equity from $1k of loan paydown is wiped out by about $5k of value loss. Plan a longer hold.
- LaSalle County population projected at -16% by 2050 — secular population decline; favor cash flow + early exit over multi-decade hold.
Negotiation context
- Only 13 days on market — expect competitive offers; lowballing is unlikely to land.
Risks & watch-outs
- Watch-outs: built in 1895 — expect roof / HVAC / electrical / plumbing capex.
Questions for the listing agent
- Built in 1895 — when were the roof, HVAC, electrical panel, plumbing, and water heater last replaced?
- Is there a deadline driving the sale (1031 exchange, divorce, estate, relocation)? That informs how much negotiation room exists.
- Schools are D-rated, which usually means shorter tenancies and higher turnover. Who's the typical renter profile here, and what's been the actual vacancy rate?
- The area grade is low — what's the realistic commute time and amenity access for the typical tenant pool here? Any planned neighborhood developments (good or bad) we should know about?
- What's the average days-on-market for RENTAL listings here right now (not sales)? A rising rental-DOM trend means longer vacancies and softer asking-rent achievability than the comps imply.
- What's the recent tenant-quality profile in this submarket — average credit score on applications, eviction rate, late-payment / NSF rate, and stable-employment percentage? A property-management company in the area should have these aggregated.
- How much new for-sale + rental construction is in the pipeline within 1–3 miles? Heavy new supply typically softens prices + rents 12–24 months out; constrained supply supports both.
Investment metrics
- 1% rule
- 0.92% ✗
- Cap rate
- 7.01%
- Cash-on-cash
- 2.58%
- DSCR
- 1.11
- GRM
- 9.1
CMA / ARV
- ARV (on-the-fly)
- $178,704
- Comps found
- 12
Show comp detail 12 sales within ~0.75 mi
| Address | Dist | Beds/Ba | Sqft | Sold | Price | $/sf | Match |
|---|---|---|---|---|---|---|---|
| 1529 9th St | 0.25mi | 2/2.0 | 1,376 (+5%) | 11mo | $250,000 | $182 | 69 |
| 1024 Peoria St | 0.18mi | 3/1.5 (+1) | 1,452 (+10%) | 2mo | $156,000 | $107 | 68 |
| 2430 8th St | 0.37mi | 2/1.5 | 1,190 (-9%) | 2mo | $162,000 | $136 | 65 |
| 2107 Wynnewood Ln | 0.53mi | 3/2.0 (+1) | 1,275 (-3%) | 11mo | $182,500 | $143 | 54 |
| 2120 Schuyler Dr | 0.55mi | 3/1.0 (+1) | 1,371 (+4%) | 9mo | $159,000 | $116 | 53 |
| 2120 Schuyler Dr | 0.55mi | 3/1.0 (+1) | 1,371 (+4%) | 9mo | $159,000 | $116 | 53 |
| 2301 Market St | 0.71mi | 3/2.0 (+1) | 1,340 (+2%) | 5mo | $215,000 | $160 | 52 |
| 2302 1st St | 0.58mi | 3/1.0 (+1) | 1,236 (-6%) | 6mo | $80,500 | $65 | 51 |
| 2618 7th St | 0.51mi | 2/2.0 | 1,153 (-12%) | 4mo | $172,000 | $149 | 51 |
| 2215 3rd St | 0.43mi | 3/2.0 (+1) | 1,455 (+11%) | 6mo | $180,000 | $124 | 50 |
| 1709 Sunset Dr | 0.66mi | 3/2.0 (+1) | 1,200 (-9%) | 11mo | $189,000 | $158 | 38 |
| 2721 6th St | 0.60mi | 3/1.5 (+1) | 1,492 (+14%) | 10mo | $160,000 | $107 | 36 |
Match score weights: distance 35% · size 25% · config 20% · recency 20%. Top-matched comps best support the ARV.
Projected returns pro-forma
-3.0% appreciation · 3.0% rent growth · sell at horizon
- IRR
- -12.2%
- Equity multiple
- 0.56×
- Total profit
- $-19,546
- Equity at exit
- $23,543
- IRR
- -3.1%
- Equity multiple
- 0.79×
- Total profit
- $-9,251
- Equity at exit
- $13,652
Cash invested: $44,212 (down + closing). Projections, not guarantees.
Landlord ↔ Tenant lean methodology
- Overall (STATE)
- 43 Moderately Tenant-Leaning
- State Illinois
- 43 Moderately Tenant-Leaning · D+7
- County
- — inherits STATE
- City
- — inherits STATE
ZIP-level market 61354
- Home prices YoY
- -20.2%
- Active inventory
- 51
- Price-to-rent
- 9.1×
Monthly cashflow live
- Estimated rent
- $1,450 medium interval (Pro) →
- Mortgage (P&I)
- −$828
- Tax from tax record
- −$157 /mo · $1,881/yr
- Insurance
- −$66
- HOA
- −$0
- Vacancy / Maint / Mgmt
- −$304
- Net cashflow
- $95
Break-even live
Sensitivity live
| Price | -10% $184 | -5% $140 | +0% $95 | +5% $50 | +10% $6 |
|---|---|---|---|---|---|
| Rent | -10% $-20 | -5% $38 | +0% $95 | +5% $152 | +10% $209 |
| Rate | -1.0pp $174 | -0.5pp $135 | base $95 | +0.5pp $54 | +1.0pp $12 |
UW: 25.0% down · 7.5% · 30yr · 1.5% tax · 5.0% vac · 8.0% maint · 8.0% mgmt
Financing live
Cash to close
- Down payment
- $39,475
- Closing costs
- $4,737
- Reserves months
- —
- Total cash needed
- —
Loan-product check · same deal, 3 products live
Conventional
25% down · 7.5% · 30yr
- Down + closing
- —
- Monthly P&I
- —
- Monthly cashflow
- —
- DSCR
- —
- Eligible?
- —
Personal DTI + credit; lowest rate.
DSCR
20% down · 8.5% · 30yr
- Down + closing
- —
- Monthly P&I
- —
- Monthly cashflow
- —
- DSCR
- —
- Eligible?
- —
No personal income docs; deal must DSCR.
Hard money
10% down · 12.0% · 12mo
- Down + closing
- —
- Monthly P&I
- —
- Monthly cashflow
- —
- DSCR
- —
- Eligible?
- —
Short-term bridge; refi at stabilization.
Rent comps 1 comps
| Address | Beds | Baths | Sqft | Rent | $/sqft | DOM | Units | Dist |
|---|---|---|---|---|---|---|---|---|
| 2939 7th St Peru, IL | 3.0 | 1.0 | 1260 | $1,450 | $1.15 | 45d | 1 | 0.77mi |
Listing history 9 events
-
2026-06-22days on market $157,900 Active 13 DOM
-
2026-06-19days on market $157,900 Active 10 DOM
-
2026-06-18days on market $157,900 Active 9 DOM
-
2026-06-17days on market $157,900 Active 8 DOM
-
2026-06-16days on market $157,900 Active 7 DOM
-
2026-06-15days on market $157,900 Active 6 DOM
-
2026-06-14days on market $157,900 Active 4 DOM
-
2026-06-12remarks 389-char remark
-
2026-06-12$157,900 Active 3 DOM
ⓘ Source: listings_history table (triggers on properties + properties_extension) + one-shot
backfill from property_details.listing_events for pre-trigger history.
Tax reassessment forecast IL · Partial reset (capped growth)
- Current annual tax
- $1,881 · $157/mo
- Projected year-2 tax
- $2,733 · $228/mo
- Expected delta
- +$852/yr (+$71/mo · 45.3%)
ⓘ Screening estimate from a state-policy table — verify with the county assessor before closing.
Climate risk First Street
- Flood 1/10 Low FEMA zone X (unshaded) · 0% chance over 30 yrs
- Wildfire 3/10 Moderate
- Heat 3/10 Moderate 7 d/yr ≥104°F today · 16 d/yr by 30 yrs out
- Wind 2/10 Low 0% chance of damaging wind over 30 yrs
- Air quality 2/10 Low 1 unhealthy d/yr today · 1 by 30 yrs out
Nearby sold comps map
Loading sold comps map…
Walkable amenities ~0.75 mi
Loading nearby amenities…
Taxation est. · year 1
- Rental income
- $17,400
- − Mortgage interest
- −$8,845
- − Property taxes
- −$1,881
- − Insurance
- −$790
- − Repairs & maintenance
- −$1,392
- − Management
- −$1,392
- − Depreciation
- −$4,593
- Taxable loss
- −$1,493
- Est. tax savings @ 24.0%
- +$358
- After-tax cash flow
- $1,497/yr
For passive investors: Depreciation is non-cash, so a rental often shows a tax loss while cash-flowing — sheltering income. Rental losses are passive: they offset passive income freely, and up to $25,000/yr can offset ordinary (W-2) income if you actively participate and your MAGI is under $100k (phasing out to $0 by $150k); unused losses carry forward. On sale, claimed depreciation is recaptured at up to 25%, and gains may owe capital-gains tax (a 1031 exchange can defer both). Figures are a year-1 estimate at your 24.0% rate — not tax advice; consult a CPA.
Schools (NCES district)
- District
- La Salle-Peru Twp Hsd 120
- NCES district ID
- 1722110
- Math proficiency
- 15% ▼ -11.00%
- Reading proficiency
- 26% ▼ -11.00%
- Median HH income
- $40,449
- Composite
- 17.37/100
- National rank
- #9070
- State rank
- #427 of 620 in IL
Livability — Peru
- Score
- 70/100
- State rank
- #383
- US rank
- #7989
Category grades
Schools grade is shown separately in the Schools card above.
Census & demographics
- Census place
- Peru, IL
- City population
- 10,366
- Population (ZIP)
- 10,366
Population outlook (LaSalle County) Hauer SSP2
- Today (2025)
- 107,080 people
- By 2030
- 104,196 · -2.7%
- By 2040
- 97,413 · -9.0%
- By 2050
- 90,294 · -15.7%
- By 2075
- 76,252 · -28.8%
- By 2100
- 61,339 · -42.7%
Race, ethnicity, and origin ACS 2023
- Neighborhood character
- Predominantly White (85%)
- Race & ethnicity
- White 85% Hispanic / Latino 10% Two or more races 5% Asian 2%
- Hispanic origin (detail)
- Mexican 9%
- Common ancestry
- Romanian 12% Lithuanian 2% Portuguese 2%
- Foreign-born
- 6% · Canada
- Languages at home
- 92% English-only · Spanish 4% Other Indo-European 1% German/W. Germanic 1%
Political lean MEDSL · LaSalle
- 2024 margin
- R (+18.5) · D 40.1% · R 58.6% · Other 1.3%
- 2008→2024 swing
- -29.6pp toward R · 2008: 11.1pp · 2024: -18.5pp
- All cycles
- 2024: R+18.5 2020: R+14.3 2016: R+14.4 2012: R+0.4 2008: D+11.1
Not yet ingested
- Civics
- —
Market trends
- HPI YoY
- ▼ -43.35%
- Current HPI
- 170.95
- Rent YoY
- —
- Metro
- —
- State GDP YoY
- ▲ 1.59%
- F500 in state
- 60
Industry mix (Fortune 500 HQ in IL)
| Industry | F500 HQs | Revenue |
|---|---|---|
| Insurance | 4 | $201B |
|
||
| Consumer Goods | 4 | $87B |
|
||
| Industrial Machinery | 3 | $64B |
|
||
| Healthcare | 2 | $55B |
|
||
| Retail / Pharmacy | 1 | $148B |
|
||
| Agriculture / Food | 1 | $86B |
|
||
Price history
1 event — show timeline
- 2026-06-07 Listed $157,900 MRED as Distributed by MLS Grid
Property tax history
+1.4%/yrLatest (2024): $1,881 · -18.4% YoY. Source: county tax records.
Cash-flow waterfall
monthlySold comps — $/sqft
last 12 mo · ≤1 miLoading sold comps…