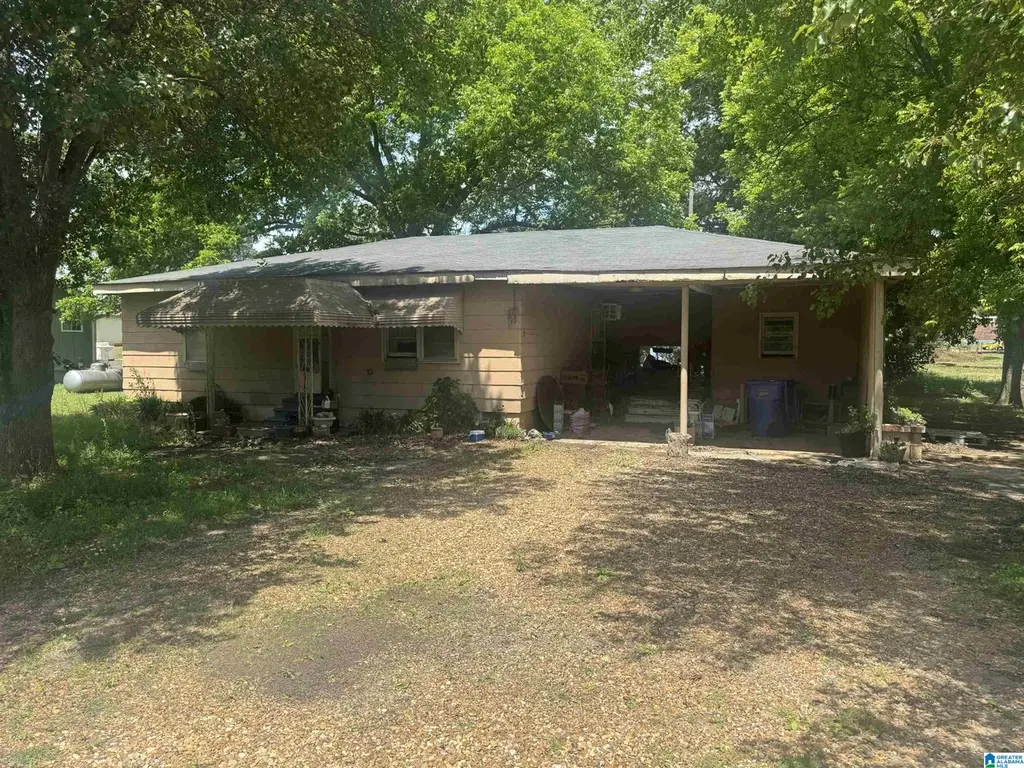
904 E Ladiga St · Piedmont, AL
Flood risk 1/10 · Minimal
- FEMA flood zone
- X (unshaded)
- Chance of flooding over 30 yrs
- 0.0%
- Est. flood insurance / yr
- $507 – $1,088
Fire risk 5/10 · Moderate
- Est. fire insurance / yr
- $916 – $1,700
Heat risk 6/10 · Moderate
- Hot days now (above 105°F)
- 7 days/yr
- Hot days in 30 yrs
- 19 days/yr
Wind risk 5/10 · Moderate
- Chance of severe wind over 30 yrs
- 25.0%
Air-quality risk 2/10 · Minimal
- Unhealthy air days now
- 1 days/yr
- Unhealthy air days in 30 yrs
- 2 days/yr
Risk factors via First Street. Map © Google.
Why this score? — see what drove the B+ grade
The composite is a weighted blend of 9 inputs, each scored 0–100. Each bar is that input's sub-score; the figure is the points it added to the 100-point composite (weight × sub-score).
- Cash flow +30.0/30.0
- ARV discount +15.0/15.0
- DSCR +10.0/10.0
- 1% rule +8.8/10.0
- Schools +4.0/10.0
- Livability +2.9/5.0
- Rent growth +2.5/5.0
- Condition / age +2.5/5.0
- Appreciation +0.0/10.0
$70,000
🖨 Deal sheet 📄 Offer letter ✓ Due diligence
Listing remarks
Investor special alert. If your ready to try your hand at becoming a landlord, a flipper or looking for a cheaper option to becoming a home owner then you will want to come see this one. 3 Bedroom 1 Bath home is situated on a large flat lot in a great neighborhood on the edge of town. Inside you will find a big living room with hardwood floors, an eat in kitchen with plenty of cabinetry, counter space, built ins and a pantry. a recently remodled bath with an oversized handicapped tile shower.
Key facts
- Eat in kitchen
- Large flat lot
- Plenty of cabinetry
Tags
Property features AI
Finance
- Other: Lot size approximately 0.43 acre; Located in the Piedmont tax/school area
Exterior
- Parking: Attached parking; Driveway parking; One carport space
- Utilities: Public water; Connected sewer; Internet available (Charter Spectrum & AT&T)
- Home design: Existing (previously built) property; Crawl space foundation; Siding (other)
- Construction: Siding exterior; Crawl space foundation
- Exterior features: Storage building; No pool, patio, deck, or garden/patio; Not waterfront
Interior
- Kitchen: Eating area; Pantry; Laminate countertops; Refrigerator; Electric stove
- Bedrooms: Three bedrooms on the main level
- Flooring: Carpet; Hardwood; Tile; Vinyl
- Bathrooms: One full bathroom with separate shower
- Heating & cooling: Gas heating; Window air conditioning units
- Interior features: Handyman special; Attic present; Ceilings: Other (see remarks)
- Laundry & utility: Laundry room on the main level; Washer hookup; Electric dryer hookup; Gas water heater
Neighborhood map
What this means for you Summary
Snapshot
- This is a 3-bed/1.0-bath single-family listed at $70k.
Deal economics
- At list price, monthly cash flow is $347 ($4k/yr) — positive.
- The deal already cash-flows at list — no discount required.
- Meets the 1% rule at list price ($966 rent vs $70k).
- Recommended offer: $68k (3.0% below list) — sets the bar for market timing.
- Cap rate 12.3% vs local median 4.5% in Piedmont — top-decile yield for the area; either an underpriced asset or a hidden risk that comps aren't pricing in. Stress-test before assuming the spread holds.
Location & tenants
- Location reads 57/100 on livability (#402 in AL) — a working-class tenant base; expect higher turnover. Strengths: cost of living A+, housing A+; Watch: crime F, amenities F, commute F.
- Piedmont City (town): math 40% / reading 57% proficiency, ranked #14 of 129 in AL (top 11%) — families likely to look elsewhere, expect single-tenant / working-renter base with shorter leases.
- Zoned schools: Piedmont Elementary School (math 50% / reading 66%, grade C+, #72 of 627 statewide, top 12%, 534 students, 64% FRL); Piedmont High School (math 22% / reading 32%, grade F, #90 of 305 statewide, top 35%, 342 students, 62% FRL).
- Market conditions: 88 active listings in the ZIP; 135 units permitted in Calhoun County in 2024 (0 in 5+ unit buildings).
Forward outlook
- Local home prices are declining (-3.0%/yr); year-one equity from $484 of loan paydown is wiped out by about $2k of value loss. Plan a longer hold.
- Calhoun County population projected at -21% by 2050 — secular population decline; favor cash flow + early exit over multi-decade hold.
- At projected returns (-3.0% appreciation + 3.0% rent growth), your $20k cash investment doubles in ~6 years — after that, you're playing with house money.
Negotiation context
- It's been on market 45 days — a 3% lower offer ($68k) is reasonable based on typical stale-listing flexibility.
- Current owner paid $37k; list at $70k implies a 89% gain — meaningful room to come down on a strong offer.
Risks & watch-outs
- Climate carrying-cost: moderate wind risk, 25% chance of damaging wind over 30y; moderate wildfire risk; extreme-heat days projected 7→19/yr by 2055 (HVAC capex compounding) — expect insurance premiums to compound above CPI over the hold.
Questions for the listing agent
- It's been on market 45 days. Have you received any prior offers? Is the seller open to a 3% concession, seller financing, or rate buy-down credit?
- Built in 1961 — when were the roof, HVAC, electrical panel, plumbing, and water heater last replaced?
- Is there a deadline driving the sale (1031 exchange, divorce, estate, relocation)? That informs how much negotiation room exists.
- Crime grade is F in this area — have there been break-ins, vandalism, or insurance claims at this property in the last 3 years? What carrier currently insures it and at what premium?
- What's the average days-on-market for RENTAL listings here right now (not sales)? A rising rental-DOM trend means longer vacancies and softer asking-rent achievability than the comps imply.
- What's the recent tenant-quality profile in this submarket — average credit score on applications, eviction rate, late-payment / NSF rate, and stable-employment percentage? A property-management company in the area should have these aggregated.
- How much new for-sale + rental construction is in the pipeline within 1–3 miles? Heavy new supply typically softens prices + rents 12–24 months out; constrained supply supports both.
Investment metrics
- 1% rule
- 1.38% ✓
- Cap rate
- 12.25%
- Cash-on-cash
- 21.28%
- DSCR
- 1.95
- GRM
- 6.0
CMA / ARV
- ARV (median comp)
- $97,935
- List price
- $70,000
- Delta
- -28.52%
- Verdict
- UNDERPRICED
- Comps
- 20 within 1.0 mi
Show comp detail 7 sales within ~0.75 mi
| Address | Dist | Beds/Ba | Sqft | Sold | Price | $/sf | Match |
|---|---|---|---|---|---|---|---|
| 602 E Ladiga St | 0.23mi | 2/1.0 (-1) | 1,088 (+5%) | 5mo | $40,000 | $37 | 72 |
| 121 Taylor St | 0.48mi | 2/1.0 (-1) | 1,024 (-1%) | 1mo | $108,500 | $106 | 70 |
| 120 Old Ladiga Rd | 0.22mi | 2/1.0 (-1) | 1,052 (+1%) | 15mo | $45,000 | $43 | 70 |
| 411 Cedartown Hwy | 0.28mi | 2/1.0 (-1) | 1,085 (+5%) | 14mo | $87,500 | $81 | 63 |
| 605 Logan St | 0.32mi | 2/1.0 (-1) | 952 (-8%) | 12mo | $60,000 | $63 | 57 |
| 303 Southern Ave | 0.64mi | 2/1.0 (-1) | 994 (-4%) | 12mo | $105,000 | $106 | 48 |
| 612 Morgan St | 0.73mi | 3/1.0 | 904 (-13%) | 9mo | $110,000 | $122 | 37 |
Match score weights: distance 35% · size 25% · config 20% · recency 20%. Top-matched comps best support the ARV.
Projected returns pro-forma
-3.0% appreciation · 3.0% rent growth · sell at horizon
- IRR
- 13.8%
- Equity multiple
- 1.55×
- Total profit
- $10,762
- Equity at exit
- $10,437
- IRR
- 22.5%
- Equity multiple
- 2.93×
- Total profit
- $37,761
- Equity at exit
- $6,052
Cash invested: $19,600 (down + closing). Projections, not guarantees.
Landlord ↔ Tenant lean methodology
- Overall (STATE)
- 90 Strongly Landlord-Friendly
- State Alabama
- 90 Strongly Landlord-Friendly · R+15
- County
- — inherits STATE
- City
- — inherits STATE
ZIP-level market 36272
- Home prices YoY
- -10.2%
- Active inventory
- 88
- Price-to-rent
- 6.0×
Monthly cashflow live
- Estimated rent
- $966 medium interval (Pro) →
- Mortgage (P&I)
- −$367
- Tax from tax record
- −$20 /mo · $237/yr
- Insurance
- −$29
- HOA
- −$0
- Vacancy / Maint / Mgmt
- −$203
- Net cashflow
- $347
Break-even live
UW: 25.0% down · 7.5% · 30yr · 1.5% tax · 5.0% vac · 8.0% maint · 8.0% mgmt
Financing live
Cash to close
- Down payment
- $17,500
- Closing costs
- $2,100
- Reserves months
- —
- Total cash needed
- —
Loan-product check · same deal, 3 products live
Conventional
25% down · 7.5% · 30yr
- Down + closing
- —
- Monthly P&I
- —
- Monthly cashflow
- —
- DSCR
- —
- Eligible?
- —
Personal DTI + credit; lowest rate.
DSCR
20% down · 8.5% · 30yr
- Down + closing
- —
- Monthly P&I
- —
- Monthly cashflow
- —
- DSCR
- —
- Eligible?
- —
No personal income docs; deal must DSCR.
Hard money
10% down · 12.0% · 12mo
- Down + closing
- —
- Monthly P&I
- —
- Monthly cashflow
- —
- DSCR
- —
- Eligible?
- —
Short-term bridge; refi at stabilization.
Listing history 18 events
-
2026-06-19days on market $70,000 Active 45 DOM
-
2026-06-18days on market $70,000 Active 44 DOM
-
2026-06-17days on market $70,000 Active 43 DOM
-
2026-06-16days on market $70,000 Active 42 DOM
-
2026-06-15days on market $70,000 Active 41 DOM
-
2026-06-14days on market $70,000 Active 39 DOM
-
2026-06-12days on market $70,000 Active 38 DOM
-
2026-06-09days on market $70,000 Active 35 DOM
-
2026-06-08days on market $70,000 Active 34 DOM
-
2026-06-07days on market $70,000 Active 33 DOM
-
2026-06-07days on market $70,000 Active 32 DOM
-
2026-06-04days on market $70,000 Active 29 DOM
-
2026-06-02days on market $70,000 Active 28 DOM
-
2026-06-01days on market $70,000 Active 27 DOM
-
2026-05-31days on market $70,000 Active 26 DOM
-
2026-05-31days on market $70,000 Active 25 DOM
-
2026-05-05$70,000 Active 497-char remark
-
2006-05-05soldstatus $37,000
ⓘ Source: listings_history table (triggers on properties + properties_extension) + one-shot
backfill from property_details.listing_events for pre-trigger history.
Tax reassessment forecast AL · Resets to sale price
- Current annual tax
- $237 · $20/mo
- Projected year-2 tax
- $287 · $24/mo
- Expected delta
- +$50/yr (+$4/mo · 21.2%)
ⓘ Screening estimate from a state-policy table — verify with the county assessor before closing.
Climate risk First Street
- Flood 1/10 Low FEMA zone X (unshaded) · 0% chance over 30 yrs
- Wildfire 5/10 Major
- Heat 6/10 Major 7 d/yr ≥105°F today · 19 d/yr by 30 yrs out
- Wind 5/10 Major 25% chance of damaging wind over 30 yrs
- Air quality 2/10 Low 1 unhealthy d/yr today · 2 by 30 yrs out
Nearby sold comps map
Loading sold comps map…
Walkable amenities ~0.75 mi
Loading nearby amenities…
Taxation est. · year 1
- Rental income
- $11,597
- − Mortgage interest
- −$3,921
- − Property taxes
- −$237
- − Insurance
- −$350
- − Repairs & maintenance
- −$928
- − Management
- −$928
- − Depreciation
- −$2,036
- Taxable income
- $3,197
- Est. tax owed @ 24.0%
- −$767
- After-tax cash flow
- $3,403/yr
For passive investors: Depreciation is non-cash, so a rental often shows a tax loss while cash-flowing — sheltering income. Rental losses are passive: they offset passive income freely, and up to $25,000/yr can offset ordinary (W-2) income if you actively participate and your MAGI is under $100k (phasing out to $0 by $150k); unused losses carry forward. On sale, claimed depreciation is recaptured at up to 25%, and gains may owe capital-gains tax (a 1031 exchange can defer both). Figures are a year-1 estimate at your 24.0% rate — not tax advice; consult a CPA.
Schools (NCES district)
- District
- Piedmont City
- NCES district ID
- 0102760
- Math proficiency
- 40% ▼ -14.00%
- Reading proficiency
- 57% ▲ 6.00%
- Median HH income
- $32,302
- Composite
- 39.78/100
- National rank
- #3881
- State rank
- #14 of 129 in AL
Livability — Piedmont
- Score
- 57/100
- State rank
- #402
- US rank
- #22342
Category grades
Schools grade is shown separately in the Schools card above.
Census & demographics
- Census place
- Piedmont, AL
- City population
- 12,996
- Population (ZIP)
- 12,996
Population outlook (Calhoun County) Hauer SSP2
- Today (2025)
- 109,765 people
- By 2030
- 105,708 · -3.7%
- By 2040
- 96,192 · -12.4%
- By 2050
- 86,413 · -21.3%
- By 2075
- 63,467 · -42.2%
- By 2100
- 44,704 · -59.3%
Race, ethnicity, and origin ACS 2023
- Neighborhood character
- Predominantly White (90%)
- Race & ethnicity
- White 90% Black 5% Two or more races 3% Hispanic / Latino 2%
- Common ancestry
- Russian 2% Serbian 1% Lithuanian 1%
- Foreign-born
- 2% · Canada
- Languages at home
- 96% English-only · Spanish 4%
Political lean MEDSL · Calhoun
- 2024 margin
- Solid R (+44.8) · D 27.2% · R 71.9%
- 2008→2024 swing
- -12.2pp toward R · 2008: -32.5pp · 2024: -44.8pp
- All cycles
- 2024: R+44.8 2020: R+39.0 2016: R+41.4 2012: R+31.9 2008: R+32.5
Not yet ingested
- Civics
- —
Market trends
- HPI YoY
- ▼ -21.87%
- Current HPI
- 192.177
- Rent YoY
- —
- Metro
- —
- State GDP YoY
- ▲ 2.94%
- F500 in state
- 4
Industry mix (Fortune 500 HQ in AL)
| Industry | F500 HQs | Revenue |
|---|---|---|
| Financial Services | 1 | $8B |
|
||
| Healthcare | 1 | $5B |
|
||
Price history
+89.2% since first listed2 events — show timeline
- 2026-05-05 Listed $70,000 Greater Alabama MLS
- 2006-05-05 Sold (Public Records) $37,000 Public Records
Cash-flow waterfall
monthlySold comps — $/sqft
last 12 mo · ≤1 miLoading sold comps…