 Duplex
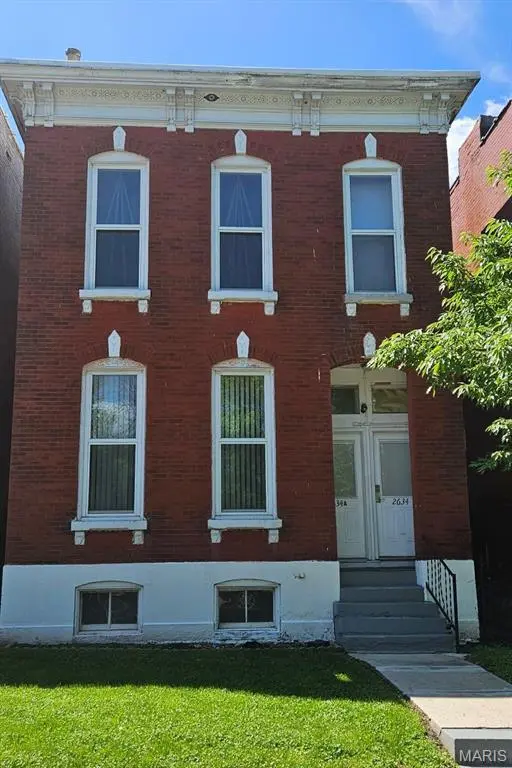
2634 Geyer Ave · St. Louis, MO
Flood risk 4/10 · Minor
- FEMA flood zone
- X (unshaded)
- Chance of flooding over 30 yrs
- 0.21%
- Est. flood insurance / yr
- $473 – $860
Fire risk 1/10 · Minimal
- Est. fire insurance / yr
- $1,054 – $1,958
Heat risk 5/10 · Moderate
- Hot days now (above 109°F)
- 7 days/yr
- Hot days in 30 yrs
- 21 days/yr
Wind risk 2/10 · Minimal
- Chance of severe wind over 30 yrs
- 1.0%
Air-quality risk 3/10 · Minor
- Unhealthy air days now
- 3 days/yr
- Unhealthy air days in 30 yrs
- 4 days/yr
Risk factors via First Street. Map © Google.
Why this score? — see what drove the B grade
The composite is a weighted blend of 9 inputs, each scored 0–100. Each bar is that input's sub-score; the figure is the points it added to the 100-point composite (weight × sub-score).
- Cash flow +29.5/30.0
- ARV discount +14.7/15.0
- DSCR +10.0/10.0
- 1% rule +7.6/10.0
- Rent growth +4.4/5.0
- Livability +2.5/5.0
- Condition / age +2.5/5.0
- Schools +1.2/10.0
- Appreciation +0.0/10.0
$249,900
🖨 Deal sheet 📄 Offer letter ✓ Due diligence
Multi-family units
County records classify this as Multi-Family (2-4 Unit). Listing-text estimate: 2 units. confirmed
Listing remarks MLS
Fantastic investment opportunity in the heart of Fox Park! This spacious duplex offers two large units, each with a bonus room and strong rental upside. The second-floor unit features 2 bedrooms, 1 bathroom, and a versatile bonus space perfect for an office or extra storage. The first-floor unit is a 1 bed / 1 bath with its own bonus room and generous room sizes throughout. Several major mechanical updates have already been completed, including a newer sewer lateral, updated water heaters, and a newer sump pump, reducing future maintenance costs for the next owner. The 2nd floor unit is rented month-to-month at a below-market rate of $973, offering immediate value-add potential. The 1st floor unit is currently being marketed at $1,100/month, aligning with neighborhood rent comps. Located in one of St. Louis’ most desirable historic neighborhoods, this property offers excellent long-term appreciation potential and steady cash flow. Whether you’re expanding your portfolio or looking for a solid first investment, this Fox Park duplex offers size, location, updated systems, and income growth opportunities — a strong addition for any investor. Be sure to check out our video walk through.
Key facts
- Spacious duplex
- Bonus room
- Strong rental upside
Tags
Neighborhood map
What this means for you Summary
Snapshot
- This is a 2 × 3-bed/2.0-bath units multifamily listed at $250k.
Deal economics
- At list price, monthly cash flow is $897 ($11k/yr) — positive. Per door: $449/mo.
- The deal already cash-flows at list — no discount required.
- Meets the 1% rule at list price ($3k rent vs $250k).
- Recommended offer: $220k (12.0% below list) — sets the bar for market timing.
- Cap rate 10.6% vs local median 5.0% in St. Louis — top-decile yield for the area; either an underpriced asset or a hidden risk that comps aren't pricing in. Stress-test before assuming the spread holds.
Location & tenants
- Location reads: area grade B — affects rentability + tenant quality, not the cash-flow math above.
- St. Louis City (urban): math 10% / reading 18% proficiency, ranked #312 of 324 in MO (top 96%) — low school quality limits family demand, transient renter base, plan for 1-2y turnover; 80% free/reduced lunch — lower-income household profile, screen leases tightly.
- Market conditions: Rents rising fast (+7.5%/yr); 165 active listings in the ZIP; 1 comparable units currently listed for rent nearby; 294 units permitted in St. Louis city in 2024 (227 in 5+ unit buildings).
- At $3,156/mo this rent would consume 55% of the median local household income ($69k/yr) (locally 1429% of renters already pay >50% of income on rent) — very limited rent-growth headroom before tenants either downsize or default.
Forward outlook
- Local home prices are declining (-3.0%/yr); year-one equity from $2k of loan paydown is wiped out by about $7k of value loss. Plan a longer hold.
- St. Louis County population projected to shrink 6% by 2050 — rents likely to lag national; underwrite the cash flow, not the appreciation.
- At projected returns (-3.0% appreciation + 7.5% rent growth), your $70k cash investment doubles in ~6 years — after that, you're playing with house money.
Negotiation context
- It's been on market 168 days — a 12% lower offer ($220k) is reasonable based on typical stale-listing flexibility.
- 7 sale attempts since 10y ago; this cycle's ask has dropped $15k (6%) from the opening price — seller is motivated, your offer sets the floor, not the list.
- Current owner paid $160k; list at $250k implies a 56% gain — meaningful room to come down on a strong offer.
Risks & watch-outs
- Watch-outs: built in 1885 — expect roof / HVAC / electrical / plumbing capex.
- Climate carrying-cost: extreme-heat days projected 7→21/yr by 2055 (HVAC capex compounding) — expect insurance premiums to compound above CPI over the hold.
Questions for the listing agent
- It's been on market 168 days. Have you received any prior offers? Is the seller open to a 12% concession, seller financing, or rate buy-down credit?
- Can we see the unit-by-unit rent roll, current vacancy, and any below-market leases? What's the average tenancy length?
- What capital expenditures (roof, boiler, parking lot, exteriors) have been made in the last 5 years, and what's planned in the next 2?
- Built in 1885 — when were the roof, HVAC, electrical panel, plumbing, and water heater last replaced?
- Why hasn't it sold? Are there any deal-killer items the seller is aware of (foundation, flood, title, zoning, code violations)?
- Is there a deadline driving the sale (1031 exchange, divorce, estate, relocation)? That informs how much negotiation room exists.
- What's the average days-on-market for RENTAL listings here right now (not sales)? A rising rental-DOM trend means longer vacancies and softer asking-rent achievability than the comps imply.
- What's the recent tenant-quality profile in this submarket — average credit score on applications, eviction rate, late-payment / NSF rate, and stable-employment percentage? A property-management company in the area should have these aggregated.
- How much new apartment / multifamily construction is in the pipeline within 1–3 miles? Heavy new supply (>2% of stock underway) typically softens rents 12–24 months out; light construction supports rent growth.
Investment metrics
- 1% rule
- 1.26% ✓
- Cap rate
- 10.60%
- Cash-on-cash
- 15.39%
- DSCR
- 1.68
- GRM
- 6.6
CMA / ARV
- ARV (median comp)
- $297,702
- List price
- $249,900
- Delta
- -16.06%
- Verdict
- UNDERPRICED
- Comps
- 20 within 1.0 mi
Show comp detail 1 sale within ~0.75 mi
| Address | Dist | Beds/Ba | Sqft | Sold | Price | $/sf | Match |
|---|---|---|---|---|---|---|---|
| 2112-2114 Russell Blvd | 0.34mi | 6/5.0 | 2,400 (+10%) | 8mo | $290,000 | $121 | 48 |
Match score weights: distance 35% · size 25% · config 20% · recency 20%. Top-matched comps best support the ARV.
Projected returns pro-forma
-3.0% appreciation · 7.52% rent growth · sell at horizon
- IRR
- 10.9%
- Equity multiple
- 1.45×
- Total profit
- $31,619
- Equity at exit
- $37,261
- IRR
- 23.2%
- Equity multiple
- 3.41×
- Total profit
- $168,588
- Equity at exit
- $21,607
Cash invested: $69,972 (down + closing). Projections, not guarantees.
Landlord ↔ Tenant lean methodology
- Overall (STATE)
- 81 Strongly Landlord-Friendly
- State Missouri
- 81 Strongly Landlord-Friendly · R+10
- County
- — inherits STATE
- City
- — inherits STATE
ZIP-level market 63104
- Rents YoY
- 7.5%
- Active inventory
- 165
- Price-to-rent
- 13.2×
Monthly cashflow live
- Estimated rent
- $3,156 high interval (Pro) →
- Mortgage (P&I)
- −$1,311
- Tax from tax record
- −$181 /mo · $2,178/yr
- Insurance
- −$104
- HOA
- −$0
- Vacancy / Maint / Mgmt
- −$663
- Net cashflow
- $897
Break-even live
2-unit breakdown (identical units grouped — click to expand)
| Units | Beds | Baths | Est. rent |
|---|---|---|---|
| 2× units | 3 | 2 | $3,156 |
| #1 | 3 | 2 | $1,578 |
| #2 | 3 | 2 | $1,578 |
| Total (2 units) | $3,156 | ||
UW: 25.0% down · 7.5% · 30yr · 1.5% tax · 5.0% vac · 8.0% maint · 8.0% mgmt
Financing live
Cash to close
- Down payment
- $62,475
- Closing costs
- $7,497
- Reserves months
- —
- Total cash needed
- —
Loan-product check · same deal, 3 products live
Conventional
25% down · 7.5% · 30yr
- Down + closing
- —
- Monthly P&I
- —
- Monthly cashflow
- —
- DSCR
- —
- Eligible?
- —
Personal DTI + credit; lowest rate.
DSCR
20% down · 8.5% · 30yr
- Down + closing
- —
- Monthly P&I
- —
- Monthly cashflow
- —
- DSCR
- —
- Eligible?
- —
No personal income docs; deal must DSCR.
Hard money
10% down · 12.0% · 12mo
- Down + closing
- —
- Monthly P&I
- —
- Monthly cashflow
- —
- DSCR
- —
- Eligible?
- —
Short-term bridge; refi at stabilization.
Rent comps 1 comps
| Address | Beds | Baths | Sqft | Rent | $/sqft | DOM | Units | Dist |
|---|---|---|---|---|---|---|---|---|
| 715 Soulard St Saint Louis, MO | 5.0 | 3.0 | 2800 | $2,595 | $0.93 | 43d | 1 | 1.18mi |
Listing history 33 events
-
2026-04-27historical $1,110
-
2026-04-24price $249,900 1221-char remark
Show marketing remark (1221 chars)
Fantastic investment opportunity in the heart of Fox Park! This spacious duplex offers two large units, each with a bonus room and strong rental upside. The second-floor unit features 2 bedrooms, 1 bathroom, and a versatile bonus space perfect for an office or extra storage. The first-floor unit is a 1 bed / 1 bath with its own bonus room and generous room sizes throughout. Several major mechanical updates have already been completed, including a newer sewer lateral, updated water heaters, and a newer sump pump, reducing future maintenance costs for the next owner. The 2nd floor unit is rented month-to-month at a below-market rate of $973, offering immediate value-add potential. The 1st floor unit is currently being marketed at $1,100/month, aligning with neighborhood rent comps. Located in one of St. Louis’ most desirable historic neighborhoods, this property offers excellent long-term appreciation potential and steady cash flow. Whether you’re expanding your portfolio or looking for a solid first investment, this Fox Park duplex offers size, location, updated systems, and income growth opportunities — a strong addition for any investor. Be sure to check out our video walk through.
-
2026-03-19price $253,000 1221-char remark
Show marketing remark (1221 chars)
Fantastic investment opportunity in the heart of Fox Park! This spacious duplex offers two large units, each with a bonus room and strong rental upside. The second-floor unit features 2 bedrooms, 1 bathroom, and a versatile bonus space perfect for an office or extra storage. The first-floor unit is a 1 bed / 1 bath with its own bonus room and generous room sizes throughout. Several major mechanical updates have already been completed, including a newer sewer lateral, updated water heaters, and a newer sump pump, reducing future maintenance costs for the next owner. The 2nd floor unit is rented month-to-month at a below-market rate of $973, offering immediate value-add potential. The 1st floor unit is currently being marketed at $1,100/month, aligning with neighborhood rent comps. Located in one of St. Louis’ most desirable historic neighborhoods, this property offers excellent long-term appreciation potential and steady cash flow. Whether you’re expanding your portfolio or looking for a solid first investment, this Fox Park duplex offers size, location, updated systems, and income growth opportunities — a strong addition for any investor. Be sure to check out our video walk through.
-
2026-02-11price $263,000 1221-char remark
Show marketing remark (1221 chars)
Fantastic investment opportunity in the heart of Fox Park! This spacious duplex offers two large units, each with a bonus room and strong rental upside. The second-floor unit features 2 bedrooms, 1 bathroom, and a versatile bonus space perfect for an office or extra storage. The first-floor unit is a 1 bed / 1 bath with its own bonus room and generous room sizes throughout. Several major mechanical updates have already been completed, including a newer sewer lateral, updated water heaters, and a newer sump pump, reducing future maintenance costs for the next owner. The 2nd floor unit is rented month-to-month at a below-market rate of $973, offering immediate value-add potential. The 1st floor unit is currently being marketed at $1,100/month, aligning with neighborhood rent comps. Located in one of St. Louis’ most desirable historic neighborhoods, this property offers excellent long-term appreciation potential and steady cash flow. Whether you’re expanding your portfolio or looking for a solid first investment, this Fox Park duplex offers size, location, updated systems, and income growth opportunities — a strong addition for any investor. Be sure to check out our video walk through.
-
2026-01-06price $264,000 1221-char remark
Show marketing remark (1221 chars)
Fantastic investment opportunity in the heart of Fox Park! This spacious duplex offers two large units, each with a bonus room and strong rental upside. The second-floor unit features 2 bedrooms, 1 bathroom, and a versatile bonus space perfect for an office or extra storage. The first-floor unit is a 1 bed / 1 bath with its own bonus room and generous room sizes throughout. Several major mechanical updates have already been completed, including a newer sewer lateral, updated water heaters, and a newer sump pump, reducing future maintenance costs for the next owner. The 2nd floor unit is rented month-to-month at a below-market rate of $973, offering immediate value-add potential. The 1st floor unit is currently being marketed at $1,100/month, aligning with neighborhood rent comps. Located in one of St. Louis’ most desirable historic neighborhoods, this property offers excellent long-term appreciation potential and steady cash flow. Whether you’re expanding your portfolio or looking for a solid first investment, this Fox Park duplex offers size, location, updated systems, and income growth opportunities — a strong addition for any investor. Be sure to check out our video walk through.
-
2025-12-09$265,000 Active 1221-char remark
Show marketing remark (1221 chars)
Fantastic investment opportunity in the heart of Fox Park! This spacious duplex offers two large units, each with a bonus room and strong rental upside. The second-floor unit features 2 bedrooms, 1 bathroom, and a versatile bonus space perfect for an office or extra storage. The first-floor unit is a 1 bed / 1 bath with its own bonus room and generous room sizes throughout. Several major mechanical updates have already been completed, including a newer sewer lateral, updated water heaters, and a newer sump pump, reducing future maintenance costs for the next owner. The 2nd floor unit is rented month-to-month at a below-market rate of $973, offering immediate value-add potential. The 1st floor unit is currently being marketed at $1,100/month, aligning with neighborhood rent comps. Located in one of St. Louis’ most desirable historic neighborhoods, this property offers excellent long-term appreciation potential and steady cash flow. Whether you’re expanding your portfolio or looking for a solid first investment, this Fox Park duplex offers size, location, updated systems, and income growth opportunities — a strong addition for any investor. Be sure to check out our video walk through.
-
2025-11-12$1,110
-
2025-10-17historical $1,110
-
2025-09-11price $1,110
-
2025-08-13$1,150
-
2019-11-19soldstatus $160,000
-
2019-11-14soldstatus Closed 885-char remark
Show marketing remark (885 chars)
This recently renovated two-family building on a secluded street in the historic Fox Park District is perfect for owner-occupants or investors. Upstairs tenant pays $775/mo with lease through July 31, 2020. Previous downstairs tenant paid $650/mo prior to recent reno, but unit was left vacant for showings. Renovations include new granite counter tops, new kitchen faucets and sinks, new energy efficient white TPO roof July 2017 (w/10 yr transferable warranty), new windows throughout (including 8 permitted historic windows) Mar 2019, fresh paint, some updated appliances, new lighting, and new laundry hookups for each unit in basement. Low-maintenance tile and laminate flooring in both units. All appliances included in sale. Large fenced back yard and recently landscaped front yard. Property to be sold as-is. Please use Special Sales Contract. Do not disturb upstairs tenants.
-
2019-10-04status Pending 885-char remark
Show marketing remark (885 chars)
This recently renovated two-family building on a secluded street in the historic Fox Park District is perfect for owner-occupants or investors. Upstairs tenant pays $775/mo with lease through July 31, 2020. Previous downstairs tenant paid $650/mo prior to recent reno, but unit was left vacant for showings. Renovations include new granite counter tops, new kitchen faucets and sinks, new energy efficient white TPO roof July 2017 (w/10 yr transferable warranty), new windows throughout (including 8 permitted historic windows) Mar 2019, fresh paint, some updated appliances, new lighting, and new laundry hookups for each unit in basement. Low-maintenance tile and laminate flooring in both units. All appliances included in sale. Large fenced back yard and recently landscaped front yard. Property to be sold as-is. Please use Special Sales Contract. Do not disturb upstairs tenants.
-
2019-10-02$168,900 Active 885-char remark
Show marketing remark (885 chars)
This recently renovated two-family building on a secluded street in the historic Fox Park District is perfect for owner-occupants or investors. Upstairs tenant pays $775/mo with lease through July 31, 2020. Previous downstairs tenant paid $650/mo prior to recent reno, but unit was left vacant for showings. Renovations include new granite counter tops, new kitchen faucets and sinks, new energy efficient white TPO roof July 2017 (w/10 yr transferable warranty), new windows throughout (including 8 permitted historic windows) Mar 2019, fresh paint, some updated appliances, new lighting, and new laundry hookups for each unit in basement. Low-maintenance tile and laminate flooring in both units. All appliances included in sale. Large fenced back yard and recently landscaped front yard. Property to be sold as-is. Please use Special Sales Contract. Do not disturb upstairs tenants.
-
2017-01-05soldstatus Closed
-
2017-01-02status Pending
-
2016-12-05historical Contingent (No Kickout)
-
2016-11-25price $79,900
-
2016-11-23price $99,900
-
2016-11-23status Active
-
2016-10-27historical Active Under Contract
-
2016-10-15status Active
-
2016-10-08historical
-
2016-10-07$79,900 Active
-
2016-06-28soldstatus $31,250
-
2016-06-28soldstatus $35,250
-
2011-02-03soldstatus
-
2007-11-19soldstatus
-
2001-09-17soldstatus
-
2001-01-18soldstatus $32,000
-
2000-11-06soldstatus
-
1998-06-22soldstatus
-
1998-04-20soldstatus
ⓘ Source: listings_history table (triggers on properties + properties_extension) + one-shot
backfill from property_details.listing_events for pre-trigger history.
Tax reassessment forecast MO · Resets to sale price
- Current annual tax
- $2,178 · $181/mo
- Projected year-2 tax
- $2,424 · $202/mo
- Expected delta
- +$246/yr (+$21/mo · 11.3%)
ⓘ Screening estimate from a state-policy table — verify with the county assessor before closing.
Climate risk First Street
- Flood 4/10 Moderate FEMA zone X (unshaded) · 21% chance over 30 yrs
- Wildfire 1/10 Low
- Heat 5/10 Major 7 d/yr ≥109°F today · 21 d/yr by 30 yrs out
- Wind 2/10 Low 100% chance of damaging wind over 30 yrs
- Air quality 3/10 Moderate 3 unhealthy d/yr today · 4 by 30 yrs out
Nearby sold comps map
Loading sold comps map…
Walkable amenities ~0.75 mi
Loading nearby amenities…
Taxation est. · year 1
- Rental income
- $37,872
- − Mortgage interest
- −$13,998
- − Property taxes
- −$2,178
- − Insurance
- −$1,250
- − Repairs & maintenance
- −$3,030
- − Management
- −$3,030
- − Depreciation
- −$7,270
- Taxable income
- $7,117
- Est. tax owed @ 24.0%
- −$1,708
- After-tax cash flow
- $9,058/yr
For passive investors: Depreciation is non-cash, so a rental often shows a tax loss while cash-flowing — sheltering income. Rental losses are passive: they offset passive income freely, and up to $25,000/yr can offset ordinary (W-2) income if you actively participate and your MAGI is under $100k (phasing out to $0 by $150k); unused losses carry forward. On sale, claimed depreciation is recaptured at up to 25%, and gains may owe capital-gains tax (a 1031 exchange can defer both). Figures are a year-1 estimate at your 24.0% rate — not tax advice; consult a CPA.
Schools (NCES district)
- District
- St. Louis City
- NCES district ID
- 2929280
- Math proficiency
- 10% ▼ -6.00%
- Reading proficiency
- 18% ▼ -3.00%
- Median HH income
- $35,685
- Composite
- 11.54/100
- National rank
- #9699
- State rank
- #312 of 324 in MO
Livability — St. Louis
No livability data for this city. (Only ~50 U.S. cities are tracked.)
Census & demographics
- Census place
- St. Louis, MO
- County
- Saint Louis City · 254,015 people
- City population
- 283,259
- Metro
- St. Louis, MO-IL
- Population (ZIP)
- 19,007
- Household income
- $68,764
- Rent vs Own
- Severe rent burden
- 1429.0
Population outlook (St. Louis County) Hauer SSP2
- Today (2025)
- 315,737 people
- By 2030
- 313,865 · -0.6%
- By 2040
- 305,439 · -3.3%
- By 2050
- 296,529 · -6.1%
- By 2075
- 271,028 · -14.2%
- By 2100
- 255,359 · -19.1%
Race, ethnicity, and origin ACS 2023
- Neighborhood character
- Diverse neighborhood (Simpson 0.60)
- Race & ethnicity
- White 51% Black 37% Two or more races 6% Hispanic / Latino 4% Asian 2%
- Common ancestry
- Romanian 3% Lithuanian 3% Slovak 2%
- Foreign-born
- 5% · Canada
- Languages at home
- 93% English-only · Other Indo-European 2% Spanish 1% German/W. Germanic 1%
Political lean MEDSL · St. Louis
- 2024 margin
- Solid D (+64.7) · D 81.4% · R 16.7% · Other 2.0%
- 2008→2024 swing
- -3.5pp toward R · 2008: 68.2pp · 2024: 64.7pp
- All cycles
- 2024: D+64.7 2020: D+66.2 2016: D+63.7 2012: D+66.6 2008: D+68.2
Not yet ingested
- Civics
- —
Market trends
- HPI YoY
- ▼ -159.69%
- Current HPI
- 252.3452
- Rent YoY
- ▲ 7.52%
- Metro
- St. Louis, MO-IL
- State GDP YoY
- ▲ 1.84%
- F500 in state
- 20
Industry mix (Fortune 500 HQ in MO)
| Industry | F500 HQs | Revenue |
|---|---|---|
| Healthcare | 1 | $163B |
|
||
| Insurance | 1 | $21B |
|
||
| Industrial Technology | 1 | $17B |
|
||
| Retail | 1 | $16B |
|
||
| Industrial Distribution | 1 | $10B |
|
||
| Utilities | 1 | $9B |
|
||
Price history
-96.5% since first listed33 events — show timeline
- 2026-04-27 Rental Removed $1,110 SHOWMOJO
- 2026-04-24 Price Changed $249,900 MARIS as Distributed by MLS Grid
- 2026-03-19 Price Changed $253,000 MARIS as Distributed by MLS Grid
- 2026-02-11 Price Changed $263,000 MARIS as Distributed by MLS Grid
- 2026-01-06 Price Changed $264,000 MARIS as Distributed by MLS Grid
- 2025-12-09 Listed $265,000 MARIS as Distributed by MLS Grid
- 2025-11-12 Listed for Rent $1,110 SHOWMOJO
- 2025-10-17 Rental Removed $1,110 SHOWMOJO
- 2025-09-11 Price Changed $1,110 SHOWMOJO
- 2025-08-13 Listed for Rent $1,150 SHOWMOJO
- 2019-11-19 Sold (Public Records) $160,000 Public Records
- 2019-11-14 Sold (MLS) — MARIS as Distributed by MLS Grid
- 2019-10-04 Pending — MARIS as Distributed by MLS Grid
- 2019-10-02 Listed $168,900 MARIS as Distributed by MLS Grid
- 2017-01-05 Sold (MLS) — MARIS as Distributed by MLS Grid
- 2017-01-02 Pending — MARIS as Distributed by MLS Grid
- 2016-12-05 Contingent — MARIS as Distributed by MLS Grid
- 2016-11-25 Price Changed $79,900 MARIS as Distributed by MLS Grid
- 2016-11-23 Price Changed $99,900 MARIS as Distributed by MLS Grid
- 2016-11-23 Relisted — MARIS as Distributed by MLS Grid
- 2016-10-27 Contingent — MARIS as Distributed by MLS Grid
- 2016-10-15 Relisted — MARIS as Distributed by MLS Grid
- 2016-10-08 Delisted — MARIS as Distributed by MLS Grid
- 2016-10-07 Listed $79,900 MARIS as Distributed by MLS Grid
- 2016-06-28 Sold (Public Records) $35,250 Public Records
- 2016-06-28 Sold (Public Records) $31,250 Public Records
- 2011-02-03 Sold (Public Records) — Public Records
- 2007-11-19 Sold (Public Records) — Public Records
- 2001-09-17 Sold (Public Records) — Public Records
- 2001-01-18 Sold (Public Records) $32,000 Public Records
- 2000-11-06 Sold (Public Records) — Public Records
- 1998-06-22 Sold (Public Records) — Public Records
- 1998-04-20 Sold (Public Records) — Public Records
Property tax history
+9.3%/yrLatest (2024): $2,178 · +5.1% YoY. Source: county tax records.
Cash-flow waterfall
monthlySold comps — $/sqft
last 12 mo · ≤1 miLoading sold comps…