12063 La Cuchilla · San Antonio, TX
Flood risk No data
- FEMA flood zone
- —
- Chance of flooding over 30 yrs
- —
- Est. flood insurance / yr
- —
Fire risk No data
- Est. fire insurance / yr
- —
Heat risk No data
- Hot days now (above threshold)
- —
- Hot days in 30 yrs
- —
Wind risk No data
- Chance of severe wind over 30 yrs
- —
Air-quality risk No data
- Unhealthy air days now
- —
- Unhealthy air days in 30 yrs
- —
Risk factors via First Street. Map © Google.
Why this score? — see what drove the D+ grade
The composite is a weighted blend of 9 inputs, each scored 0–100. Each bar is that input's sub-score; the figure is the points it added to the 100-point composite (weight × sub-score).
- ARV discount +15.0/15.0
- Cash flow +12.0/30.0
- Condition / age +5.0/5.0
- Schools +4.4/10.0
- 1% rule +4.0/10.0
- Livability +4.0/5.0
- DSCR +3.5/10.0
- Rent growth +1.7/5.0
- Appreciation +0.0/10.0
$209,999
🖨 Deal sheet 📄 Offer letter ✓ Due diligence
Listing remarks MLS
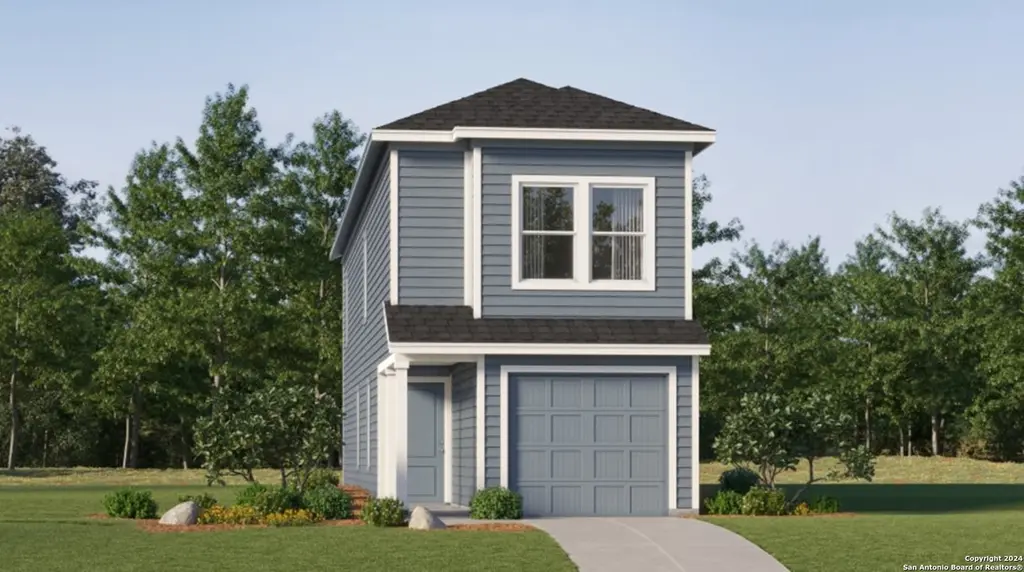
The Cibola - Upon entry of this new two-story home is a well-equipped kitchen, dining area and family room arranged in a desirable open floorplan that promotes seamless transitions between spaces. The second level showcases all four bedrooms to provide restful retreats, including the owner's suite with an adjoining bathroom and walk-in closet. Completing the home is a practical garage for storage space. Estimated Completion June 2026. The completion date, prices and features may vary and are subject to change. Please verify with Lennar directly. Photos are for illustrative purposes only.
Key facts
- 4,791 sq ft lot
- Garage
- Community pool
Neighborhood map
What this means for you Summary
Snapshot
- This is a 4-bed/2.5-bath single-family listed at $210k. Condition is rated excellent.
Deal economics
- At list price, monthly cash flow is $-50 ($-596/yr) — negative.
- To cash-flow at today's rent, offer at most $203k (3.4% below list).
- To meet the 1% rule (rent ≥ 1% of price), the offer needs to be $189k (10.1% below list).
- Recommended offer: $189k (10.1% below list) — sets the bar for 1% rule.
- Cap rate 6.0% vs local median 3.8% in San Antonio — top-decile yield for the area; either an underpriced asset or a hidden risk that comps aren't pricing in. Stress-test before assuming the spread holds.
Location & tenants
- Location reads 80/100 on livability (#31 in TX, #1,616 nationally) — a professional / high-income tenant draw. Strengths: amenities A+, commute A+, cost of living A+; Watch: schools C-, crime F.
- Medina Valley ISD (rural): math 48% / reading 53% proficiency, ranked #148 of 826 in TX (top 18%) — acceptable for families but not a draw, mixed tenant base, ~2y average lease.
- Market conditions: Rents falling (-3.0%/yr); 1133 active listings in the ZIP; 40 comparable units currently listed for rent nearby; rentals at typical pace (median 24d on market — plan ~3-4 weeks tenant-placement turnaround); solid renter incomes; 8,308 units permitted in Bexar County in 2024 (2,506 in 5+ unit buildings).
Forward outlook
- Local home prices are declining (-3.0%/yr); year-one equity from $1k of loan paydown is wiped out by about $6k of value loss. Plan a longer hold.
- Bexar County population projected at +50% by 2050 — long-run rental-demand tailwind backs the buy-and-hold thesis.
Negotiation context
- It's been on market 63 days — a 6% lower offer ($197k) is reasonable based on typical stale-listing flexibility.
Questions for the listing agent
- What do current leases actually rent for vs. the listed asking? Can we see a recent rent roll and the last 12 months of T-12 income?
- It's been on market 63 days. Have you received any prior offers? Is the seller open to a 10% concession, seller financing, or rate buy-down credit?
- What does the HOA fee cover, when was the last increase, and are there any pending special assessments or reserve-fund shortfalls?
- Why hasn't it sold? Are there any deal-killer items the seller is aware of (foundation, flood, title, zoning, code violations)?
- Is there a deadline driving the sale (1031 exchange, divorce, estate, relocation)? That informs how much negotiation room exists.
- Crime grade is F in this area — have there been break-ins, vandalism, or insurance claims at this property in the last 3 years? What carrier currently insures it and at what premium?
- The area grade is low — what's the realistic commute time and amenity access for the typical tenant pool here? Any planned neighborhood developments (good or bad) we should know about?
- What's the average days-on-market for RENTAL listings here right now (not sales)? A rising rental-DOM trend means longer vacancies and softer asking-rent achievability than the comps imply.
- What's the recent tenant-quality profile in this submarket — average credit score on applications, eviction rate, late-payment / NSF rate, and stable-employment percentage? A property-management company in the area should have these aggregated.
- How much new for-sale + rental construction is in the pipeline within 1–3 miles? Heavy new supply typically softens prices + rents 12–24 months out; constrained supply supports both.
Investment metrics
- 1% rule
- 0.90% ✗
- Cap rate
- 6.01%
- Cash-on-cash
- -1.01%
- DSCR
- 0.95
- GRM
- 9.3
CMA / ARV
- ARV (median comp)
- $278,332
- List price
- $209,999
- Delta
- -24.55%
- Verdict
- UNDERPRICED
- Comps
- 20 within 1.0 mi
Show comp detail 12 sales within ~0.75 mi
| Address | Dist | Beds/Ba | Sqft | Sold | Price | $/sf | Match |
|---|---|---|---|---|---|---|---|
| 12125 La Cuchilla | 0.00mi | 4/2.5 | 1,535 (0%) | 2mo | $208,999 | $136 | 99 |
| 12137 La Cuchilla | 0.00mi | 4/2.5 | 1,535 (0%) | 2mo | $209,999 | $137 | 98 |
| 12402 Winding Oak Rdg | 0.10mi | 3/2.0 (-1) | 1,354 (-12%) | 1mo | $210,999 | $156 | 68 |
| 3227 Onion Crk | 0.52mi | 3/2.0 (-1) | 1,540 (+0%) | 2mo | $169,900 | $110 | 66 |
| 3446 Angus Xing | 0.41mi | 3/2.0 (-1) | 1,540 (+0%) | 8mo | $259,999 | $169 | 66 |
| 3443 Stoney Byu | 0.43mi | 3/2.5 (-1) | 1,627 (+6%) | 1mo | $200,900 | $123 | 64 |
| 3219 Davis Trce | 0.70mi | 3/2.0 (-1) | 1,535 (0%) | 3mo | $295,950 | $193 | 58 |
| 3019 Haynie Mesa | 0.66mi | 3/2.0 (-1) | 1,535 (0%) | 6mo | $295,950 | $193 | 57 |
| 3027 Haynie Mesa | 0.66mi | 3/2.0 (-1) | 1,489 (-3%) | 3mo | $298,950 | $201 | 55 |
| 11734 Wentwood Vale | 0.75mi | 4/2.0 | 1,572 (+2%) | 6mo | $282,950 | $180 | 54 |
| 3110 Lamoka Lk | 0.63mi | 3/2.5 (-1) | 1,698 (+11%) | 1mo | $249,900 | $147 | 47 |
| 3026 Haynie Mesa | 0.70mi | 3/2.0 (-1) | 1,651 (+8%) | 2mo | $310,950 | $188 | 46 |
Match score weights: distance 35% · size 25% · config 20% · recency 20%. Top-matched comps best support the ARV.
Projected returns pro-forma
-3.0% appreciation · 0.0% rent growth · sell at horizon
- IRR
- -21.6%
- Equity multiple
- 0.27×
- Total profit
- $-42,639
- Equity at exit
- $31,312
- IRR
- -25.5%
- Equity multiple
- -0.06×
- Total profit
- $-62,243
- Equity at exit
- $18,157
Cash invested: $58,800 (down + closing). Projections, not guarantees.
Landlord ↔ Tenant lean methodology
- Overall (STATE)
- 87 Strongly Landlord-Friendly
- State Texas
- 87 Strongly Landlord-Friendly · R+5
- County
- — inherits STATE
- City
- — inherits STATE
ZIP-level market 78245
- Home prices YoY
- -18.5%
- Rents YoY
- -3.0%
- Active inventory
- 1133
- Price-to-rent
- 9.3×
Monthly cashflow live
- Estimated rent
- $1,888 high interval (Pro) →
- Mortgage (P&I)
- −$1,101
- Tax est. 1.5%
- −$262 /mo · $3,150/yr
- Insurance
- −$87
- HOA
- −$90
- Vacancy / Maint / Mgmt
- −$397
- Net cashflow
- $-50
Break-even live
UW: 25.0% down · 7.5% · 30yr · 1.5% tax · 5.0% vac · 8.0% maint · 8.0% mgmt
Financing live
Cash to close
- Down payment
- $52,500
- Closing costs
- $6,300
- Reserves months
- —
- Total cash needed
- —
Loan-product check · same deal, 3 products live
Conventional
25% down · 7.5% · 30yr
- Down + closing
- —
- Monthly P&I
- —
- Monthly cashflow
- —
- DSCR
- —
- Eligible?
- —
Personal DTI + credit; lowest rate.
DSCR
20% down · 8.5% · 30yr
- Down + closing
- —
- Monthly P&I
- —
- Monthly cashflow
- —
- DSCR
- —
- Eligible?
- —
No personal income docs; deal must DSCR.
Hard money
10% down · 12.0% · 12mo
- Down + closing
- —
- Monthly P&I
- —
- Monthly cashflow
- —
- DSCR
- —
- Eligible?
- —
Short-term bridge; refi at stabilization.
Rent comps 40 comps
| Address | Beds | Baths | Sqft | Rent | $/sqft | DOM | Units | Dist |
|---|---|---|---|---|---|---|---|---|
| 12141 Pease Riv San Antonio, TX | 3.0 | 2.0 | 1396 | $1,595 | $1.14 | 3d | 1 | 0.26mi |
| 12126 Sampson Crk San Antonio, TX | 3.0 | 2.0 | 1489 | $1,895 | $1.27 | 24d | 1 | 0.27mi |
| 12118 Pease Riv San Antonio, TX | 3.0 | 2.0 | 1540 | $1,850 | $1.20 | 12d | 1 | 0.31mi |
| 12010 Mulberry Crk Unit NA San Antonio, TX | 3.0 | 2.0 | 1296 | $1,850 | $1.43 | 15d | 1 | 0.49mi |
| 3127 Keuka Park Dr San Antonio, TX | 3.0 | 2.5 | 1698 | $1,950 | $1.15 | 24d | 1 | 0.53mi |
| 3232 Onion Crk San Antonio, TX | 3.0 | 2.0 | 1168 | $1,495 | $1.28 | 44d | 1 | 0.55mi |
| 11902 Mulberry Crk San Antonio, TX | 3.0 | 2.0 | 1413 | $1,647 | $1.17 | 44d | 1 | 0.56mi |
| 3111 Lamoka Lk San Antonio, TX | 3.0 | 3.0 | 1508 | $1,600 | $1.06 | 2d | 1 | 0.59mi |
| 3111 Lamoka Lk San Antonio, TX | 3.0 | 2.5 | 1509 | $1,600 | $1.06 | 44d | 1 | 0.59mi |
| 3303 Mission Riv San Antonio, TX | 3.0 | 2.0 | 1489 | $1,850 | $1.24 | 44d | 1 | 0.59mi |
| 2840 Tengyc Bow San Antonio, TX | 4.0 | 2.0 | 1704 | $1,775 | $1.04 | 44d | 1 | 0.75mi |
| 14618 Fowler Rdg San Antonio, TX | 3.0 | 2.0 | 1266 | $1,776 | $1.40 | 15d | 1 | 0.83mi |
| 11718 Classmore Gap San Antonio, TX | 3.0 | 2.0 | 1918 | $2,100 | $1.09 | 3d | 1 | 0.88mi |
| 11623 Blackmore Leap San Antonio, TX | 4.0 | 2.5 | 2106 | $1,900 | $0.90 | 24d | 1 | 0.89mi |
| 4715 Corona Australis San Antonio, TX | 3.0 | 2.5 | 2081 | $1,950 | $0.94 | 44d | 1 | 0.95mi |
| 11513 Thackery Haze San Antonio, TX | 4.0 | 2.5 | 2223 | $1,850 | $0.83 | 18d | 1 | 0.96mi |
| 4615 Serpens San Antonio, TX | 3.0 | 2.5 | 1747 | $1,800 | $1.03 | 24d | 1 | 0.97mi |
| 3011 Lindenwood Way San Antonio, TX | 3.0 | 2.5 | 1700 | $1,955 | $1.15 | 24d | 1 | 0.99mi |
| 2917 Wentwood Run San Antonio, TX | 4.0 | 2.0 | 1650 | $1,825 | $1.11 | 16d | 1 | 1.06mi |
| 12879 Cygnus San Antonio, TX | 4.0 | 2.5 | 2121 | $2,150 | $1.01 | 22d | 1 | 1.07mi |
| 12879 Cygnus San Antonio, TX | 4.0 | 2.5 | 2120 | $2,150 | $1.01 | 44d | 1 | 1.07mi |
| 12528 Corona Borealis San Antonio, TX | 3.0 | 2.5 | 2058 | $1,795 | $0.87 | 24d | 1 | 1.08mi |
| 4931 Jovian San Antonio, TX | 3.0 | 2.5 | 2058 | $1,795 | $0.87 | 24d | 1 | 1.09mi |
| 12627 Corona Borealis San Antonio, TX | 3.0 | 2.0 | 1408 | $1,680 | $1.19 | 44d | 1 | 1.10mi |
| 2922 Wentwood Run San Antonio, TX | 3.0 | 2.5 | 2241 | $2,100 | $0.94 | 24d | 1 | 1.10mi |
| 12510 Galatea San Antonio, TX | 3.0 | 2.0 | 1212 | $1,575 | $1.30 | 18d | 1 | 1.12mi |
| 5010 Jovian San Antonio, TX | 3.0 | 2.0 | 1536 | $2,100 | $1.37 | 4d | 1 | 1.12mi |
| 12507 Antilia San Antonio, TX | 3.0 | 3.0 | 2060 | $2,200 | $1.07 | 44d | 1 | 1.13mi |
| 12515 Antilia San Antonio, TX | 3.0 | 2.0 | 1405 | $1,800 | $1.28 | 11d | 1 | 1.15mi |
| 13078 Cygnus San Antonio, TX | 4.0 | 1.0–3.0 | 1656 | $2,014 | $1.22 | 2d | 8 | 1.16mi |
| 11806 Black Rose San Antonio, TX | 4.0 | 2.5 | 2100 | $2,150 | $1.02 | 44d | 1 | 1.16mi |
| 12603 Antilia San Antonio, TX | 3.0 | 2.5 | 2058 | $1,795 | $0.87 | 4d | 1 | 1.17mi |
| 11556 Mustang Grv San Antonio, TX | 3.0 | 2.0 | 1929 | $2,150 | $1.11 | 20d | 1 | 1.17mi |
| 11727 Black Rose San Antonio, TX | 3.0 | 2.0 | 1316 | $1,650 | $1.25 | 44d | 1 | 1.18mi |
| 11348 Top Hat San Antonio, TX | 3.0 | 2.0 | 1658 | $1,775 | $1.07 | 44d | 1 | 1.19mi |
| 11806 Red Pheasant San Antonio, TX | 3.0 | 2.0 | 1252 | $1,550 | $1.24 | 4d | 1 | 1.20mi |
| 11752 Red Pheasant San Antonio, TX | 3.0 | 2.0 | 1246 | $1,595 | $1.28 | 24d | 1 | 1.22mi |
| 11732 Red Pheasant San Antonio, TX | 3.0 | 2.5 | 1780 | $1,795 | $1.01 | 24d | 1 | 1.24mi |
| 11328 Silver Rose San Antonio, TX | 3.0 | 2.0 | 1691 | $1,870 | $1.11 | 44d | 1 | 1.25mi |
| 11323 Simply Spot San Antonio, TX | 4.0 | 2.5 | 2240 | $2,200 | $0.98 | 3d | 1 | 1.26mi |
HOA detail
- Monthly dues
- $90 · $1,080/yr
Listing history 15 events
-
2026-06-18days on market $209,999 Active 63 DOM
-
2026-06-17days on market $209,999 Active 62 DOM
-
2026-06-16days on market $209,999 Active 61 DOM
-
2026-06-15days on market $209,999 Active 60 DOM
-
2026-06-13days on market $209,999 Active 58 DOM
-
2026-06-09days on market $209,999 Active 54 DOM
-
2026-06-08days on market $209,999 Active 53 DOM
-
2026-06-07days on market $209,999 Active 52 DOM
-
2026-06-04days on market $209,999 Active 49 DOM
-
2026-06-03days on market $209,999 Active 48 DOM
-
2026-06-02days on market $209,999 Active 47 DOM
-
2026-06-02days on market $209,999 Active 46 DOM
-
2026-05-31days on market $209,999 Active 45 DOM
-
2026-04-30price $209,999 594-char remark
Show marketing remark (594 chars)
The Cibola - Upon entry of this new two-story home is a well-equipped kitchen, dining area and family room arranged in a desirable open floorplan that promotes seamless transitions between spaces. The second level showcases all four bedrooms to provide restful retreats, including the owner's suite with an adjoining bathroom and walk-in closet. Completing the home is a practical garage for storage space. Estimated Completion June 2026. The completion date, prices and features may vary and are subject to change. Please verify with Lennar directly. Photos are for illustrative purposes only.
-
2026-04-16$210,999 New 594-char remark
Show marketing remark (594 chars)
The Cibola - Upon entry of this new two-story home is a well-equipped kitchen, dining area and family room arranged in a desirable open floorplan that promotes seamless transitions between spaces. The second level showcases all four bedrooms to provide restful retreats, including the owner's suite with an adjoining bathroom and walk-in closet. Completing the home is a practical garage for storage space. Estimated Completion June 2026. The completion date, prices and features may vary and are subject to change. Please verify with Lennar directly. Photos are for illustrative purposes only.
ⓘ Source: listings_history table (triggers on properties + properties_extension) + one-shot
backfill from property_details.listing_events for pre-trigger history.
Nearby sold comps map
Loading sold comps map…
Walkable amenities ~0.75 mi
Loading nearby amenities…
Taxation est. · year 1
- Rental income
- $22,658
- − Mortgage interest
- −$11,763
- − Property taxes
- −$3,150
- − Insurance
- −$1,050
- − Repairs & maintenance
- −$1,813
- − Management
- −$1,813
- − HOA
- −$1,080
- − Depreciation
- −$6,109
- Taxable loss
- −$4,120
- Est. tax savings @ 24.0%
- +$989
- After-tax cash flow
- $393/yr
For passive investors: Depreciation is non-cash, so a rental often shows a tax loss while cash-flowing — sheltering income. Rental losses are passive: they offset passive income freely, and up to $25,000/yr can offset ordinary (W-2) income if you actively participate and your MAGI is under $100k (phasing out to $0 by $150k); unused losses carry forward. On sale, claimed depreciation is recaptured at up to 25%, and gains may owe capital-gains tax (a 1031 exchange can defer both). Figures are a year-1 estimate at your 24.0% rate — not tax advice; consult a CPA.
Condition & rehab AI · 6 photos
This new two-story home is move-in ready with excellent condition and modern features, offering a high return on investment for both resale and rental markets.
Value-add opportunities
- Both Painting the exterior and interior walls — Fresh paint enhances curb appeal and interior aesthetics.
- Both Landscaping improvements — Enhanced landscaping can increase both resale and rental value.
- Both Adding smart home features — Modern technology can increase both resale and rental appeal.
- Both Upgrading the kitchen appliances — Modern appliances can increase both resale and rental value.
- Both Adding a smart thermostat — Energy-efficient systems can increase both resale and rental value.
Renovation cost estimate screening
Value-add ROI direction
- Both Painting the exterior and interior walls — Fresh paint enhances curb appeal and interior aesthetics. ↑
- Both Landscaping improvements — Enhanced landscaping can increase both resale and rental value. ↑
- Both Adding smart home features — Modern technology can increase both resale and rental appeal. ↑
- Both Upgrading the kitchen appliances — Modern appliances can increase both resale and rental value. ↑
- Both Adding a smart thermostat — Energy-efficient systems can increase both resale and rental value. ↑
ⓘ Cost ranges are severity-bucket heuristics (US national rule-of-thumb). Get contractor quotes + a written scope before underwriting a rehab budget.
Schools (NCES district)
- District
- Medina Valley ISD
- NCES district ID
- 4830060
- Math proficiency
- 48% ▼ -9.00%
- Reading proficiency
- 53% ▼ -2.00%
- Median HH income
- $60,596
- Composite
- 44.2/100
- National rank
- #2851
- State rank
- #148 of 826 in TX
Livability — San Antonio
- Score
- 80/100
- State rank
- #31
- US rank
- #1616
Category grades
Schools grade is shown separately in the Schools card above.
Census & demographics
- County
- Bexar County · 1,990,555 people
- City population
- 1,806,925
- Metro
- San Antonio-New Braunfels, TX
- Population (ZIP)
- 96,015
- Household income
- $90,029
- Rent vs Own
- Severe rent burden
- 2466.0
Population outlook (Bexar County) Hauer SSP2
- Today (2025)
- 2,336,851 people
- By 2030
- 2,560,728 · +9.6%
- By 2040
- 3,020,569 · +29.3%
- By 2050
- 3,493,522 · +49.5%
- By 2075
- 4,668,459 · +99.8%
- By 2100
- 5,533,242 · +136.8%
Race, ethnicity, and origin ACS 2023
- Neighborhood character
- Majority Hispanic (64%)
- Race & ethnicity
- Hispanic / Latino 64% Two or more races 27% White 20% Black 9% Asian 2%
- Hispanic origin (detail)
- Mexican 53% Puerto Rican 2%
- Common ancestry
- Slovak 1% Lithuanian 1% Romanian 1%
- Foreign-born
- 9% · Canada, Vietnam
- Languages at home
- 66% English-only · Spanish 30% Arabic 1% Tagalog/Filipino 1%
Political lean MEDSL · Bexar
- 2024 margin
- Lean D (+9.8) · D 54.3% · R 44.6% · Other 1.1%
- 2008→2024 swing
- +4.2pp toward D · 2008: 5.6pp · 2024: 9.8pp
- All cycles
- 2024: D+9.8 2020: D+18.2 2016: D+13.5 2012: D+4.6 2008: D+5.6
Not yet ingested
- Civics
- —
Market trends
- HPI YoY
- ▼ -53.31%
- Current HPI
- 234.7931
- Rent YoY
- ▼ -3.02%
- Metro
- San Antonio-New Braunfels, TX
- State GDP YoY
- ▲ 3.95%
- F500 in state
- 110
Industry mix (Fortune 500 HQ in TX)
| Industry | F500 HQs | Revenue |
|---|---|---|
| Energy | 16 | $1,198B |
|
||
| Technology | 5 | $198B |
|
||
| Engineering / Construction | 4 | $72B |
|
||
| Energy Services | 3 | $60B |
|
||
| Utilities | 3 | $41B |
|
||
| Healthcare | 2 | $330B |
|
||
Price history
-0.5% since first listed2 events — show timeline
- 2026-04-30 Price Changed $209,999 LERA
- 2026-04-16 Listed $210,999 LERA
Cash-flow waterfall
monthlySold comps — $/sqft
last 12 mo · ≤1 miLoading sold comps…