 🏗️ New Construction
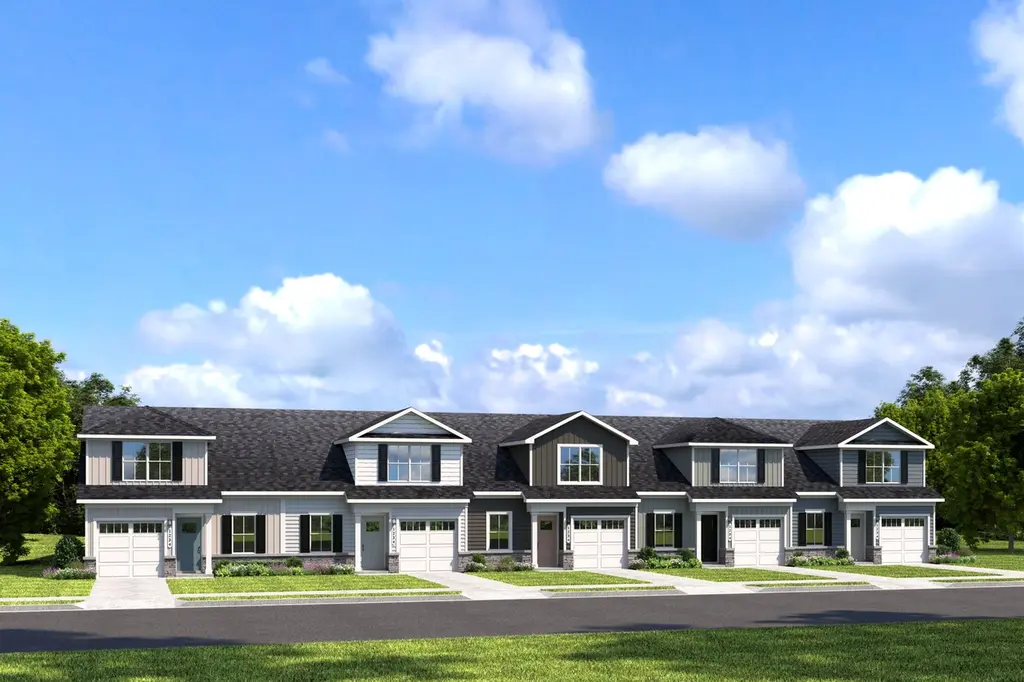
Dunmore Plan · Bridgeville, DE
Flood risk No data
- FEMA flood zone
- —
- Chance of flooding over 30 yrs
- —
- Est. flood insurance / yr
- —
Fire risk No data
- Est. fire insurance / yr
- —
Heat risk No data
- Hot days now (above threshold)
- —
- Hot days in 30 yrs
- —
Wind risk No data
- Chance of severe wind over 30 yrs
- —
Air-quality risk No data
- Unhealthy air days now
- —
- Unhealthy air days in 30 yrs
- —
Risk factors via First Street. Map © Google.
Why this score? — see what drove the D- grade
The composite is a weighted blend of 9 inputs, each scored 0–100. Each bar is that input's sub-score; the figure is the points it added to the 100-point composite (weight × sub-score).
- Cash flow +8.1/30.0
- ARV discount +7.5/15.0
- Appreciation +5.6/10.0
- Condition / age +4.8/5.0
- Livability +3.2/5.0
- 1% rule +2.5/10.0
- Rent growth +2.5/5.0
- DSCR +2.2/10.0
- Schools +2.2/10.0
$259,990
🖨 Deal sheet (PDF) 📄 Offer letter ✓ Due diligence
Listing remarks
The Dunmore blends modern comfort with effortless main-level living, making it an ideal choice for those ready to enjoy a low-maintenance lifestyle. Enter through the attached one-car garage and be welcomed into an open-concept gourmet kitchen, where stylish cabinetry and a generous center island overlook the bright great room. Luxury vinyl plank flooring unifies the main living spaces, creating the perfect setting for everyday living or entertaining guests, whether indoors or out on the rear patio. Designed with convenience in mind, the first floor features a serene owner's suite complete with an en suite bath and spacious walk-in closet. A highly sought-after second bedroom on the main le
Key facts
- Main level living
- Walk-in closet
- Second bedroom
Tags
Property features AI
Finance
- Other: Listing status: Active; Plan inventory type
- Financial info: List price $259,990
Exterior
- Parking: 1 garage space (1 total parking space)
- Utilities: Has cooling (central air)
- Home design: Dunmore plan (new construction plan); Address in Bridgeville, DE
- Exterior features: Living area approximately 1,452
Interior
- Bedrooms: 3 bedrooms
- Bathrooms: 2 full bathrooms
- Heating & cooling: Central air
- Interior features: Central air conditioning
Neighborhood map
What this means for you Summary
Snapshot
- This is a 3-bed/2.0-bath townhouse listed at $260k. Condition is rated excellent.
Deal economics
- At list price, monthly cash flow is $-318 ($-4k/yr) — negative.
- The deal already cash-flows at list — no discount required.
- To meet the 1% rule (rent ≥ 1% of price), the offer needs to be $247k (5.1% below list).
- Recommended offer: $247k (5.1% below list) — sets the bar for 1% rule.
- Cap rate 5.1% vs local median 3.7% in Bridgeville — top-decile yield for the area; either an underpriced asset or a hidden risk that comps aren't pricing in. Stress-test before assuming the spread holds.
Location & tenants
- Location reads 64/100 on livability (#48 in DE) — a middle-class / working-renter tenant base. Strengths: health & safety A, crime B; Watch: schools F, amenities F, commute F.
- Woodbridge School District (rural): math 17% / reading 34% proficiency, ranked #21 of 26 in DE (top 81%) — low school quality limits family demand, transient renter base, plan for 1-2y turnover.
- Market conditions: 108 active listings in the ZIP; 3 comparable units currently listed for rent nearby; rentals lingering (median 45d on market — plan ~5-8 weeks vacancy on turnover, expect pricing pressure); 67% of comp listings sitting > 30 days — soft ceiling on asking rent; 4,354 units permitted in Sussex County in 2024 (344 in 5+ unit buildings).
Forward outlook
- In year one you build about $6k of equity ($2k loan paydown + $4k appreciation (1.1% local appreciation)).
- Sussex County population projected at +25% by 2050 — long-run rental-demand tailwind backs the buy-and-hold thesis.
- By year 6, paydown + projected appreciation supports a ~$34k cash-out refi (75% LTV) — recoverable capital for the next deal without selling this one.
Negotiation context
- It's been on market 24 days — a 2% lower offer ($256k) is reasonable based on typical stale-listing flexibility.
Questions for the listing agent
- What do current leases actually rent for vs. the listed asking? Can we see a recent rent roll and the last 12 months of T-12 income?
- Is there a deadline driving the sale (1031 exchange, divorce, estate, relocation)? That informs how much negotiation room exists.
- Schools are F-rated, which usually means shorter tenancies and higher turnover. Who's the typical renter profile here, and what's been the actual vacancy rate?
- The area grade is low — what's the realistic commute time and amenity access for the typical tenant pool here? Any planned neighborhood developments (good or bad) we should know about?
- What's the average days-on-market for RENTAL listings here right now (not sales)? A rising rental-DOM trend means longer vacancies and softer asking-rent achievability than the comps imply.
- What's the recent tenant-quality profile in this submarket — average credit score on applications, eviction rate, late-payment / NSF rate, and stable-employment percentage? A property-management company in the area should have these aggregated.
- How much new for-sale + rental construction is in the pipeline within 1–3 miles? Heavy new supply typically softens prices + rents 12–24 months out; constrained supply supports both.
Investment metrics
- 1% rule
- 0.75% ✗
- Cap rate
- 5.13%
- Cash-on-cash
- -4.15%
- DSCR
- 0.82
- GRM
- 11.1
CMA / ARV
- ARV (on-the-fly)
- $328,152
- Comps found
- 11
Show comp detail 11 sales within ~0.75 mi
| Address | Dist | Beds/Ba | Sqft | Sold | Price | $/sf | Match |
|---|---|---|---|---|---|---|---|
| 387 Heritage Shores Cir | 0.05mi | 2/2.0 (-1) | 1,449 (-0%) | 11mo | $349,990 | $242 | 83 |
| 303 Waterside Sq | 0.04mi | 2/2.0 (-1) | 1,449 (-0%) | 20mo | $364,200 | $251 | 77 |
| 399 Heritage Shores Cir | 0.08mi | 2/2.0 (-1) | 1,500 (+3%) | 11mo | $380,000 | $253 | 77 |
| 391 Heritage Shores Cir | 0.06mi | 2/2.0 (-1) | 1,500 (+3%) | 16mo | $339,590 | $226 | 74 |
| 305 Waterside Sq | 0.05mi | 2/2.0 (-1) | 1,449 (-0%) | 23mo | $345,700 | $239 | 74 |
| 301 Waterside Sq | 0.03mi | 2/2.0 (-1) | 1,500 (+3%) | 22mo | $330,690 | $220 | 70 |
| 66 Whistling Duck Dr | 0.58mi | 2/2.0 (-1) | 1,464 (+1%) | 10mo | $345,000 | $236 | 58 |
| 30 White Pelican Ct | 0.61mi | 2/2.0 (-1) | 1,605 (+10%) | 11mo | $285,000 | $178 | 40 |
| 34 White Pelican Ct | 0.61mi | 2/2.0 (-1) | 1,645 (+13%) | 6mo | $305,000 | $185 | 39 |
| 98 Whistling Duck Dr | 0.70mi | 2/2.0 (-1) | 1,602 (+10%) | 8mo | $330,000 | $206 | 39 |
| 64 Whistling Duck Dr | 0.57mi | 2/2.0 (-1) | 1,658 (+14%) | 17mo | $295,000 | $178 | 31 |
Match score weights: distance 35% · size 25% · config 20% · recency 20%. Top-matched comps best support the ARV.
Projected returns pro-forma
1.14% appreciation · 3.0% rent growth · sell at horizon
- IRR
- -2.5%
- Equity multiple
- 0.87×
- Total profit
- $-11,802
- Equity at exit
- $114,450
- IRR
- 2.5%
- Equity multiple
- 1.31×
- Total profit
- $28,239
- Equity at exit
- $153,987
Cash invested: $91,883 (down + closing). Projections, not guarantees.
Landlord ↔ Tenant lean methodology
- Overall (STATE)
- 70 Landlord-Friendly
- State Delaware
- 70 Landlord-Friendly · D+7
- County
- — inherits STATE
- City
- — inherits STATE
ZIP-level market 19933
- Home prices YoY
- 0.4%
- Active inventory
- 108
- Price-to-rent
- 8.8×
Monthly cashflow live
- Estimated rent
- $2,468 medium interval (Pro) →
- Mortgage (P&I)
- −$1,721
- Tax est. 1.5%
- −$410 /mo · $4,922/yr
- Insurance
- −$137
- HOA
- −$0
- Vacancy / Maint / Mgmt
- −$518
- Net cashflow
- $-318
Break-even live
Sensitivity live
| Price | -10% $-91 | -5% $-205 | +0% $-318 | +5% $-431 | +10% $-545 |
|---|---|---|---|---|---|
| Rent | -10% $-513 | -5% $-416 | +0% $-318 | +5% $-221 | +10% $-123 |
| Rate | -1.0pp $-153 | -0.5pp $-235 | base $-318 | +0.5pp $-403 | +1.0pp $-490 |
UW: 25.0% down · 7.5% · 30yr · 1.5% tax · 5.0% vac · 8.0% maint · 8.0% mgmt
Financing live
Cash to close
- Down payment
- $82,038
- Closing costs
- $9,845
- Reserves months
- —
- Total cash needed
- —
Loan-product check · same deal, 3 products live
Conventional
25% down · 7.5% · 30yr
- Down + closing
- —
- Monthly P&I
- —
- Monthly cashflow
- —
- DSCR
- —
- Eligible?
- —
Personal DTI + credit; lowest rate.
DSCR
20% down · 8.5% · 30yr
- Down + closing
- —
- Monthly P&I
- —
- Monthly cashflow
- —
- DSCR
- —
- Eligible?
- —
No personal income docs; deal must DSCR.
Hard money
10% down · 12.0% · 12mo
- Down + closing
- —
- Monthly P&I
- —
- Monthly cashflow
- —
- DSCR
- —
- Eligible?
- —
Short-term bridge; refi at stabilization.
Rent comps 3 comps
| Address | Beds | Baths | Sqft | Rent | $/sqft | DOM | Units | Dist |
|---|---|---|---|---|---|---|---|---|
| 377 Waterside Sq Bridgeville, DE | 3.0 | 2.5 | 1253 | $2,500 | $2.00 | 45d | 1 | 0.05mi |
| 501 Branch Run Rd Bridgeville, DE | 2.0–3.0 | 2.5–3.5 | 1635 | $2,595 | $1.59 | 14d | 12 | 0.58mi |
| 23613 Linkside Dr Bridgeville, DE | 3.0 | 2.0 | 1650 | $2,000 | $1.21 | 45d | 1 | 0.88mi |
Listing history 17 events
-
2026-06-21days on market $259,990 Active 24 DOM
-
2026-06-21days on market $259,990 Active 23 DOM
-
2026-06-18days on market $259,990 Active 21 DOM
-
2026-06-17days on market $259,990 Active 20 DOM
-
2026-06-16days on market $259,990 Active 19 DOM
-
2026-06-15days on market $259,990 Active 18 DOM
-
2026-06-13days on market $259,990 Active 16 DOM
-
2026-06-12days on market $259,990 Active 15 DOM
-
2026-06-09days on market $259,990 Active 12 DOM
-
2026-06-08days on market $259,990 Active 11 DOM
-
2026-06-07days on market $259,990 Active 10 DOM
-
2026-06-07days on market $259,990 Active 9 DOM
-
2026-06-04days on market $259,990 Active 6 DOM
-
2026-06-02days on market $259,990 Active 5 DOM
-
2026-06-01days on market $259,990 Active 4 DOM
-
2026-05-31days on market $259,990 Active 3 DOM
-
2026-05-31days on market $259,990 Active 2 DOM
ⓘ Source: listings_history table (triggers on properties + properties_extension) + one-shot
backfill from property_details.listing_events for pre-trigger history.
Nearby sold comps map
Loading sold comps map…
Walkable amenities ~0.75 mi
Loading nearby amenities…
Taxation est. · year 1
- Rental income
- $29,617
- − Mortgage interest
- −$18,382
- − Property taxes
- −$4,922
- − Insurance
- −$1,641
- − Repairs & maintenance
- −$2,369
- − Management
- −$2,369
- − Depreciation
- −$9,546
- Taxable loss
- −$9,613
- Est. tax savings @ 24.0%
- +$2,307
- After-tax cash flow
- $-1,509/yr
For passive investors: Depreciation is non-cash, so a rental often shows a tax loss while cash-flowing — sheltering income. Rental losses are passive: they offset passive income freely, and up to $25,000/yr can offset ordinary (W-2) income if you actively participate and your MAGI is under $100k (phasing out to $0 by $150k); unused losses carry forward. On sale, claimed depreciation is recaptured at up to 25%, and gains may owe capital-gains tax (a 1031 exchange can defer both). Figures are a year-1 estimate at your 24.0% rate — not tax advice; consult a CPA.
Condition & rehab AI · 10 photos
This townhouse is in excellent condition with modern finishes and a low-maintenance lifestyle. It's move-in ready and would benefit from minor exterior painting and landscaping improvements to maximize its value.
Value-add opportunities
- Both Painting the exterior — Enhances curb appeal and value
- Both Landscaping improvements — Enhances curb appeal and value
- Both Add a smart home system — Improves convenience and marketability
Renovation cost estimate screening
Value-add ROI direction
- Both Painting the exterior — Enhances curb appeal and value ↑
- Both Landscaping improvements — Enhances curb appeal and value ↑
- Both Add a smart home system — Improves convenience and marketability ↑
ⓘ Cost ranges are severity-bucket heuristics (US national rule-of-thumb). Get contractor quotes + a written scope before underwriting a rehab budget.
Schools (NCES district)
- District
- Woodbridge School District
- NCES district ID
- 1001850
- Math proficiency
- 17% ▼ -14.00%
- Reading proficiency
- 34% ▼ -5.00%
- Median HH income
- $48,711
- Composite
- 22.28/100
- National rank
- #8137
- State rank
- #21 of 26 in DE
Livability — Bridgeville
- Score
- 64/100
- State rank
- #48
- US rank
- #13807
Category grades
Schools grade is shown separately in the Schools card above.
Census & demographics
- Census place
- Bridgeville, DE
- City population
- 11,409
- Population (ZIP)
- 11,409
Population outlook (Sussex County) Hauer SSP2
- Today (2025)
- 248,853 people
- By 2030
- 264,464 · +6.3%
- By 2040
- 290,980 · +16.9%
- By 2050
- 311,259 · +25.1%
- By 2075
- 352,488 · +41.6%
- By 2100
- 367,406 · +47.6%
Race, ethnicity, and origin ACS 2023
- Neighborhood character
- Diverse neighborhood (Simpson 0.64)
- Race & ethnicity
- White 52% Hispanic / Latino 22% Black 21% Two or more races 10%
- Hispanic origin (detail)
- Mexican 9% Puerto Rican 2%
- Common ancestry
- Romanian 2% Hispanic 2% Slovak 1%
- Foreign-born
- 10% · Canada
- Languages at home
- 80% English-only · Spanish 16% French/Haitian/Cajun 3% Other Indo-European 1%
Political lean MEDSL · Sussex
- 2024 margin
- R (+11.0) · D 43.9% · R 54.9% · Other 1.2%
- 2008→2024 swing
- -2.4pp toward R · 2008: -8.6pp · 2024: -11.0pp
- All cycles
- 2024: R+11.0 2020: R+11.2 2016: R+22.0 2012: R+13.0 2008: R+8.6
Not yet ingested
- Civics
- —
Market trends
- HPI YoY
- ▲ 1.14%
- Current HPI
- 283.0199
- Rent YoY
- —
- Metro
- —
- State GDP YoY
- —
- F500 in state
- 0
Cash-flow waterfall
monthlySold comps — $/sqft
last 12 mo · ≤1 miLoading sold comps…