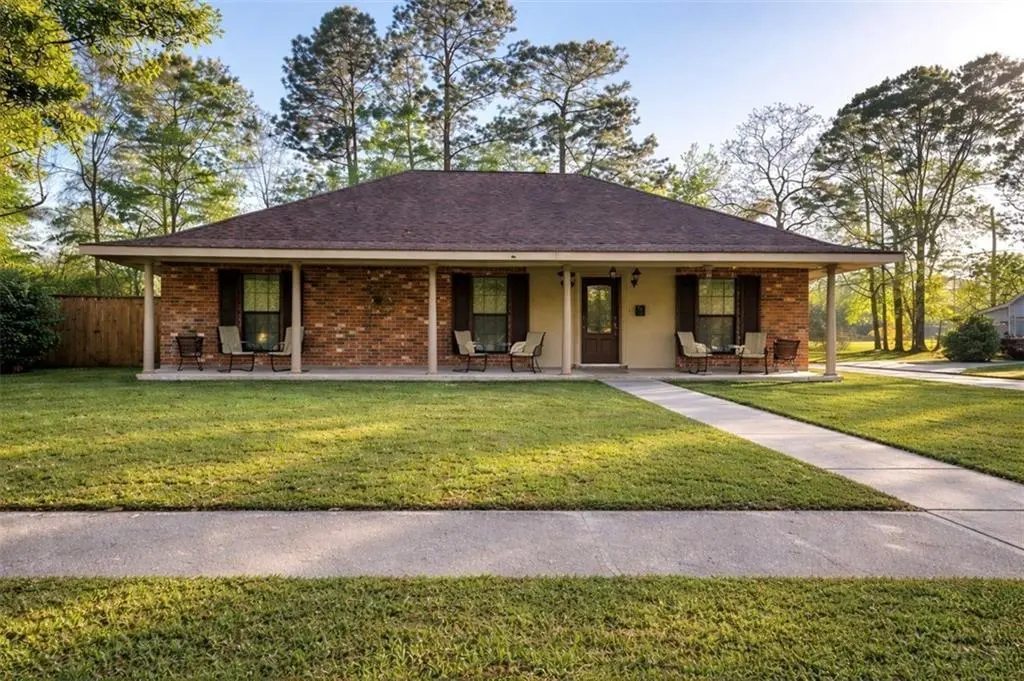
205 Greencrest Dr · Slidell, LA
Flood risk No data
- FEMA flood zone
- —
- Chance of flooding over 30 yrs
- —
- Est. flood insurance / yr
- —
Fire risk No data
- Est. fire insurance / yr
- —
Heat risk No data
- Hot days now (above threshold)
- —
- Hot days in 30 yrs
- —
Wind risk No data
- Chance of severe wind over 30 yrs
- —
Air-quality risk No data
- Unhealthy air days now
- —
- Unhealthy air days in 30 yrs
- —
Risk factors via First Street. Map © Google.
Why this score? — see what drove the D grade
The composite is a weighted blend of 9 inputs, each scored 0–100. Each bar is that input's sub-score; the figure is the points it added to the 100-point composite (weight × sub-score).
- Cash flow +14.5/30.0
- ARV discount +6.8/15.0
- DSCR +4.4/10.0
- Schools +4.3/10.0
- 1% rule +3.8/10.0
- Livability +3.5/5.0
- Rent growth +2.9/5.0
- Condition / age +2.5/5.0
- Appreciation +0.0/10.0
$198,000
🖨 Deal sheet (PDF) 📄 Offer letter ✓ Due diligence
Listing remarks MLS
Opportunity is knocking at 205 Greencrest Dr in Slidell, Louisiana—and this is one you don’t want to miss. This 3-bedroom, 2-bath home sits on an over-sized corner lot tucked next to a quiet dead-end street, offering added privacy and space that’s hard to find. The property features hurricane shutters, a huge backyard, carport, and extended driveway with ample parking, making it great for homeowners or investors looking for flexibility and value. Previously sold in 2023, this home is now being offered as part of a succession, presenting a unique opportunity to own a property with strong upside. The home is currently in the process of being cleared out and does contain a significant amount of personal belongings—please look beyond contents and focus on the potential. Whether you’re looking for your next home, investment, or a property to customize and make your own, this is a sweet deal with serious potential. PRICED TO MOVE – SHORT SALE OPPORTUNITY Sold as is. Subject to lender approval. Seller is motivated and seeking a quick contract.
Key facts
- Ample parking
- Hurricane shutters
- Huge backyard
Tags
Neighborhood map
What this means for you Summary
Snapshot
- This is a 3-bed/2.0-bath single-family listed at $198k.
Deal economics
- At list price, monthly cash flow is $42 ($503/yr) — positive.
- The deal already cash-flows at list — no discount required.
- To meet the 1% rule (rent ≥ 1% of price), the offer needs to be $175k (11.8% below list).
- Recommended offer: $175k (11.8% below list) — sets the bar for 1% rule.
Location & tenants
- Location reads 70/100 on livability (#57 in LA) — a middle-class / working-renter tenant base. Strengths: cost of living A+, housing A+, health & safety A+; Watch: amenities F, commute F.
- St. Tammany Parish (suburban): math 43% / reading 55% proficiency, ranked #11 of 98 in LA (top 11%) — families likely to look elsewhere, expect single-tenant / working-renter base with shorter leases.
- Zoned schools: W.L. Abney Elementary School (math 31% / reading 38%, grade F, #284 of 646 statewide, top 46%, 1,094 students, 70% FRL); St. Tammany Junior High School (math 19% / reading 41%, grade F, #114 of 218 statewide, top 53%, 793 students, 68% FRL); Salmen High School (math 15% / reading 27%, grade F, #179 of 265 statewide, top 68%, 1,216 students, 62% FRL) — zoned schools average 67% FRL vs 40% district-wide (27 pts higher); higher-poverty schools than district average — tighter screening recommended.
- Zoned-school proficiency averages 28% at this address vs 49% district-wide (-20 pts) — the specific schools serving this property underperform the St. Tammany Parish average; the district grade overstates school quality for this exact location.
- Market conditions: Rents rising (+1.5%/yr); 489 active listings in the ZIP; 10 comparable units currently listed for rent nearby; rentals at typical pace (median 26d on market — plan ~3-4 weeks tenant-placement turnaround); 1,064 units permitted in St. Tammany Parish in 2024 (0 in 5+ unit buildings).
Forward outlook
- Local home prices are declining (-3.0%/yr); year-one equity from $1k of loan paydown is wiped out by about $6k of value loss. Plan a longer hold.
- St. Tammany County population projected at +27% by 2050 — long-run rental-demand tailwind backs the buy-and-hold thesis.
Negotiation context
- It's been on market 89 days — a 6% lower offer ($186k) is reasonable based on typical stale-listing flexibility.
- 4 sale attempts since 3y ago with the ask held roughly flat each time — persistent listings suggest the price (not the market) is what's stuck; bring a comps-based counter.
Questions for the listing agent
- It's been on market 89 days. Have you received any prior offers? Is the seller open to a 12% concession, seller financing, or rate buy-down credit?
- Built in 1973 — when were the roof, HVAC, electrical panel, plumbing, and water heater last replaced?
- Why hasn't it sold? Are there any deal-killer items the seller is aware of (foundation, flood, title, zoning, code violations)?
- Is there a deadline driving the sale (1031 exchange, divorce, estate, relocation)? That informs how much negotiation room exists.
- Schools are B-rated — typically a magnet for longer-tenancy family renters. What's the average tenant stay here, and is there a school-zone premium baked into asking?
- The area grade is low — what's the realistic commute time and amenity access for the typical tenant pool here? Any planned neighborhood developments (good or bad) we should know about?
- What's the average days-on-market for RENTAL listings here right now (not sales)? A rising rental-DOM trend means longer vacancies and softer asking-rent achievability than the comps imply.
- What's the recent tenant-quality profile in this submarket — average credit score on applications, eviction rate, late-payment / NSF rate, and stable-employment percentage? A property-management company in the area should have these aggregated.
- How much new for-sale + rental construction is in the pipeline within 1–3 miles? Heavy new supply typically softens prices + rents 12–24 months out; constrained supply supports both.
Investment metrics
- 1% rule
- 0.88% ✗
- Cap rate
- 6.55%
- Cash-on-cash
- 0.91%
- DSCR
- 1.04
- GRM
- 9.5
CMA / ARV
- ARV (median comp)
- $195,101
- List price
- $198,000
- Delta
- 1.49%
- Verdict
- FAIR
- Comps
- 20 within 1.0 mi
Show comp detail 12 sales within ~0.75 mi
| Address | Dist | Beds/Ba | Sqft | Sold | Price | $/sf | Match |
|---|---|---|---|---|---|---|---|
| 140 Greencrest Dr | 0.07mi | 3/2.0 | 1,480 (-8%) | 1mo | $176,000 | $119 | 83 |
| 3738 Arrowhead Dr | 0.44mi | 3/2.0 | 1,580 (-1%) | 11mo | $168,000 | $106 | 68 |
| 3844 Riviera Dr | 0.33mi | 3/1.5 | 1,466 (-8%) | 6mo | $150,000 | $102 | 64 |
| 3852 Oxford St | 0.61mi | 3/2.0 | 1,658 (+4%) | 6mo | $167,000 | $101 | 61 |
| 116 Palm Springs Dr | 0.23mi | 4/2.0 (+1) | 1,380 (-14%) | 8mo | $70,000 | $51 | 55 |
| 127 Whitehall Dr | 0.49mi | 4/2.0 (+1) | 1,475 (-8%) | 5mo | $145,000 | $98 | 55 |
| 365 Dorset Dr | 0.51mi | 3/2.0 | 1,774 (+11%) | 7mo | $207,500 | $117 | 53 |
| 3858 Eton St | 0.56mi | 3/2.0 | 1,367 (-15%) | 1mo | $188,000 | $138 | 49 |
| 176 Southpark Dr | 0.61mi | 3/2.0 | 1,442 (-10%) | 8mo | $170,000 | $118 | 49 |
| 3638 Meadowdale Dr | 0.54mi | 3/1.5 | 1,815 (+13%) | 3mo | $176,800 | $97 | 48 |
| 297 Nassau Dr | 0.49mi | 3/2.0 | 1,388 (-13%) | 11mo | $174,000 | $125 | 46 |
| 409 Markham Dr | 0.69mi | 2/2.0 (-1) | 1,388 (-13%) | 9mo | $140,000 | $101 | 33 |
Match score weights: distance 35% · size 25% · config 20% · recency 20%. Top-matched comps best support the ARV.
Projected returns pro-forma
-3.0% appreciation · 1.47% rent growth · sell at horizon
- IRR
- -16.5%
- Equity multiple
- 0.42×
- Total profit
- $-32,053
- Equity at exit
- $29,522
- IRR
- -11.3%
- Equity multiple
- 0.37×
- Total profit
- $-34,975
- Equity at exit
- $17,119
Cash invested: $55,440 (down + closing). Projections, not guarantees.
Landlord ↔ Tenant lean methodology
- Overall (STATE)
- 90 Strongly Landlord-Friendly
- State Louisiana
- 90 Strongly Landlord-Friendly · R+12
- County
- — inherits STATE
- City
- — inherits STATE
ZIP-level market 70458
- Rents YoY
- 1.5%
- Active inventory
- 489
- Price-to-rent
- 9.5×
Monthly cashflow live
- Estimated rent
- $1,746 high interval (Pro) →
- Mortgage (P&I)
- −$1,038
- Tax from tax record
- −$216 /mo · $2,596/yr
- Insurance
- −$82
- HOA
- −$0
- Vacancy / Maint / Mgmt
- −$367
- Net cashflow
- $42
Break-even live
Sensitivity live
| Price | -10% $154 | -5% $98 | +0% $42 | +5% $-14 | +10% $-70 |
|---|---|---|---|---|---|
| Rent | -10% $-96 | -5% $-27 | +0% $42 | +5% $111 | +10% $180 |
| Rate | -1.0pp $142 | -0.5pp $92 | base $42 | +0.5pp $-9 | +1.0pp $-62 |
UW: 25.0% down · 7.5% · 30yr · 1.5% tax · 5.0% vac · 8.0% maint · 8.0% mgmt
Financing live
Cash to close
- Down payment
- $49,500
- Closing costs
- $5,940
- Reserves months
- —
- Total cash needed
- —
Loan-product check · same deal, 3 products live
Conventional
25% down · 7.5% · 30yr
- Down + closing
- —
- Monthly P&I
- —
- Monthly cashflow
- —
- DSCR
- —
- Eligible?
- —
Personal DTI + credit; lowest rate.
DSCR
20% down · 8.5% · 30yr
- Down + closing
- —
- Monthly P&I
- —
- Monthly cashflow
- —
- DSCR
- —
- Eligible?
- —
No personal income docs; deal must DSCR.
Hard money
10% down · 12.0% · 12mo
- Down + closing
- —
- Monthly P&I
- —
- Monthly cashflow
- —
- DSCR
- —
- Eligible?
- —
Short-term bridge; refi at stabilization.
Rent comps 10 comps
| Address | Beds | Baths | Sqft | Rent | $/sqft | DOM | Units | Dist |
|---|---|---|---|---|---|---|---|---|
| 301 Spartan Dr Slidell, LA | 1.0–2.0 | 1.0–2.0 | 880 | $1,502 | $1.71 | 5d | 8 | 0.38mi |
| 3839 Oxford St Slidell, LA | 3.0 | 2.0 | 1660 | $1,700 | $1.02 | 45d | 1 | 0.60mi |
| 172 South St Slidell, LA | 4.0 | 2.0 | 1486 | $1,800 | $1.21 | 23d | 1 | 0.65mi |
| 102 Spartan Trace Blvd Slidell, LA | 3.0 | 2.0 | 1516 | $2,000 | $1.32 | 25d | 1 | 0.67mi |
| 3152 College St Slidell, LA | 3.0 | 1.0 | 1373 | $1,750 | $1.27 | 45d | 1 | 0.96mi |
| 519 Spartan Dr #9101 Slidell, LA | 2.0 | 2.0 | 1304 | $1,400 | $1.07 | 25d | 1 | 0.98mi |
| 3304 Bridge Dr Slidell, LA | 3.0 | 2.0 | 1250 | $1,700 | $1.36 | 45d | 1 | 1.07mi |
| 3046 Slidell Ave Slidell, LA | 4.0 | 1.0 | 1253 | $1,850 | $1.48 | 5d | 1 | 1.17mi |
| 901 Old Spanish Trl Slidell, LA | 2.0 | 1.5 | 1070 | $1,120 | $1.05 | 13d | 1 | 1.34mi |
| 101 Moonraker Dr Slidell, LA | 3.0 | 2.0 | 1811 | $2,300 | $1.27 | 25d | 1 | 1.34mi |
Listing history 21 events
-
2026-06-21days on market $198,000 Active 89 DOM
-
2026-06-18days on market $198,000 Active 86 DOM
-
2026-06-17days on market $198,000 Active 85 DOM
-
2026-06-16days on market $198,000 Active 84 DOM
-
2026-06-15days on market $198,000 Active 83 DOM
-
2026-06-13days on market $198,000 Active 81 DOM
-
2026-06-10days on market $198,000 Active 78 DOM
-
2026-06-09days on market $198,000 Active 77 DOM
-
2026-06-08days on market $198,000 Active 76 DOM
-
2026-06-07days on market $198,000 Active 75 DOM
-
2026-06-03days on market $198,000 Active 71 DOM
-
2026-06-02days on market $198,000 Active 70 DOM
-
2026-06-01days on market $198,000 Active 69 DOM
-
2026-05-31days on market $198,000 Active 68 DOM
-
2026-03-24$198,000 Active 1088-char remark
Show marketing remark (1054 chars)
Opportunity is knocking at 205 Greencrest Dr in Slidell, Louisiana--and this is one you don't want to miss. This 3-bedroom, 2-bath home sits on an over-sized corner lot tucked next to a quiet dead-end street, offering added privacy and space that's hard to find. The property features hurricane shutters, a huge backyard, carport, and extended driveway with ample parking, making it great for homeowners or investors looking for flexibility and value. Previously sold in 2023, this home is now being offered as part of a succession, presenting a unique opportunity to own a property with strong upside. The home is currently in the process of being cleared out and does contain a significant amount of personal belongings--please look beyond contents and focus on the potential. Whether you're looking for your next home, investment, or a property to customize and make your own, this is a sweet deal with serious potential. PRICED TO MOVE - SHORT SALE OPPORTUNITY Sold as is. Subject to lender approval. Seller is motivated and seeking a quick contract.
-
2026-03-24$198,000 Active 1054-char remark
Show marketing remark (1054 chars)
Opportunity is knocking at 205 Greencrest Dr in Slidell, Louisiana--and this is one you don't want to miss. This 3-bedroom, 2-bath home sits on an over-sized corner lot tucked next to a quiet dead-end street, offering added privacy and space that's hard to find. The property features hurricane shutters, a huge backyard, carport, and extended driveway with ample parking, making it great for homeowners or investors looking for flexibility and value. Previously sold in 2023, this home is now being offered as part of a succession, presenting a unique opportunity to own a property with strong upside. The home is currently in the process of being cleared out and does contain a significant amount of personal belongings--please look beyond contents and focus on the potential. Whether you're looking for your next home, investment, or a property to customize and make your own, this is a sweet deal with serious potential. PRICED TO MOVE - SHORT SALE OPPORTUNITY Sold as is. Subject to lender approval. Seller is motivated and seeking a quick contract.
-
2023-07-18soldstatus $216,000
-
2023-07-17soldstatus $216,000 Closed
-
2023-06-19historical Active Under Contract
-
2023-06-10$224,900 Active
-
2023-06-10$224,900
ⓘ Source: listings_history table (triggers on properties + properties_extension) + one-shot
backfill from property_details.listing_events for pre-trigger history.
Tax reassessment forecast LA · Resets to sale price
- Current annual tax
- $2,596 · $216/mo
- Projected year-2 tax
- $2,596 · $216/mo
- Expected delta
- $0/yr ($0/mo · 0.0%)
ⓘ Screening estimate from a state-policy table — verify with the county assessor before closing.
Nearby sold comps map
Loading sold comps map…
Walkable amenities ~0.75 mi
Loading nearby amenities…
Taxation est. · year 1
- Rental income
- $20,949
- − Mortgage interest
- −$11,091
- − Property taxes
- −$2,596
- − Insurance
- −$990
- − Repairs & maintenance
- −$1,676
- − Management
- −$1,676
- − Depreciation
- −$5,760
- Taxable loss
- −$2,840
- Est. tax savings @ 24.0%
- +$682
- After-tax cash flow
- $1,185/yr
For passive investors: Depreciation is non-cash, so a rental often shows a tax loss while cash-flowing — sheltering income. Rental losses are passive: they offset passive income freely, and up to $25,000/yr can offset ordinary (W-2) income if you actively participate and your MAGI is under $100k (phasing out to $0 by $150k); unused losses carry forward. On sale, claimed depreciation is recaptured at up to 25%, and gains may owe capital-gains tax (a 1031 exchange can defer both). Figures are a year-1 estimate at your 24.0% rate — not tax advice; consult a CPA.
Schools (NCES district)
- District
- St. Tammany Parish
- NCES district ID
- 2201650
- Math proficiency
- 43% ▼ -32.00%
- Reading proficiency
- 55% ▼ -26.00%
- Median HH income
- $61,752
- Composite
- 43.04/100
- National rank
- #3098
- State rank
- #11 of 98 in LA
Livability — Slidell
- Score
- 70/100
- State rank
- #57
- US rank
- #7673
Category grades
Schools grade is shown separately in the Schools card above.
Census & demographics
- Census place
- Slidell, LA
- County
- Saint Tammany Parish · 228,296 people
- City population
- 95,511
- Metro
- New Orleans-Metairie, LA
- Population (ZIP)
- 39,034
- Household income
- $72,843
- Rent vs Own
- Severe rent burden
- 1331.0
Population outlook (St. Tammany County) Hauer SSP2
- Today (2025)
- 286,725 people
- By 2030
- 304,175 · +6.1%
- By 2040
- 336,203 · +17.3%
- By 2050
- 364,590 · +27.2%
- By 2075
- 433,362 · +51.1%
- By 2100
- 470,333 · +64.0%
Race, ethnicity, and origin ACS 2023
- Neighborhood character
- Predominantly White (66%)
- Race & ethnicity
- White 66% Black 17% Two or more races 10% Hispanic / Latino 9% Native American 2% Asian 1%
- Hispanic origin (detail)
- Mexican 3% Puerto Rican 1%
- Common ancestry
- Lithuanian 15% Slovak 2% Romanian 1%
- Foreign-born
- 3% · Canada, Vietnam
- Languages at home
- 93% English-only · Spanish 5% Vietnamese 1%
Political lean MEDSL · St. Tammany
- 2024 margin
- Solid R (+43.8) · D 27.3% · R 71.1% · Other 1.6%
- 2008→2024 swing
- +9.6pp toward D · 2008: -53.4pp · 2024: -43.8pp
- All cycles
- 2024: R+43.8 2020: R+44.2 2016: R+50.8 2012: R+52.2 2008: R+53.4
Not yet ingested
- Civics
- —
Market trends
- HPI YoY
- ▼ -173.60%
- Current HPI
- 147.4749
- Rent YoY
- ▲ 1.47%
- Metro
- New Orleans-Metairie, LA
- State GDP YoY
- ▲ 3.29%
- F500 in state
- 10
Industry mix (Fortune 500 HQ in LA)
| Industry | F500 HQs | Revenue |
|---|---|---|
| Telecommunications | 2 | $23B |
|
||
| Utilities | 1 | $12B |
|
||
| Wholesale / Distribution | 1 | $5B |
|
||
| Advertising | 1 | $2B |
|
||
Price history
-12.0% since first listed7 events — show timeline
- 2026-03-24 Listed $198,000 AcadianaMLS
- 2026-03-24 Listed $198,000 GSREIN
- 2023-07-18 Sold (Public Records) $216,000 Public Records
- 2023-07-17 Sold (MLS) $216,000 GSREIN
- 2023-06-19 Contingent — GSREIN
- 2023-06-10 Listed $224,900 AcadianaMLS
- 2023-06-10 Listed $224,900 GSREIN
Property tax history
+7.5%/yrLatest (2025): $2,596 · +42.9% YoY. Source: county tax records.
Cash-flow waterfall
monthlySold comps — $/sqft
last 12 mo · ≤1 miLoading sold comps…