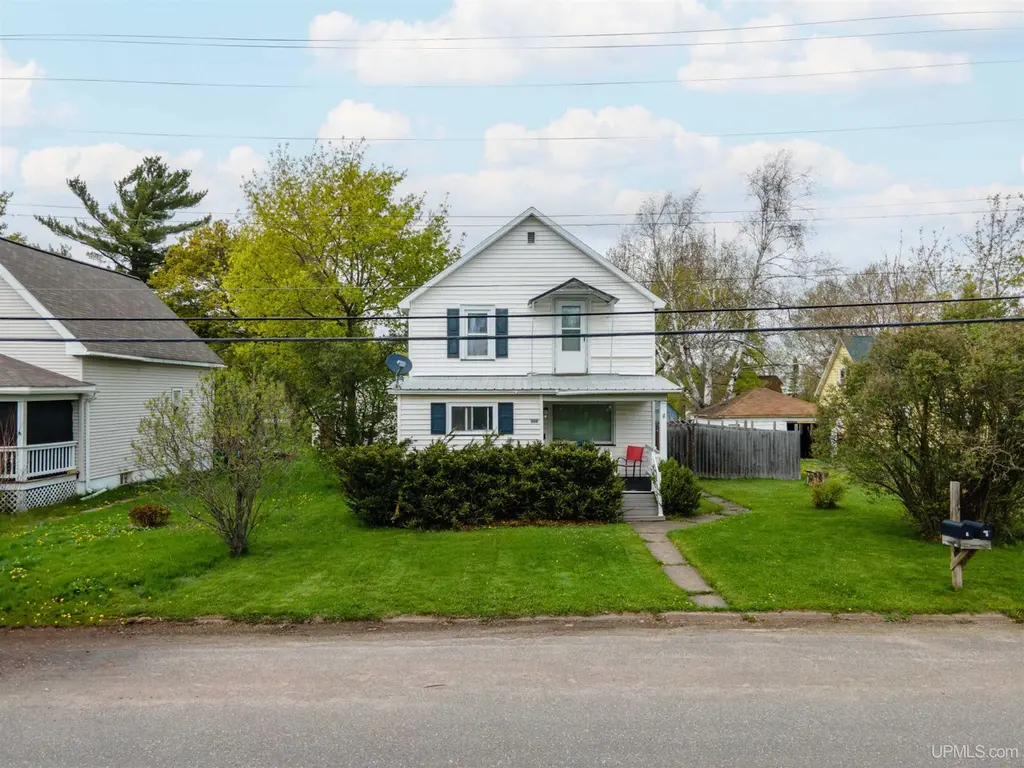
712 Forest Pkwy · Crystal Falls, MI
Flood risk No data
- FEMA flood zone
- —
- Chance of flooding over 30 yrs
- —
- Est. flood insurance / yr
- —
Fire risk No data
- Est. fire insurance / yr
- —
Heat risk No data
- Hot days now (above threshold)
- —
- Hot days in 30 yrs
- —
Wind risk No data
- Chance of severe wind over 30 yrs
- —
Air-quality risk No data
- Unhealthy air days now
- —
- Unhealthy air days in 30 yrs
- —
Risk factors via First Street. Map © Google.
Why this score? — see what drove the C+ grade
The composite is a weighted blend of 9 inputs, each scored 0–100. Each bar is that input's sub-score; the figure is the points it added to the 100-point composite (weight × sub-score).
- Cash flow +22.5/30.0
- ARV discount +15.0/15.0
- DSCR +7.2/10.0
- 1% rule +4.8/10.0
- Livability +3.6/5.0
- Schools +2.8/10.0
- Rent growth +2.5/5.0
- Condition / age +2.5/5.0
- Appreciation +0.0/10.0
$129,900
🖨 Deal sheet 📄 Offer letter ✓ Due diligence
Listing remarks MLS
Maximize your portfolio with this turnkey, income-generating 1,872 sq ft duplex featuring private outdoor space and dual laundry setups! The main-floor unit welcomes tenants into a spacious living room and kitchen paired with two comfortable bedrooms and a full bath. Upstairs, the second bright two-bedroom unit features its own in-unit laundry and an updated full bath. Capitalizing on functional space, the full basement boasts convenient secondary laundry hookups, a bonus 3/4 bath, and extensive storage, while the exterior rounds out this high-demand rental with a fully fenced yard and a detached two-car garage.
Key facts
- Updated full bath
- Extensive storage
- In-unit laundry
Tags
Property features AI
Finance
- Other: Two residential units (both occupied); Separate first-floor unit and second-floor unit; Directions: US2 west to left on High St, right on Forest Pkwy to property on right
- HOA & community: Association/landlord pays taxes, trash removal, water/sewer, electric, and gas
Exterior
- Parking: Detached garage with electric; 2 garage parking spaces
- Utilities: Public water; Public sanitary sewer; Electricity connected (100 Amp service); Natural gas connected; Water heater: Electric and Gas
- Home design: Duplex multi-family property; Conventional frame; 2-story; Built in 1930; Street is a Parkway
- Construction: Basement foundation
- Exterior features: Vinyl siding; Fenced yard; City/county road access; Walkable to school
Interior
- Kitchen: Range/oven; Refrigerator
- Bedrooms: First-floor bedroom; Second-floor bedrooms (in second unit)
- Flooring: Concrete (in at least one bedroom)
- Bathrooms: Three full bathrooms total; Main-floor full bathroom; Basement bathroom
- Heating & cooling: Forced air heating; Central A/C; Natural gas fuel
- Interior features: Basement present; Basement bathroom
- Laundry & utility: Washer; Dryer; Full poured basement
Neighborhood map
What this means for you Summary
Snapshot
- This is a 4-bed/2.0-bath single-family listed at $130k.
Deal economics
- At list price, monthly cash flow is $218 ($3k/yr) — positive.
- The deal already cash-flows at list — no discount required.
- To meet the 1% rule (rent ≥ 1% of price), the offer needs to be $127k (2.4% below list).
- Recommended offer: $127k (2.4% below list) — sets the bar for 1% rule.
Location & tenants
- Location reads 71/100 on livability (#274 in MI) — a middle-class / working-renter tenant base. Strengths: crime A+, cost of living A+, housing A+; Watch: employment C-, health & safety C-, schools D.
- Forest Park School District (rural): math 27% / reading 39% proficiency, ranked #331 of 540 in MI (top 61%) — families likely to look elsewhere, expect single-tenant / working-renter base with shorter leases.
- Market conditions: 62 active listings in the ZIP; 156 units permitted in Iron County in 2024 (0 in 5+ unit buildings).
Forward outlook
- Local home prices are declining (-3.0%/yr); year-one equity from $898 of loan paydown is wiped out by about $4k of value loss. Plan a longer hold.
- Iron County population projected at -26% by 2050 — secular population decline; favor cash flow + early exit over multi-decade hold.
Negotiation context
- It's been on market 17 days — a 2% lower offer ($128k) is reasonable based on typical stale-listing flexibility.
- 5 sale attempts since 10y ago with the ask held roughly flat each time — persistent listings suggest the price (not the market) is what's stuck; bring a comps-based counter.
- Current owner paid $61k; list at $130k implies a 113% gain — meaningful room to come down on a strong offer.
Risks & watch-outs
- Watch-outs: built in 1930 — expect roof / HVAC / electrical / plumbing capex.
Questions for the listing agent
- Built in 1930 — when were the roof, HVAC, electrical panel, plumbing, and water heater last replaced?
- Is there a deadline driving the sale (1031 exchange, divorce, estate, relocation)? That informs how much negotiation room exists.
- Schools are D-rated, which usually means shorter tenancies and higher turnover. Who's the typical renter profile here, and what's been the actual vacancy rate?
- What's the average days-on-market for RENTAL listings here right now (not sales)? A rising rental-DOM trend means longer vacancies and softer asking-rent achievability than the comps imply.
- What's the recent tenant-quality profile in this submarket — average credit score on applications, eviction rate, late-payment / NSF rate, and stable-employment percentage? A property-management company in the area should have these aggregated.
- How much new for-sale + rental construction is in the pipeline within 1–3 miles? Heavy new supply typically softens prices + rents 12–24 months out; constrained supply supports both.
Investment metrics
- 1% rule
- 0.98% ✗
- Cap rate
- 8.31%
- Cash-on-cash
- 7.20%
- DSCR
- 1.32
- GRM
- 8.5
CMA / ARV
- ARV (on-the-fly)
- $164,796
- Comps found
- 6
Show comp detail 6 sales within ~0.75 mi
| Address | Dist | Beds/Ba | Sqft | Sold | Price | $/sf | Match |
|---|---|---|---|---|---|---|---|
| 401 S Fifth St | 0.36mi | 3/1.5 (-1) | 1,840 (+4%) | 10mo | $95,000 | $52 | 62 |
| 203 N Sixth St | 0.18mi | 3/1.5 (-1) | 1,534 (-13%) | 9mo | $143,000 | $93 | 55 |
| 309 S Fifth St | 0.32mi | 5/2.0 (+1) | 1,650 (-7%) | 20mo | $49,500 | $30 | 52 |
| 121 Iron St | 0.14mi | 3/1.5 (-1) | 1,600 (-10%) | 24mo | $125,000 | $78 | 51 |
| 212 Briar Hill St | 0.35mi | 4/2.0 | 1,512 (-15%) | 18mo | $149,900 | $99 | 44 |
| 217 Railway St | 0.39mi | 3/1.0 (-1) | 1,527 (-14%) | 15mo | $208,750 | $137 | 37 |
Match score weights: distance 35% · size 25% · config 20% · recency 20%. Top-matched comps best support the ARV.
Projected returns pro-forma
-3.0% appreciation · 3.0% rent growth · sell at horizon
- IRR
- -5.3%
- Equity multiple
- 0.80×
- Total profit
- $-7,209
- Equity at exit
- $19,369
- IRR
- 4.3%
- Equity multiple
- 1.31×
- Total profit
- $11,402
- Equity at exit
- $11,231
Cash invested: $36,372 (down + closing). Projections, not guarantees.
Landlord ↔ Tenant lean methodology
- Overall (STATE)
- 62 Landlord-Friendly
- State Michigan
- 62 Landlord-Friendly · EVEN
- County
- — inherits STATE
- City
- — inherits STATE
ZIP-level market 49920
- Home prices YoY
- -18.6%
- Active inventory
- 62
- Price-to-rent
- 8.5×
Monthly cashflow live
- Estimated rent
- $1,268 medium interval (Pro) →
- Mortgage (P&I)
- −$681
- Tax from tax record
- −$48 /mo · $575/yr
- Insurance
- −$54
- HOA
- −$0
- Vacancy / Maint / Mgmt
- −$266
- Net cashflow
- $218
Break-even live
UW: 25.0% down · 7.5% · 30yr · 1.5% tax · 5.0% vac · 8.0% maint · 8.0% mgmt
Financing live
Cash to close
- Down payment
- $32,475
- Closing costs
- $3,897
- Reserves months
- —
- Total cash needed
- —
Loan-product check · same deal, 3 products live
Conventional
25% down · 7.5% · 30yr
- Down + closing
- —
- Monthly P&I
- —
- Monthly cashflow
- —
- DSCR
- —
- Eligible?
- —
Personal DTI + credit; lowest rate.
DSCR
20% down · 8.5% · 30yr
- Down + closing
- —
- Monthly P&I
- —
- Monthly cashflow
- —
- DSCR
- —
- Eligible?
- —
No personal income docs; deal must DSCR.
Hard money
10% down · 12.0% · 12mo
- Down + closing
- —
- Monthly P&I
- —
- Monthly cashflow
- —
- DSCR
- —
- Eligible?
- —
Short-term bridge; refi at stabilization.
Listing history 13 events
-
2026-06-18days on market $129,900 Active 17 DOM
-
2026-06-17days on market $129,900 Active 16 DOM
-
2026-06-16days on market $129,900 Active 15 DOM
-
2026-06-15days on market $129,900 Active 14 DOM
-
2026-06-13days on market $129,900 Active 12 DOM
-
2026-06-12days on market $129,900 Active 11 DOM
-
2026-06-09days on market $129,900 Active 8 DOM
-
2026-06-08days on market $129,900 Active 7 DOM
-
2026-06-07days on market $129,900 Active 6 DOM
-
2026-06-07days on market $129,900 Active 5 DOM
-
2026-06-04days on market $129,900 Active 2 DOM
-
2026-06-01remarks 619-char remark
Show marketing remark (619 chars)
Maximize your portfolio with this turnkey, income-generating 1,872 sq ft duplex featuring private outdoor space and dual laundry setups! The main-floor unit welcomes tenants into a spacious living room and kitchen paired with two comfortable bedrooms and a full bath. Upstairs, the second bright two-bedroom unit features its own in-unit laundry and an updated full bath. Capitalizing on functional space, the full basement boasts convenient secondary laundry hookups, a bonus 3/4 bath, and extensive storage, while the exterior rounds out this high-demand rental with a fully fenced yard and a detached two-car garage.
-
2026-06-01$129,900 Active 1 DOM
Show marketing remark (619 chars)
Maximize your portfolio with this turnkey, income-generating 1,872 sq ft duplex featuring private outdoor space and dual laundry setups! The main-floor unit welcomes tenants into a spacious living room and kitchen paired with two comfortable bedrooms and a full bath. Upstairs, the second bright two-bedroom unit features its own in-unit laundry and an updated full bath. Capitalizing on functional space, the full basement boasts convenient secondary laundry hookups, a bonus 3/4 bath, and extensive storage, while the exterior rounds out this high-demand rental with a fully fenced yard and a detached two-car garage.
ⓘ Source: listings_history table (triggers on properties + properties_extension) + one-shot
backfill from property_details.listing_events for pre-trigger history.
Tax reassessment forecast MI · Partial reset (capped growth)
- Current annual tax
- $575 · $48/mo
- Projected year-2 tax
- $1,288 · $107/mo
- Expected delta
- +$713/yr (+$59/mo · 123.9%)
ⓘ Screening estimate from a state-policy table — verify with the county assessor before closing.
Nearby sold comps map
Loading sold comps map…
Walkable amenities ~0.75 mi
Loading nearby amenities…
Taxation est. · year 1
- Rental income
- $15,211
- − Mortgage interest
- −$7,276
- − Property taxes
- −$575
- − Insurance
- −$650
- − Repairs & maintenance
- −$1,217
- − Management
- −$1,217
- − Depreciation
- −$3,779
- Taxable income
- $497
- Est. tax owed @ 24.0%
- −$119
- After-tax cash flow
- $2,498/yr
For passive investors: Depreciation is non-cash, so a rental often shows a tax loss while cash-flowing — sheltering income. Rental losses are passive: they offset passive income freely, and up to $25,000/yr can offset ordinary (W-2) income if you actively participate and your MAGI is under $100k (phasing out to $0 by $150k); unused losses carry forward. On sale, claimed depreciation is recaptured at up to 25%, and gains may owe capital-gains tax (a 1031 exchange can defer both). Figures are a year-1 estimate at your 24.0% rate — not tax advice; consult a CPA.
Schools (NCES district)
- District
- Forest Park School District
- NCES district ID
- 2611190
- Math proficiency
- 27% ▼ -4.00%
- Reading proficiency
- 39% ▼ -7.00%
- Median HH income
- $38,409
- Composite
- 27.54/100
- National rank
- #6947
- State rank
- #331 of 540 in MI
Livability — Crystal Falls
- Score
- 71/100
- State rank
- #274
- US rank
- #6768
Category grades
Schools grade is shown separately in the Schools card above.
Census & demographics
- Census place
- Crystal Falls, MI
- Population (ZIP)
- 4,243
Population outlook (Iron County) Hauer SSP2
- Today (2025)
- 10,485 people
- By 2030
- 9,914 · -5.4%
- By 2040
- 8,698 · -17.0%
- By 2050
- 7,742 · -26.2%
- By 2075
- 6,485 · -38.1%
- By 2100
- 5,396 · -48.5%
Race, ethnicity, and origin ACS 2023
- Neighborhood character
- Predominantly White (92%)
- Race & ethnicity
- White 92% Two or more races 4% Hispanic / Latino 2%
- Common ancestry
- Romanian 13% Lithuanian 4% Portuguese 2%
- Foreign-born
- 1%
- Languages at home
- 98% English-only · Spanish 1%
Political lean MEDSL · Iron
- 2024 margin
- Strong R (+29.3) · D 34.7% · R 64.0% · Other 1.2%
- 2008→2024 swing
- -31.5pp toward R · 2008: 2.1pp · 2024: -29.3pp
- All cycles
- 2024: R+29.3 2020: R+25.4 2016: R+28.3 2012: R+9.0 2008: D+2.1
Not yet ingested
- Civics
- —
Market trends
- HPI YoY
- ▼ -41.03%
- Current HPI
- 179.7039
- Rent YoY
- —
- Metro
- —
- State GDP YoY
- ▲ 1.37%
- F500 in state
- 28
Industry mix (Fortune 500 HQ in MI)
| Industry | F500 HQs | Revenue |
|---|---|---|
| Automotive Parts | 3 | $48B |
|
||
| Automotive | 2 | $372B |
|
||
| Chemicals | 1 | $45B |
|
||
| Automotive Retail | 1 | $29B |
|
||
| Healthcare / Medical Devices | 1 | $23B |
|
||
| Automotive Technology | 1 | $20B |
|
||
Price history
+136.2% since first listed10 events — show timeline
- 2026-06-01 Listed $129,900 GNMLS
- 2026-06-01 Listed $129,900 UPAR
- 2026-06-01 Listed $129,900 MiRealSource-MiMLS
- 2021-06-15 Sold (MLS) $61,000 UPAR
- 2021-05-06 Sold (Public Records) $62,000 Public Records
- 2021-02-23 Listed $67,000 UPAR
- 2016-12-13 Sold (Public Records) $52,000 Public Records
- 2016-12-13 Sold (MLS) $52,000 UPAR
- 2016-08-26 Listed $55,000 UPAR
- 2008-05-23 Sold (Public Records) $55,000 Public Records
Property tax history
-1.8%/yrLatest (2025): $575 · -61.8% YoY. Source: county tax records.
Cash-flow waterfall
monthlySold comps — $/sqft
last 12 mo · ≤1 miLoading sold comps…