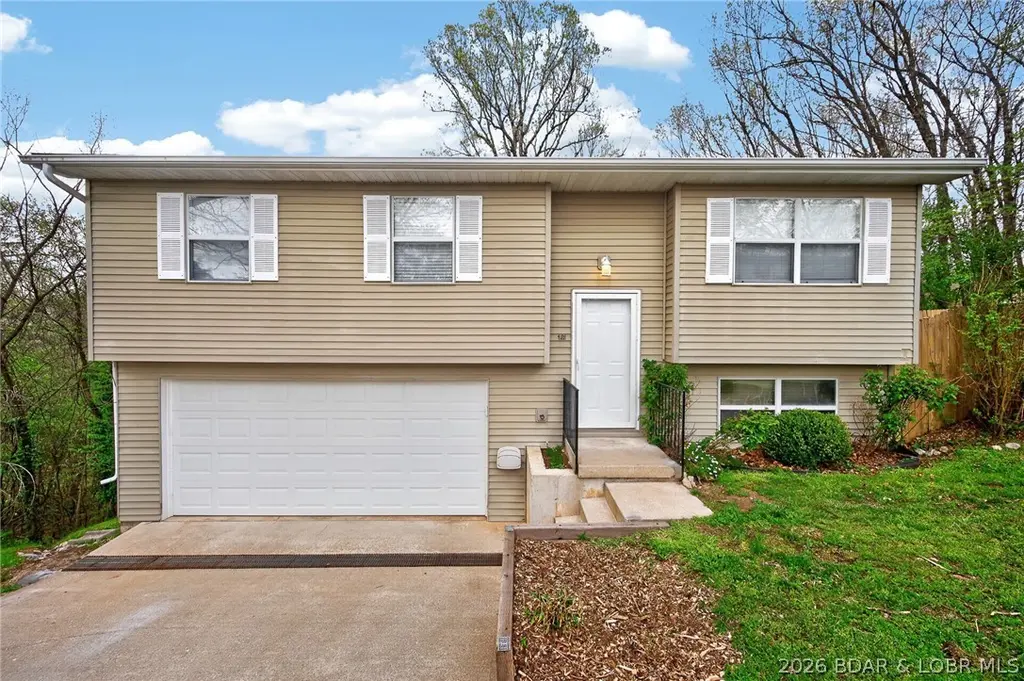
401 Christopher Dr Dr · Camdenton, MO
Flood risk 1/10 · Minimal
- FEMA flood zone
- X (unshaded)
- Chance of flooding over 30 yrs
- 0.0%
- Est. flood insurance / yr
- $473 – $860
Fire risk 4/10 · Minor
- Est. fire insurance / yr
- $1,054 – $1,958
Heat risk 4/10 · Minor
- Hot days now (above 106°F)
- 7 days/yr
- Hot days in 30 yrs
- 19 days/yr
Wind risk 2/10 · Minimal
- Chance of severe wind over 30 yrs
- 0.0%
Air-quality risk 2/10 · Minimal
- Unhealthy air days now
- 1 days/yr
- Unhealthy air days in 30 yrs
- 1 days/yr
Risk factors via First Street. Map © Google.
Why this score? — see what drove the C- grade
The composite is a weighted blend of 9 inputs, each scored 0–100. Each bar is that input's sub-score; the figure is the points it added to the 100-point composite (weight × sub-score).
- Cash flow +15.4/30.0
- ARV discount +15.0/15.0
- DSCR +4.7/10.0
- Schools +4.0/10.0
- Livability +3.4/5.0
- 1% rule +3.0/10.0
- Rent growth +2.5/5.0
- Condition / age +2.5/5.0
- Appreciation +0.0/10.0
$225,000
🖨 Deal sheet (PDF) 📄 Offer letter ✓ Due diligence
Listing remarks
Welcome home to this inviting 4-bedroom property tucked away on a quiet cul-de-sac in the desirable Seven Trails West subdivision in Camdenton! This home offers comfort, space, and convenience. The functional layout provides room for family, guests, a home office, or hobbies, while the partially finished lower level adds flexibility and opportunity. The second full bathroom has already been started, making it easy to finish to create an en suite 4th bedroom and add even more equity. Step outside to enjoy the large, fully fenced backyard with peaceful wooded privacy—perfect for kids, pets, entertaining, or relaxing evenings on the deck. A two-car garage offers ample storage and conven
Key facts
- Wooded privacy
- Two-car garage
- Minutes from schools
Tags
Property features AI
Finance
- Other: Half-acre lot (approximately 0.5 acres, 100 x 100 dimensions); Located in the Seven Trails West subdivision
- HOA & community: Homeowners association with an annual fee of $100 (includes sewer)
Exterior
- Parking: Attached garage with 2 spaces; Concrete driveway; Garage door opener
- Utilities: Public water; Public sewer
- Home design: Single-family detached residence; Multi/split levels
- Construction: Vinyl siding
- Exterior features: Deck; City lot; Asphalt/paved road; Private maintained road
Interior
- Kitchen: Cooktop; Dishwasher; Microwave; Range; Refrigerator
- Flooring: Tile
- Bathrooms: 1 full bathroom; 1 half bathroom
- Heating & cooling: Central air conditioning; Ceiling fan(s); Electric forced-air heating
- Interior features: Ceiling fans
Neighborhood map
What this means for you Summary
Snapshot
- This is a 4-bed/1.5-bath other listed at $225k.
Deal economics
- At list price, monthly cash flow is $86 ($1k/yr) — positive.
- The deal already cash-flows at list — no discount required.
- To meet the 1% rule (rent ≥ 1% of price), the offer needs to be $180k (20.1% below list).
- Recommended offer: $180k (20.1% below list) — sets the bar for 1% rule.
- Cap rate 6.8% vs local median 2.1% in Camdenton — top-decile yield for the area; either an underpriced asset or a hidden risk that comps aren't pricing in. Stress-test before assuming the spread holds.
Location & tenants
- Location reads 68/100 on livability (#186 in MO) — a middle-class / working-renter tenant base. Strengths: cost of living A+, housing A+; Watch: employment D, schools D-, amenities F.
- Camdenton R-III (rural): math 46% / reading 48% proficiency, ranked #68 of 324 in MO (top 21%) — families likely to look elsewhere, expect single-tenant / working-renter base with shorter leases.
- Market conditions: 416 active listings in the ZIP; 272 units permitted in Camden County in 2024 (0 in 5+ unit buildings).
- This rent runs 35% of the median local income ($62k/yr) — at the standard rent-burdened threshold; future hikes will face affordability resistance.
Forward outlook
- Local home prices are declining (-3.0%/yr); year-one equity from $2k of loan paydown is wiped out by about $7k of value loss. Plan a longer hold.
- Camden County population projected to shrink 6% by 2050 — rents likely to lag national; underwrite the cash flow, not the appreciation.
Negotiation context
- Only 12 days on market — expect competitive offers; lowballing is unlikely to land.
Questions for the listing agent
- What does the HOA fee cover, when was the last increase, and are there any pending special assessments or reserve-fund shortfalls?
- Is there a deadline driving the sale (1031 exchange, divorce, estate, relocation)? That informs how much negotiation room exists.
- Schools are D-rated, which usually means shorter tenancies and higher turnover. Who's the typical renter profile here, and what's been the actual vacancy rate?
- What's the average days-on-market for RENTAL listings here right now (not sales)? A rising rental-DOM trend means longer vacancies and softer asking-rent achievability than the comps imply.
- What's the recent tenant-quality profile in this submarket — average credit score on applications, eviction rate, late-payment / NSF rate, and stable-employment percentage? A property-management company in the area should have these aggregated.
- How much new for-sale + rental construction is in the pipeline within 1–3 miles? Heavy new supply typically softens prices + rents 12–24 months out; constrained supply supports both.
Investment metrics
- 1% rule
- 0.80% ✗
- Cap rate
- 6.75%
- Cash-on-cash
- 1.64%
- DSCR
- 1.07
- GRM
- 10.4
CMA / ARV
- ARV (median comp)
- $306,556
- List price
- $225,000
- Delta
- -25.30%
- Verdict
- UNDERPRICED
- Comps
- 2 within 1.0 mi
Projected returns pro-forma
-3.0% appreciation · 3.0% rent growth · sell at horizon
- IRR
- -13.8%
- Equity multiple
- 0.51×
- Total profit
- $-31,090
- Equity at exit
- $33,548
- IRR
- -5.0%
- Equity multiple
- 0.68×
- Total profit
- $-20,460
- Equity at exit
- $19,454
Cash invested: $63,000 (down + closing). Projections, not guarantees.
Landlord ↔ Tenant lean methodology
- Overall (STATE)
- 81 Strongly Landlord-Friendly
- State Missouri
- 81 Strongly Landlord-Friendly · R+10
- County
- — inherits STATE
- City
- — inherits STATE
ZIP-level market 65020
- Home prices YoY
- -32.9%
- Active inventory
- 416
- Price-to-rent
- 10.4×
Monthly cashflow live
- Estimated rent
- $1,797 medium interval (Pro) →
- Mortgage (P&I)
- −$1,180
- Tax from tax record
- −$52 /mo · $623/yr
- Insurance
- −$94
- HOA
- −$8
- Vacancy / Maint / Mgmt
- −$377
- Net cashflow
- $86
Break-even live
Sensitivity live
| Price | -10% $213 | -5% $150 | +0% $86 | +5% $22 | +10% $-41 |
|---|---|---|---|---|---|
| Rent | -10% $-56 | -5% $15 | +0% $86 | +5% $157 | +10% $228 |
| Rate | -1.0pp $199 | -0.5pp $143 | base $86 | +0.5pp $28 | +1.0pp $-32 |
UW: 25.0% down · 7.5% · 30yr · 1.5% tax · 5.0% vac · 8.0% maint · 8.0% mgmt
Financing live
Cash to close
- Down payment
- $56,250
- Closing costs
- $6,750
- Reserves months
- —
- Total cash needed
- —
Loan-product check · same deal, 3 products live
Conventional
25% down · 7.5% · 30yr
- Down + closing
- —
- Monthly P&I
- —
- Monthly cashflow
- —
- DSCR
- —
- Eligible?
- —
Personal DTI + credit; lowest rate.
DSCR
20% down · 8.5% · 30yr
- Down + closing
- —
- Monthly P&I
- —
- Monthly cashflow
- —
- DSCR
- —
- Eligible?
- —
No personal income docs; deal must DSCR.
Hard money
10% down · 12.0% · 12mo
- Down + closing
- —
- Monthly P&I
- —
- Monthly cashflow
- —
- DSCR
- —
- Eligible?
- —
Short-term bridge; refi at stabilization.
HOA detail
- Monthly dues
- $8 · $96/yr
Listing history 18 events
-
2026-06-19days on market $225,000 Active 12 DOM
-
2026-06-18days on market $225,000 Active 11 DOM
-
2026-06-17days on market $225,000 Active 10 DOM
-
2026-06-16days on market $225,000 Active 9 DOM
-
2026-06-15days on market $225,000 Active 8 DOM
-
2026-06-14days on market $225,000 Active 6 DOM
-
2026-06-12days on market $225,000 Active 5 DOM
-
2026-06-09days on market $225,000 Active 2 DOM
-
2026-06-08pricedays on market $225,000 Active 1 DOM
-
2026-06-05days on market $229,000 Active 51 DOM
-
2026-06-03days on market $229,000 Active 50 DOM
-
2026-06-02days on market $229,000 Active 49 DOM
-
2026-06-01days on market $229,000 Active 48 DOM
-
2026-05-31days on market $229,000 Active 47 DOM
-
2026-05-30days on market $229,000 Active 46 DOM
-
2026-04-30price $232,000 810-char remark
-
2026-04-14$235,000 Active 810-char remark
-
1998-12-01soldstatus
ⓘ Source: listings_history table (triggers on properties + properties_extension) + one-shot
backfill from property_details.listing_events for pre-trigger history.
Tax reassessment forecast MO · Resets to sale price
- Current annual tax
- $623 · $52/mo
- Projected year-2 tax
- $2,182 · $182/mo
- Expected delta
- +$1,560/yr (+$130/mo · 250.5%)
ⓘ Screening estimate from a state-policy table — verify with the county assessor before closing.
Climate risk First Street
- Flood 1/10 Low FEMA zone X (unshaded) · 0% chance over 30 yrs
- Wildfire 4/10 Moderate
- Heat 4/10 Moderate 7 d/yr ≥106°F today · 19 d/yr by 30 yrs out
- Wind 2/10 Low 0% chance of damaging wind over 30 yrs
- Air quality 2/10 Low 1 unhealthy d/yr today · 1 by 30 yrs out
Nearby sold comps map
Loading sold comps map…
Walkable amenities ~0.75 mi
Loading nearby amenities…
Taxation est. · year 1
- Rental income
- $21,563
- − Mortgage interest
- −$12,603
- − Property taxes
- −$623
- − Insurance
- −$1,125
- − Repairs & maintenance
- −$1,725
- − Management
- −$1,725
- − HOA
- −$96
- − Depreciation
- −$6,545
- Taxable loss
- −$2,879
- Est. tax savings @ 24.0%
- +$691
- After-tax cash flow
- $1,723/yr
For passive investors: Depreciation is non-cash, so a rental often shows a tax loss while cash-flowing — sheltering income. Rental losses are passive: they offset passive income freely, and up to $25,000/yr can offset ordinary (W-2) income if you actively participate and your MAGI is under $100k (phasing out to $0 by $150k); unused losses carry forward. On sale, claimed depreciation is recaptured at up to 25%, and gains may owe capital-gains tax (a 1031 exchange can defer both). Figures are a year-1 estimate at your 24.0% rate — not tax advice; consult a CPA.
Schools (NCES district)
- District
- Camdenton R-III
- NCES district ID
- 2906990
- Math proficiency
- 46% ▲ 10.00%
- Reading proficiency
- 48% ▲ 1.00%
- Median HH income
- $46,496
- Composite
- 39.96/100
- National rank
- #3838
- State rank
- #68 of 324 in MO
Livability — Camdenton
- Score
- 68/100
- State rank
- #186
- US rank
- #9869
Category grades
Schools grade is shown separately in the Schools card above.
Census & demographics
- County
- Camden County · 21,945 people
- City population
- 14,748
- Metro
- nan
- Population (ZIP)
- 14,748
- Household income
- $62,392
- Rent vs Own
- Severe rent burden
- 166.0
Population outlook (Camden County) Hauer SSP2
- Today (2025)
- 44,585 people
- By 2030
- 44,476 · -0.2%
- By 2040
- 43,513 · -2.4%
- By 2050
- 41,705 · -6.5%
- By 2075
- 36,903 · -17.2%
- By 2100
- 30,164 · -32.3%
Race, ethnicity, and origin ACS 2023
- Neighborhood character
- Predominantly White (90%)
- Race & ethnicity
- White 90% Hispanic / Latino 5% Two or more races 4%
- Hispanic origin (detail)
- Mexican 3%
- Common ancestry
- Lithuanian 4% Slovak 2% Romanian 2%
- Foreign-born
- 2% · Canada
- Languages at home
- 95% English-only · Spanish 2% German/W. Germanic 1% Russian/Polish/Slavic 1%
Political lean MEDSL · Camden
- 2024 margin
- Solid R (+54.3) · D 22.4% · R 76.7%
- 2008→2024 swing
- -25.8pp toward R · 2008: -28.5pp · 2024: -54.3pp
- All cycles
- 2024: R+54.3 2020: R+53.2 2016: R+54.2 2012: R+39.3 2008: R+28.5
Not yet ingested
- Civics
- —
Market trends
- HPI YoY
- ▼ -90.71%
- Current HPI
- 185.4254
- Rent YoY
- —
- Metro
- nan
- State GDP YoY
- ▲ 1.84%
- F500 in state
- 20
Industry mix (Fortune 500 HQ in MO)
| Industry | F500 HQs | Revenue |
|---|---|---|
| Healthcare | 1 | $163B |
|
||
| Insurance | 1 | $21B |
|
||
| Industrial Technology | 1 | $17B |
|
||
| Retail | 1 | $16B |
|
||
| Industrial Distribution | 1 | $10B |
|
||
| Utilities | 1 | $9B |
|
||
Price history
-3.0% since first listed4 events — show timeline
- 2026-06-07 Listed $225,000 LOBR
- 2026-05-22 Price Changed $229,000 LOBR
- 2026-04-30 Price Changed $232,000 LOBR
- 1998-12-01 Sold (Public Records) — Public Records
Property tax history
+0.6%/yrLatest (2025): $623 · +3.4% YoY. Source: county tax records.
Cash-flow waterfall
monthlySold comps — $/sqft
last 12 mo · ≤1 miLoading sold comps…