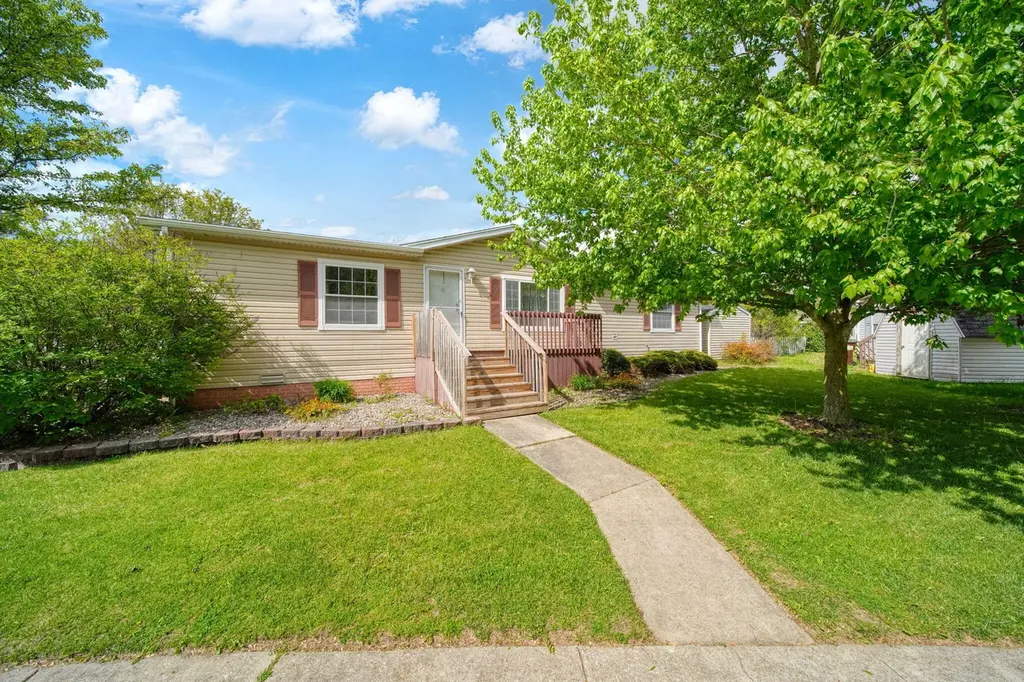
704 Hidden River Dr · Adrian, MI
Flood risk 1/10 · Minimal
- FEMA flood zone
- X (unshaded)
- Chance of flooding over 30 yrs
- 0.0%
- Est. flood insurance / yr
- $473 – $860
Fire risk 1/10 · Minimal
- Est. fire insurance / yr
- $784 – $1,456
Heat risk 3/10 · Minor
- Hot days now (above 98°F)
- 7 days/yr
- Hot days in 30 yrs
- 16 days/yr
Wind risk 2/10 · Minimal
- Chance of severe wind over 30 yrs
- —
Air-quality risk 2/10 · Minimal
- Unhealthy air days now
- 1 days/yr
- Unhealthy air days in 30 yrs
- 2 days/yr
Risk factors via First Street. Map © Google.
Why this score? — see what drove the B- grade
The composite is a weighted blend of 9 inputs, each scored 0–100. Each bar is that input's sub-score; the figure is the points it added to the 100-point composite (weight × sub-score).
- Cash flow +30.0/30.0
- 1% rule +10.0/10.0
- DSCR +10.0/10.0
- ARV discount +7.5/15.0
- Schools +3.5/10.0
- Livability +3.5/5.0
- Rent growth +2.5/5.0
- Condition / age +2.5/5.0
- Appreciation +0.0/10.0
$69,900
🖨 Deal sheet (PDF) 📄 Offer letter ✓ Due diligence
Listing remarks MLS
Home for Sale in Hidden River North! This home is in great condition and move-in ready! Features a nice corner lot, 3 bedrooms, 2 full baths, updated flooring and paint, updated light fixtures, open living/dining area, fireplace, deck and a carport. Base lot rent is $750/mo.
Key facts
- Carport
- Deck
- Updated flooring
Tags
Property features AI
Exterior
- Utilities: Public water
- Home design: Ranch-style residence; Built in 2000
- Construction: Vinyl siding
- Exterior features: Corner lot; Shed(s)
Interior
- Kitchen: Kitchen: 13 x 13; Oven; Range; Refrigerator; Dishwasher
- Bedrooms: Primary bedroom: 13 x 13; Bedroom 2: 12 x 10; Bedroom 3: 13 x 10
- Bathrooms: 2 full bathrooms
- Heating & cooling: Forced air heating; Has cooling
- Interior features: 6 total rooms; Basement (other)
- Laundry & utility: Washer; Dryer
Neighborhood map
What this means for you Summary
Snapshot
- This is a 3-bed/2.0-bath other listed at $70k.
Deal economics
- At list price, monthly cash flow is $1k ($16k/yr) — positive.
- The deal already cash-flows at list — no discount required.
- Meets the 1% rule at list price ($2k rent vs $70k).
- Recommended offer: $68k (3.0% below list) — sets the bar for market timing.
- Cap rate 28.5% vs local median 5.5% in Adrian — top-decile yield for the area; either an underpriced asset or a hidden risk that comps aren't pricing in. Stress-test before assuming the spread holds.
Location & tenants
- Location reads 69/100 on livability (#342 in MI) — a middle-class / working-renter tenant base. Strengths: cost of living A+, housing A+, health & safety A+; Watch: amenities D, crime F, commute F.
- Madison School District (Lenawee) (town): math 34% / reading 51% proficiency, ranked #195 of 540 in MI (top 36%) — families likely to look elsewhere, expect single-tenant / working-renter base with shorter leases.
- Market conditions: 212 active listings in the ZIP; 1 comparable units currently listed for rent nearby; 137 units permitted in Lenawee County in 2024 (0 in 5+ unit buildings).
Forward outlook
- Local home prices are declining (-3.0%/yr); year-one equity from $483 of loan paydown is wiped out by about $2k of value loss. Plan a longer hold.
- Lenawee County population projected at -18% by 2050 — secular population decline; favor cash flow + early exit over multi-decade hold.
- At projected returns (-3.0% appreciation + 3.0% rent growth), your $20k cash investment doubles in ~2 years — after that, you're playing with house money.
Negotiation context
- It's been on market 38 days — a 3% lower offer ($68k) is reasonable based on typical stale-listing flexibility.
- 3 sale attempts with the ask held roughly flat each time — persistent listings suggest the price (not the market) is what's stuck; bring a comps-based counter.
Questions for the listing agent
- It's been on market 38 days. Have you received any prior offers? Is the seller open to a 3% concession, seller financing, or rate buy-down credit?
- Is there a deadline driving the sale (1031 exchange, divorce, estate, relocation)? That informs how much negotiation room exists.
- Crime grade is F in this area — have there been break-ins, vandalism, or insurance claims at this property in the last 3 years? What carrier currently insures it and at what premium?
- What's the average days-on-market for RENTAL listings here right now (not sales)? A rising rental-DOM trend means longer vacancies and softer asking-rent achievability than the comps imply.
- What's the recent tenant-quality profile in this submarket — average credit score on applications, eviction rate, late-payment / NSF rate, and stable-employment percentage? A property-management company in the area should have these aggregated.
- How much new for-sale + rental construction is in the pipeline within 1–3 miles? Heavy new supply typically softens prices + rents 12–24 months out; constrained supply supports both.
Investment metrics
- 1% rule
- 3.22% ✓
- Cap rate
- 28.52%
- Cash-on-cash
- 79.36%
- DSCR
- 4.53
- GRM
- 2.6
CMA / ARV
No comps found within radius.
Projected returns pro-forma
-3.0% appreciation · 3.0% rent growth · sell at horizon
- IRR
- 79.5%
- Equity multiple
- 4.64×
- Total profit
- $71,151
- Equity at exit
- $10,422
- IRR
- 83.0%
- Equity multiple
- 9.60×
- Total profit
- $168,254
- Equity at exit
- $6,044
Cash invested: $19,572 (down + closing). Projections, not guarantees.
Landlord ↔ Tenant lean methodology
- Overall (STATE)
- 62 Landlord-Friendly
- State Michigan
- 62 Landlord-Friendly · EVEN
- County
- — inherits STATE
- City
- — inherits STATE
ZIP-level market 49221
- Active inventory
- 212
- Price-to-rent
- 2.6×
Monthly cashflow live
- Estimated rent
- $2,250 medium interval (Pro) →
- Mortgage (P&I)
- −$367
- Tax est. 1.5%
- −$87 /mo · $1,048/yr
- Insurance
- −$29
- HOA
- −$0
- Vacancy / Maint / Mgmt
- −$472
- Net cashflow
- $1,294
Break-even live
Sensitivity live
| Price | -10% $1,343 | -5% $1,319 | +0% $1,294 | +5% $1,270 | +10% $1,246 |
|---|---|---|---|---|---|
| Rent | -10% $1,117 | -5% $1,206 | +0% $1,294 | +5% $1,383 | +10% $1,472 |
| Rate | -1.0pp $1,330 | -0.5pp $1,312 | base $1,294 | +0.5pp $1,276 | +1.0pp $1,258 |
UW: 25.0% down · 7.5% · 30yr · 1.5% tax · 5.0% vac · 8.0% maint · 8.0% mgmt
Financing live
Cash to close
- Down payment
- $17,475
- Closing costs
- $2,097
- Reserves months
- —
- Total cash needed
- —
Loan-product check · same deal, 3 products live
Conventional
25% down · 7.5% · 30yr
- Down + closing
- —
- Monthly P&I
- —
- Monthly cashflow
- —
- DSCR
- —
- Eligible?
- —
Personal DTI + credit; lowest rate.
DSCR
20% down · 8.5% · 30yr
- Down + closing
- —
- Monthly P&I
- —
- Monthly cashflow
- —
- DSCR
- —
- Eligible?
- —
No personal income docs; deal must DSCR.
Hard money
10% down · 12.0% · 12mo
- Down + closing
- —
- Monthly P&I
- —
- Monthly cashflow
- —
- DSCR
- —
- Eligible?
- —
Short-term bridge; refi at stabilization.
Rent comps 1 comps
| Address | Beds | Baths | Sqft | Rent | $/sqft | DOM | Units | Dist |
|---|---|---|---|---|---|---|---|---|
| 1962 W Cadmus Rd Adrian, MI | 3.0 | 2.0 | 1170 | $2,250 | $1.92 | 22d | 1 | 0.79mi |
Listing history 19 events
-
2026-06-21days on market $69,900 Active 38 DOM
-
2026-06-18days on market $69,900 Active 36 DOM
-
2026-06-17days on market $69,900 Active 35 DOM
-
2026-06-16days on market $69,900 Active 34 DOM
-
2026-06-15days on market $69,900 Active 33 DOM
-
2026-06-13days on market $69,900 Active 31 DOM
-
2026-06-12days on market $69,900 Active 30 DOM
-
2026-06-09days on market $69,900 Active 27 DOM
-
2026-06-08days on market $69,900 Active 26 DOM
-
2026-06-07days on market $69,900 Active 25 DOM
-
2026-06-05days on market $69,900 Active 23 DOM
-
2026-06-04days on market $69,900 Active 21 DOM
-
2026-06-02days on market $69,900 Active 20 DOM
-
2026-06-01days on market $69,900 Active 19 DOM
-
2026-05-31days on market $69,900 Active 18 DOM
-
2026-05-31days on market $69,900 Active 17 DOM
-
2026-05-13$69,900 Active 275-char remark
Show marketing remark (275 chars)
Home for Sale in Hidden River North! This home is in great condition and move-in ready! Features a nice corner lot, 3 bedrooms, 2 full baths, updated flooring and paint, updated light fixtures, open living/dining area, fireplace, deck and a carport. Base lot rent is $750/mo.
-
2026-05-13$69,900 Active
Show marketing remark (275 chars)
Home for Sale in Hidden River North! This home is in great condition and move-in ready! Features a nice corner lot, 3 bedrooms, 2 full baths, updated flooring and paint, updated light fixtures, open living/dining area, fireplace, deck and a carport. Base lot rent is $750/mo.
-
2026-05-13$69,900 Active 275-char remark
Show marketing remark (275 chars)
Home for Sale in Hidden River North! This home is in great condition and move-in ready! Features a nice corner lot, 3 bedrooms, 2 full baths, updated flooring and paint, updated light fixtures, open living/dining area, fireplace, deck and a carport. Base lot rent is $750/mo.
ⓘ Source: listings_history table (triggers on properties + properties_extension) + one-shot
backfill from property_details.listing_events for pre-trigger history.
Climate risk First Street
- Flood 1/10 Low FEMA zone X (unshaded) · 0% chance over 30 yrs
- Wildfire 1/10 Low
- Heat 3/10 Moderate 7 d/yr ≥98°F today · 16 d/yr by 30 yrs out
- Wind 2/10 Low
- Air quality 2/10 Low 1 unhealthy d/yr today · 2 by 30 yrs out
Nearby sold comps map
Loading sold comps map…
Walkable amenities ~0.75 mi
Loading nearby amenities…
Taxation est. · year 1
- Rental income
- $27,000
- − Mortgage interest
- −$3,915
- − Property taxes
- −$1,048
- − Insurance
- −$350
- − Repairs & maintenance
- −$2,160
- − Management
- −$2,160
- − Depreciation
- −$2,033
- Taxable income
- $15,333
- Est. tax owed @ 24.0%
- −$3,680
- After-tax cash flow
- $11,853/yr
For passive investors: Depreciation is non-cash, so a rental often shows a tax loss while cash-flowing — sheltering income. Rental losses are passive: they offset passive income freely, and up to $25,000/yr can offset ordinary (W-2) income if you actively participate and your MAGI is under $100k (phasing out to $0 by $150k); unused losses carry forward. On sale, claimed depreciation is recaptured at up to 25%, and gains may owe capital-gains tax (a 1031 exchange can defer both). Figures are a year-1 estimate at your 24.0% rate — not tax advice; consult a CPA.
Schools (NCES district)
- District
- Madison School District (Lenawee)
- NCES district ID
- 2622320
- Math proficiency
- 34% ▼ -10.00%
- Reading proficiency
- 51% ▼ -5.00%
- Median HH income
- $37,961
- Composite
- 35.35/100
- National rank
- #4959
- State rank
- #195 of 540 in MI
Livability — Adrian
- Score
- 69/100
- State rank
- #342
- US rank
- #8722
Category grades
Schools grade is shown separately in the Schools card above.
Census & demographics
- Census place
- Adrian, MI
- City population
- 41,041
- Population (ZIP)
- 41,041
Population outlook (Lenawee County) Hauer SSP2
- Today (2025)
- 95,497 people
- By 2030
- 92,722 · -2.9%
- By 2040
- 85,641 · -10.3%
- By 2050
- 77,971 · -18.4%
- By 2075
- 60,043 · -37.1%
- By 2100
- 41,468 · -56.6%
Race, ethnicity, and origin ACS 2023
- Neighborhood character
- Predominantly White (77%)
- Race & ethnicity
- White 77% Hispanic / Latino 14% Two or more races 8% Black 4%
- Hispanic origin (detail)
- Mexican 12%
- Common ancestry
- Romanian 3% Lithuanian 3% Italian 2%
- Foreign-born
- 3% · Canada
- Languages at home
- 93% English-only · Spanish 6% Arabic 1%
Political lean MEDSL · Lenawee
- 2024 margin
- Strong R (+23.0) · D 37.8% · R 60.8% · Other 1.4%
- 2008→2024 swing
- -28.1pp toward R · 2008: 5.1pp · 2024: -23.0pp
- All cycles
- 2024: R+23.0 2020: R+19.9 2016: R+21.1 2012: R+1.3 2008: D+5.1
Not yet ingested
- Civics
- —
Market trends
- HPI YoY
- ▼ -143.64%
- Current HPI
- 237.3796
- Rent YoY
- —
- Metro
- —
- State GDP YoY
- ▲ 1.37%
- F500 in state
- 28
Industry mix (Fortune 500 HQ in MI)
| Industry | F500 HQs | Revenue |
|---|---|---|
| Automotive Parts | 3 | $48B |
|
||
| Automotive | 2 | $372B |
|
||
| Chemicals | 1 | $45B |
|
||
| Automotive Retail | 1 | $29B |
|
||
| Healthcare / Medical Devices | 1 | $23B |
|
||
| Automotive Technology | 1 | $20B |
|
||
Price history
+0.0% since first listed3 events — show timeline
- 2026-05-13 Listed $69,900 REALCOMP
- 2026-05-13 Listed $69,900 MiRealSource-MiMLS
- 2026-05-13 Listed $69,900 SW Michigan MLS
Property tax history
+1.2%/yrLatest (2025): $99 · -12.7% YoY. Source: county tax records.
Cash-flow waterfall
monthlySold comps — $/sqft
last 12 mo · ≤1 miLoading sold comps…