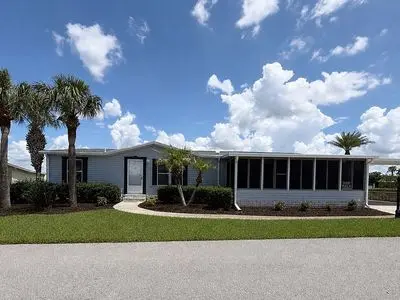
702 Skyview St · Four Corners, FL
Flood risk No data
- FEMA flood zone
- —
- Chance of flooding over 30 yrs
- —
- Est. flood insurance / yr
- —
Fire risk No data
- Est. fire insurance / yr
- —
Heat risk No data
- Hot days now (above threshold)
- —
- Hot days in 30 yrs
- —
Wind risk No data
- Chance of severe wind over 30 yrs
- —
Air-quality risk No data
- Unhealthy air days now
- —
- Unhealthy air days in 30 yrs
- —
Risk factors via First Street. Map © Google.
Why this score? — see what drove the B grade
The composite is a weighted blend of 9 inputs, each scored 0–100. Each bar is that input's sub-score; the figure is the points it added to the 100-point composite (weight × sub-score).
- Cash flow +30.0/30.0
- 1% rule +10.0/10.0
- DSCR +10.0/10.0
- ARV discount +7.5/15.0
- Appreciation +4.7/10.0
- Condition / age +3.8/5.0
- Schools +3.5/10.0
- Livability +3.5/5.0
- Rent growth +1.8/5.0
$99,999
🖨 Deal sheet 📄 Offer letter ✓ Due diligence
Listing remarks
Resort-Style 55+ Living Near Disney! Welcome home to this beautifully maintained property situated on a spacious corner lot in a highly sought-after 55+ active adult community! Offering the perfect blend of comfort, convenience, and lifestyle, this home features a versatile bonus room, a convenient utility/golf cart garage, and a covered carport for additional parking and storage. Inside, you& apos; ll love the spacious layout, complete with a walk-in pantry, a laundry room with utility sink, and an oversized primary suite featuring a large walk-in closet. Recent updates include a new A/C system and new luxury vinyl plank flooring in the living room, dining room, and hallway. Tile and
Key facts
- Covered carport
- Laundry room
- Bonus room
Tags
Neighborhood map
What this means for you Summary
Snapshot
- This is a 3-bed/2.0-bath other listed at $100k. Condition is rated good.
Deal economics
- At list price, monthly cash flow is $1k ($14k/yr) — positive.
- The deal already cash-flows at list — no discount required.
- Meets the 1% rule at list price ($2k rent vs $100k).
- Cap rate 19.8% vs local median 3.2% in Four Corners — top-decile yield for the area; either an underpriced asset or a hidden risk that comps aren't pricing in. Stress-test before assuming the spread holds.
Location & tenants
- Location reads 69/100 on livability (#453 in FL) — a middle-class / working-renter tenant base. Strengths: housing A+, cost of living A-; Watch: schools F, amenities F, health & safety F.
- Polk (suburban): math 39% / reading 43% proficiency, ranked #62 of 73 in FL (top 85%) — families likely to look elsewhere, expect single-tenant / working-renter base with shorter leases.
- Market conditions: Rents soft (-2.7%/yr); 646 active listings in the ZIP; 40 comparable units currently listed for rent nearby; rentals at typical pace (median 19d on market — plan ~3-4 weeks tenant-placement turnaround); 10,384 units permitted in Polk County in 2024 (1,716 in 5+ unit buildings).
- This rent runs 39% of the median local income ($71k/yr) — at the standard rent-burdened threshold; future hikes will face affordability resistance.
Forward outlook
- In year one you build about $82 of equity ($691 loan paydown + $-609 appreciation (-0.6% local appreciation)).
- Polk County population projected at +33% by 2050 — long-run rental-demand tailwind backs the buy-and-hold thesis.
- At projected returns (-0.6% appreciation + 0.0% rent growth), your $28k cash investment doubles in ~3 years — after that, you're playing with house money.
Negotiation context
- Only 5 days on market — expect competitive offers; lowballing is unlikely to land.
Questions for the listing agent
- Is there a deadline driving the sale (1031 exchange, divorce, estate, relocation)? That informs how much negotiation room exists.
- Schools are F-rated, which usually means shorter tenancies and higher turnover. Who's the typical renter profile here, and what's been the actual vacancy rate?
- What's the average days-on-market for RENTAL listings here right now (not sales)? A rising rental-DOM trend means longer vacancies and softer asking-rent achievability than the comps imply.
- What's the recent tenant-quality profile in this submarket — average credit score on applications, eviction rate, late-payment / NSF rate, and stable-employment percentage? A property-management company in the area should have these aggregated.
- How much new for-sale + rental construction is in the pipeline within 1–3 miles? Heavy new supply typically softens prices + rents 12–24 months out; constrained supply supports both.
Investment metrics
- 1% rule
- 2.30% ✓
- Cap rate
- 19.82%
- Cash-on-cash
- 48.30%
- DSCR
- 3.15
- GRM
- 3.6
CMA / ARV
No comps found within radius.
Projected returns pro-forma
-0.61% appreciation · 0.0% rent growth · sell at horizon
- IRR
- 45.8%
- Equity multiple
- 3.12×
- Total profit
- $59,313
- Equity at exit
- $26,028
- IRR
- 47.8%
- Equity multiple
- 5.58×
- Total profit
- $128,160
- Equity at exit
- $28,977
Cash invested: $28,000 (down + closing). Projections, not guarantees.
Landlord ↔ Tenant lean methodology
- Overall (STATE)
- 87 Strongly Landlord-Friendly
- State Florida
- 87 Strongly Landlord-Friendly · R+3
- County
- — inherits STATE
- City
- — inherits STATE
ZIP-level market 33897
- Home prices YoY
- -0.3%
- Rents YoY
- -2.7%
- Active inventory
- 646
- Price-to-rent
- 3.6×
Monthly cashflow live
- Estimated rent
- $2,301 high interval (Pro) →
- Mortgage (P&I)
- −$524
- Tax est. 1.5%
- −$125 /mo · $1,500/yr
- Insurance
- −$42
- HOA
- −$0
- Vacancy / Maint / Mgmt
- −$483
- Net cashflow
- $1,127
Break-even live
UW: 25.0% down · 7.5% · 30yr · 1.5% tax · 5.0% vac · 8.0% maint · 8.0% mgmt
Financing live
Cash to close
- Down payment
- $25,000
- Closing costs
- $3,000
- Reserves months
- —
- Total cash needed
- —
Loan-product check · same deal, 3 products live
Conventional
25% down · 7.5% · 30yr
- Down + closing
- —
- Monthly P&I
- —
- Monthly cashflow
- —
- DSCR
- —
- Eligible?
- —
Personal DTI + credit; lowest rate.
DSCR
20% down · 8.5% · 30yr
- Down + closing
- —
- Monthly P&I
- —
- Monthly cashflow
- —
- DSCR
- —
- Eligible?
- —
No personal income docs; deal must DSCR.
Hard money
10% down · 12.0% · 12mo
- Down + closing
- —
- Monthly P&I
- —
- Monthly cashflow
- —
- DSCR
- —
- Eligible?
- —
Short-term bridge; refi at stabilization.
Rent comps 40 comps
| Address | Beds | Baths | Sqft | Rent | $/sqft | DOM | Units | Dist |
|---|---|---|---|---|---|---|---|---|
| 605 Blake Ave Davenport, FL | 4.0 | 2.0 | 1855 | $2,200 | $1.19 | 23d | 1 | 0.17mi |
| 750 Kettering Rd Davenport, FL | 4.0 | 3.0 | 1960 | $2,550 | $1.30 | 23d | 1 | 0.21mi |
| 730 Kettering Rd Davenport, FL | 4.0 | 3.0 | 1960 | $3,200 | $1.63 | 23d | 1 | 0.22mi |
| 2010 Limetta DR Davenport, FL | 1.0–3.0 | 1.0–2.0 | 1178 | $2,429 | $2.06 | 3d | 15 | 0.22mi |
| 183 Jocelyn Dr Davenport, FL | 4.0 | 2.0 | 1874 | $2,400 | $1.28 | 19d | 1 | 0.25mi |
| 237 Somerset Dr Davenport, FL | 2.0 | 1.0 | 1330 | $1,900 | $1.43 | 23d | 1 | 0.41mi |
| 722 Washington Palm Loop Davenport, FL | 3.0 | 2.5 | 1811 | $1,550 | $0.86 | 23d | 1 | 0.43mi |
| 136 Grantham Dr Davenport, FL | 3.0 | 2.0 | 1799 | $1,995 | $1.11 | 3d | 1 | 0.43mi |
| 406 Washington Palm Loop Davenport, FL | 3.0 | 2.0 | 1764 | $1,525 | $0.86 | 14d | 1 | 0.44mi |
| 631 Washington Palm Loop Davenport, FL | 3.0 | 2.0 | 1387 | $1,450 | $1.05 | 23d | 1 | 0.46mi |
| 183 Ashbourne Way Davenport, FL | 1.0–3.0 | 1.0–2.0 | 1039 | $2,200 | $2.12 | 3d | 35 | 0.46mi |
| 222 Bexley Dr Davenport, FL | 2.0 | 2.5 | 1313 | $2,000 | $1.52 | 23d | 1 | 0.49mi |
| 500 Highgate Park Blvd Davenport, FL | 4.0 | 3.0 | 1830 | $2,500 | $1.37 | 23d | 1 | 0.51mi |
| 103 Coconut Palm Way Davenport, FL | 3.0 | 2.0 | 1881 | $1,525 | $0.81 | 3d | 1 | 0.52mi |
| 712 Brayton Ln Davenport, FL | 4.0 | 2.0 | 1925 | $2,180 | $1.13 | 3d | 1 | 0.53mi |
| 2918 Fan Palm Dr Unit Main Davenport, FL | 3.0 | 2.0 | 1400 | $1,800 | $1.29 | 23d | 1 | 0.56mi |
| 1560 Chelsea Dr Davenport, FL | 3.0 | 2.5 | 1528 | $2,100 | $1.37 | 23d | 1 | 0.57mi |
| 206 Scaton Way Davenport, FL | 2.0 | 2.5 | 1530 | $1,750 | $1.14 | 13d | 1 | 0.59mi |
| 625 Rochester Loop Davenport, FL | 4.0 | 2.0 | 1895 | $2,350 | $1.24 | 23d | 1 | 0.60mi |
| 400 Australian Way Unit A Davenport, FL | 3.0 | 2.0 | 1350 | $1,600 | $1.19 | 14d | 1 | 0.60mi |
| 511 Coconut Palm Way Davenport, FL | 3.0 | 2.0 | 1811 | $1,700 | $0.94 | 14d | 1 | 0.61mi |
| 1536 Mirabella Cir Unit 1536 Davenport, FL | 3.0 | 2.5 | 1567 | $2,100 | $1.34 | 23d | 1 | 0.62mi |
| 1556 Mirabella Cir Davenport, FL | 3.0 | 2.5 | 1371 | $1,950 | $1.42 | 3d | 1 | 0.62mi |
| 309 Catfish Dr E Davenport, FL | 3.0 | 2.0 | 1454 | $1,895 | $1.30 | 23d | 1 | 0.63mi |
| 1513 Mirabella Cir Davenport, FL | 3.0 | 2.5 | 1594 | $1,950 | $1.22 | 23d | 1 | 0.64mi |
| 1492 Mirabella Cir Davenport, FL | 3.0 | 2.5 | 1435 | $1,950 | $1.36 | 14d | 1 | 0.67mi |
| 1492 Mirabella Cir Davenport, FL | 3.0 | 2.0 | 1435 | $1,995 | $1.39 | 23d | 1 | 0.67mi |
| 1187 Papaya Cir Davenport, FL | 4.0 | 2.0 | 1699 | $2,100 | $1.24 | 3d | 1 | 0.67mi |
| 1483 Mirabella Cir Davenport, FL | 3.0 | 2.5 | 1501 | $1,850 | $1.23 | 14d | 1 | 0.67mi |
| 1027 Papaya Cir Davenport, FL | 4.0 | 2.0 | 1627 | $2,500 | $1.54 | 23d | 1 | 0.67mi |
| 1623 Fan Palm Dr Davenport, FL | 3.0 | 2.5 | 1451 | $1,950 | $1.34 | 3d | 1 | 0.68mi |
| 1316 Mirabella Cir Davenport, FL | 3.0 | 2.5 | 1489 | $2,050 | $1.38 | 23d | 1 | 0.70mi |
| 1460 Mirabella Cir Davenport, FL | 3.0 | 2.5 | 1505 | $1,895 | $1.26 | 14d | 1 | 0.70mi |
| 1136 Papaya Cir Davenport, FL | 4.0 | 2.0 | 1627 | $2,450 | $1.51 | 3d | 1 | 0.70mi |
| 1136 Papaya Cir Unit 1136 Davenport, FL | 4.0 | 2.0 | 1627 | $2,450 | $1.51 | 14d | 1 | 0.70mi |
| 740 Brunello Dr Unit 1018164P Davenport, FL | 4.0 | 3.5 | 1754 | $2,806 | $1.60 | 19d | 1 | 0.71mi |
| 1052 Papaya Cir Davenport, FL | 4.0 | 2.0 | 1637 | $2,450 | $1.50 | 23d | 1 | 0.71mi |
| 3929 Calabria Ave Unit 1018213P Davenport, FL | 4.0 | 3.0 | 1851 | $2,101 | $1.14 | 14d | 1 | 0.81mi |
| 3306 Calabria Ave Unit 1261194P Davenport, FL | 4.0 | 3.5 | 1754 | $4,551 | $2.59 | 3d | 1 | 0.82mi |
| 761 Caribbean Dr Davenport, FL | 3.0 | 2.0 | 1400 | $1,700 | $1.21 | 3d | 1 | 0.87mi |
Listing history 5 events
-
2026-06-18days on market $99,999 Active 5 DOM
-
2026-06-17days on market $99,999 Active 4 DOM
-
2026-06-16days on market $99,999 Active 3 DOM
-
2026-06-15remarks 695-char remark
-
2026-06-15$99,999 Active 2 DOM
ⓘ Source: listings_history table (triggers on properties + properties_extension) + one-shot
backfill from property_details.listing_events for pre-trigger history.
Nearby sold comps map
Loading sold comps map…
Walkable amenities ~0.75 mi
Loading nearby amenities…
Taxation est. · year 1
- Rental income
- $27,615
- − Mortgage interest
- −$5,601
- − Property taxes
- −$1,500
- − Insurance
- −$500
- − Repairs & maintenance
- −$2,209
- − Management
- −$2,209
- − Depreciation
- −$2,909
- Taxable income
- $12,686
- Est. tax owed @ 24.0%
- −$3,045
- After-tax cash flow
- $10,479/yr
For passive investors: Depreciation is non-cash, so a rental often shows a tax loss while cash-flowing — sheltering income. Rental losses are passive: they offset passive income freely, and up to $25,000/yr can offset ordinary (W-2) income if you actively participate and your MAGI is under $100k (phasing out to $0 by $150k); unused losses carry forward. On sale, claimed depreciation is recaptured at up to 25%, and gains may owe capital-gains tax (a 1031 exchange can defer both). Figures are a year-1 estimate at your 24.0% rate — not tax advice; consult a CPA.
Condition & rehab AI · 1 photo
This property is in good condition with recent updates and a well-maintained exterior. A fresh coat of paint on the exterior walls would significantly enhance its curb appeal and add value.
Value-add opportunities
- Resale Paint exterior walls — Enhances curb appeal and can add value
- Rental Clean and maintain gutters — Keeps property in good condition and prevents water damage
Renovation cost estimate screening
Value-add ROI direction
- Resale Paint exterior walls — Enhances curb appeal and can add value ↑
- Rental Clean and maintain gutters — Keeps property in good condition and prevents water damage ↑
ⓘ Cost ranges are severity-bucket heuristics (US national rule-of-thumb). Get contractor quotes + a written scope before underwriting a rehab budget.
Schools (NCES district)
- District
- Polk
- NCES district ID
- 1201590
- Math proficiency
- 39% ▼ -11.00%
- Reading proficiency
- 43% ▼ -4.00%
- Median HH income
- $43,979
- Composite
- 34.74/100
- National rank
- #5132
- State rank
- #62 of 73 in FL
Livability — Four Corners
- Score
- 69/100
- State rank
- #453
- US rank
- #8218
Category grades
Schools grade is shown separately in the Schools card above.
Census & demographics
- County
- Polk County · 740,051 people
- City population
- 27,422
- Metro
- Lakeland-Winter Haven, FL
- Population (ZIP)
- 30,159
- Household income
- $70,982
- Rent vs Own
- Severe rent burden
- 926.0
Population outlook (Polk County) Hauer SSP2
- Today (2025)
- 752,975 people
- By 2030
- 804,621 · +6.9%
- By 2040
- 906,117 · +20.3%
- By 2050
- 1,000,476 · +32.9%
- By 2075
- 1,197,520 · +59.0%
- By 2100
- 1,271,518 · +68.9%
Race, ethnicity, and origin ACS 2023
- Neighborhood character
- Diverse neighborhood (Simpson 0.61)
- Race & ethnicity
- White 45% Hispanic / Latino 43% Two or more races 12% Black 5% Asian 2%
- Hispanic origin (detail)
- Mexican 2% Puerto Rican 21% Cuban 2% Dominican 2%
- Common ancestry
- Romanian 2% Lithuanian 2% Serbian 1%
- Foreign-born
- 16% · Canada, Jamaica, China
- Languages at home
- 61% English-only · Spanish 34% Other Indo-European 1% French/Haitian/Cajun 1%
Political lean MEDSL · Polk
- 2024 margin
- Strong R (+20.7) · D 39.2% · R 59.9%
- 2008→2024 swing
- -14.6pp toward R · 2008: -6.1pp · 2024: -20.7pp
- All cycles
- 2024: R+20.7 2020: R+14.4 2016: R+14.1 2012: R+6.8 2008: R+6.1
Not yet ingested
- Civics
- —
Market trends
- HPI YoY
- ▼ -0.61%
- Current HPI
- 236.2905
- Rent YoY
- ▼ -2.69%
- Metro
- Lakeland-Winter Haven, FL
- State GDP YoY
- ▲ 3.28%
- F500 in state
- 36
Industry mix (Fortune 500 HQ in FL)
| Industry | F500 HQs | Revenue |
|---|---|---|
| Industrial Technology | 2 | $29B |
|
||
| Insurance | 2 | $17B |
|
||
| Retail | 1 | $60B |
|
||
| Technology Distribution | 1 | $58B |
|
||
| Homebuilding | 1 | $35B |
|
||
| Technology Manufacturing | 1 | $35B |
|
||
Price history
1 event — show timeline
- 2026-06-14 Listed $99,999 FSBO.com
Cash-flow waterfall
monthlySold comps — $/sqft
last 12 mo · ≤1 miLoading sold comps…