 Multi-family
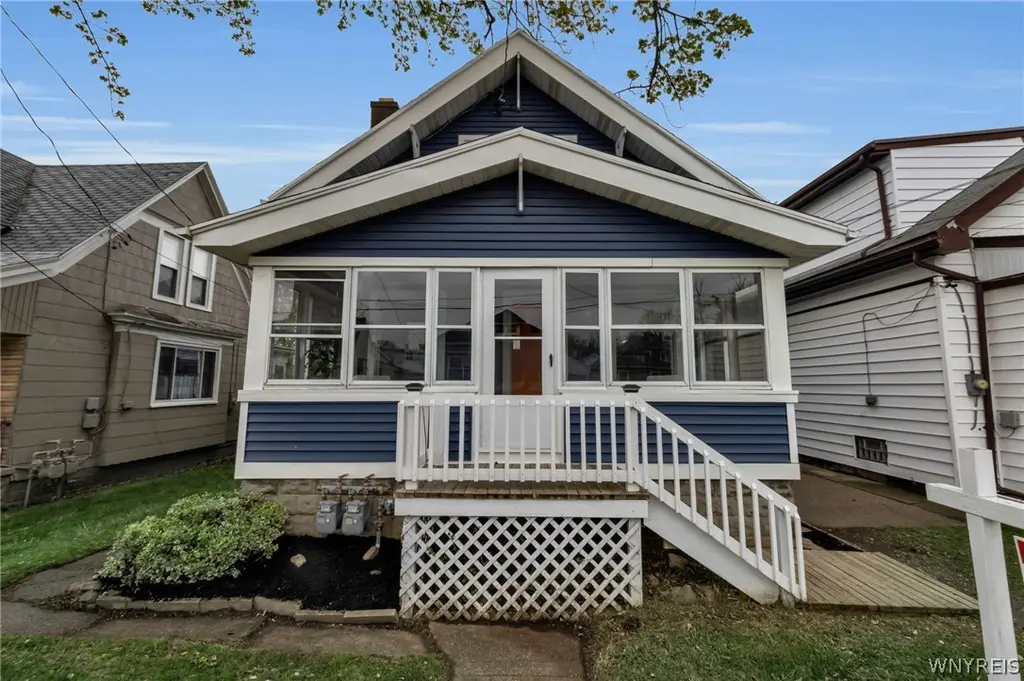
69 Madison Ave · Blasdell, NY
Flood risk 1/10 · Minimal
- FEMA flood zone
- X (unshaded)
- Chance of flooding over 30 yrs
- 0.0%
- Est. flood insurance / yr
- $473 – $860
Fire risk 1/10 · Minimal
- Est. fire insurance / yr
- $691 – $1,283
Heat risk 3/10 · Minor
- Hot days now (above 92°F)
- 7 days/yr
- Hot days in 30 yrs
- 16 days/yr
Wind risk 1/10 · Minimal
- Chance of severe wind over 30 yrs
- —
Air-quality risk 4/10 · Minor
- Unhealthy air days now
- 3 days/yr
- Unhealthy air days in 30 yrs
- 8 days/yr
Risk factors via First Street. Map © Google.
Why this score? — see what drove the B grade
The composite is a weighted blend of 9 inputs, each scored 0–100. Each bar is that input's sub-score; the figure is the points it added to the 100-point composite (weight × sub-score).
- Cash flow +25.8/30.0
- ARV discount +15.0/15.0
- DSCR +8.6/10.0
- 1% rule +7.9/10.0
- Schools +4.7/10.0
- Livability +3.3/5.0
- Rent growth +2.5/5.0
- Condition / age +2.5/5.0
- Appreciation +0.0/10.0
$199,900
🖨 Deal sheet (PDF) 📄 Offer letter ✓ Due diligence
Multi-family units
County records classify this as Multi-Family (2-4 Unit). Listing-text estimate: 1 unit. estimate disagrees with records
Listing remarks
Updated and ready to rent. Live in the charming village of Blasdell. While you occupy one unit your tenants can help off set your mortgage. 2nd unit is very private. Both units are currently vacant. There are 3 bedrooms in first unit. There are 2 bedrooms in second unit. Roof and siding 2025, Electrical Panel 2026, furnace 2024, hot water tanks, 2024 Seller will begin to review any offers, Tuesday May 12 starting at noon
Key facts
- 4,025 sq ft lot
- Garage
- Built 1938
Property features AI
Finance
- Financial info: Operating expense details and rent/owner responsibilities referenced in remarks
Exterior
- Parking: Paved parking with two or more spaces; Garage present (approximately 1.5-car)
- Utilities: Electricity connected; Public water connected; Sewer connected
- Home design: 2-story building; Existing structure
- Construction: Composite siding; Asphalt shingle roof; Block foundation; Resale condition
- Exterior features: Rectangular lot near public transit; Lot dimensions approximately 35 x 115
Interior
- Kitchen: No specific kitchen appliance list provided
- Bedrooms: Multifamily property with 2 total units
- Flooring: Laminate; Vinyl; Varies by area
- Bathrooms: 2 full bathrooms (total in property)
- Heating & cooling: Gas heating; Forced air; Wall furnace
- Interior features: Full basement; Fireplace; Laminate, vinyl, and varied flooring throughout; Gas water heater
- Laundry & utility: Separate gas and electric meters for each unit
Neighborhood map
What this means for you Summary
Snapshot
- This is a 5-bed/2.0-bath multifamily listed at $200k.
Deal economics
- At list price, monthly cash flow is $483 ($6k/yr) — positive.
- The deal already cash-flows at list — no discount required.
- Meets the 1% rule at list price ($3k rent vs $200k).
- Cap rate 9.2% vs local median 4.5% in Blasdell — top-decile yield for the area; either an underpriced asset or a hidden risk that comps aren't pricing in. Stress-test before assuming the spread holds.
Location & tenants
- Location reads 66/100 on livability (#643 in NY) — a middle-class / working-renter tenant base. Strengths: cost of living A+, housing A+, health & safety A+; Watch: employment D, schools D-, amenities F.
- Frontier Central School District (suburban): math 54% / reading 55% proficiency, ranked #301 of 590 in NY (top 51%) — acceptable for families but not a draw, mixed tenant base, ~2y average lease; only 20% free/reduced lunch — higher-income household profile.
- Market conditions: 44 active listings in the ZIP; 1,244 units permitted in Erie County in 2024 (563 in 5+ unit buildings).
Forward outlook
- Local home prices are declining (-3.0%/yr); year-one equity from $1k of loan paydown is wiped out by about $6k of value loss. Plan a longer hold.
Negotiation context
- Only 11 days on market — expect competitive offers; lowballing is unlikely to land.
- Current owner paid $78k; list at $200k implies a 156% gain — meaningful room to come down on a strong offer.
Risks & watch-outs
- Watch-outs: built in 1938 — expect roof / HVAC / electrical / plumbing capex.
Questions for the listing agent
- Built in 1938 — when were the roof, HVAC, electrical panel, plumbing, and water heater last replaced?
- Is there a deadline driving the sale (1031 exchange, divorce, estate, relocation)? That informs how much negotiation room exists.
- Schools are D-rated, which usually means shorter tenancies and higher turnover. Who's the typical renter profile here, and what's been the actual vacancy rate?
- What's the average days-on-market for RENTAL listings here right now (not sales)? A rising rental-DOM trend means longer vacancies and softer asking-rent achievability than the comps imply.
- What's the recent tenant-quality profile in this submarket — average credit score on applications, eviction rate, late-payment / NSF rate, and stable-employment percentage? A property-management company in the area should have these aggregated.
- How much new apartment / multifamily construction is in the pipeline within 1–3 miles? Heavy new supply (>2% of stock underway) typically softens rents 12–24 months out; light construction supports rent growth.
Investment metrics
- 1% rule
- 1.29% ✓
- Cap rate
- 9.19%
- Cash-on-cash
- 10.36%
- DSCR
- 1.46
- GRM
- 6.5
CMA / ARV
- ARV (median comp)
- $380,974
- List price
- $199,900
- Delta
- -47.53%
- Verdict
- UNDERPRICED
- Comps
- 19 within 1.0 mi
Show comp detail 2 sales within ~0.75 mi
| Address | Dist | Beds/Ba | Sqft | Sold | Price | $/sf | Match |
|---|---|---|---|---|---|---|---|
| 24 Commercial St | 0.26mi | 4/2.0 (-1) | 1,664 (+1%) | 1mo | $230,000 | $138 | 80 |
| 31 Orchard Ave | 0.27mi | 4/2.0 (-1) | 1,806 (+10%) | 19mo | $200,850 | $111 | 50 |
Match score weights: distance 35% · size 25% · config 20% · recency 20%. Top-matched comps best support the ARV.
Projected returns pro-forma
-3.0% appreciation · 3.0% rent growth · sell at horizon
- IRR
- -0.7%
- Equity multiple
- 0.97×
- Total profit
- $-1,468
- Equity at exit
- $29,806
- IRR
- 9.0%
- Equity multiple
- 1.70×
- Total profit
- $38,929
- Equity at exit
- $17,284
Cash invested: $55,972 (down + closing). Projections, not guarantees.
Landlord ↔ Tenant lean methodology
- Overall (STATE)
- 15 Strongly Tenant-Friendly
- State New York
- 15 Strongly Tenant-Friendly · D+10
- County
- — inherits STATE
- City
- — inherits STATE
ZIP-level market 14219
- Home prices YoY
- -19.4%
- Active inventory
- 44
- Price-to-rent
- 12.7×
Monthly cashflow live
- Estimated rent
- $2,569 medium interval (Pro) →
- Mortgage (P&I)
- −$1,048
- Tax from tax record
- −$415 /mo · $4,975/yr
- Insurance
- −$83
- HOA
- −$0
- Vacancy / Maint / Mgmt
- −$539
- Net cashflow
- $483
Break-even live
Sensitivity live
| Price | -10% $596 | -5% $540 | +0% $483 | +5% $427 | +10% $370 |
|---|---|---|---|---|---|
| Rent | -10% $280 | -5% $382 | +0% $483 | +5% $585 | +10% $686 |
| Rate | -1.0pp $584 | -0.5pp $534 | base $483 | +0.5pp $432 | +1.0pp $379 |
2-unit breakdown (identical units grouped — click to expand)
| Units | Beds | Baths | Est. rent |
|---|---|---|---|
| 1× unit | 3 | 1 | $1,311 |
| 1× unit | 2 | 1 | $1,258 |
| Total (2 units) | $2,569 | ||
UW: 25.0% down · 7.5% · 30yr · 1.5% tax · 5.0% vac · 8.0% maint · 8.0% mgmt
Financing live
Cash to close
- Down payment
- $49,975
- Closing costs
- $5,997
- Reserves months
- —
- Total cash needed
- —
Loan-product check · same deal, 3 products live
Conventional
25% down · 7.5% · 30yr
- Down + closing
- —
- Monthly P&I
- —
- Monthly cashflow
- —
- DSCR
- —
- Eligible?
- —
Personal DTI + credit; lowest rate.
DSCR
20% down · 8.5% · 30yr
- Down + closing
- —
- Monthly P&I
- —
- Monthly cashflow
- —
- DSCR
- —
- Eligible?
- —
No personal income docs; deal must DSCR.
Hard money
10% down · 12.0% · 12mo
- Down + closing
- —
- Monthly P&I
- —
- Monthly cashflow
- —
- DSCR
- —
- Eligible?
- —
Short-term bridge; refi at stabilization.
Listing history 3 events
-
2026-05-13status Pending 425-char remark
-
2026-05-02$199,900 Active 425-char remark
-
1993-11-09soldstatus $78,100
ⓘ Source: listings_history table (triggers on properties + properties_extension) + one-shot
backfill from property_details.listing_events for pre-trigger history.
Tax reassessment forecast NY · Partial reset (capped growth)
- Current annual tax
- $4,975 · $415/mo
- Projected year-2 tax
- $4,975 · $415/mo
- Expected delta
- $0/yr ($0/mo · 0.0%)
ⓘ Screening estimate from a state-policy table — verify with the county assessor before closing.
Climate risk First Street
- Flood 1/10 Low FEMA zone X (unshaded) · 0% chance over 30 yrs
- Wildfire 1/10 Low
- Heat 3/10 Moderate 7 d/yr ≥92°F today · 16 d/yr by 30 yrs out
- Wind 1/10 Low
- Air quality 4/10 Moderate 3 unhealthy d/yr today · 8 by 30 yrs out
Nearby sold comps map
Loading sold comps map…
Walkable amenities ~0.75 mi
Loading nearby amenities…
Taxation est. · year 1
- Rental income
- $30,828
- − Mortgage interest
- −$11,198
- − Property taxes
- −$4,975
- − Insurance
- −$1,000
- − Repairs & maintenance
- −$2,466
- − Management
- −$2,466
- − Depreciation
- −$5,815
- Taxable income
- $2,908
- Est. tax owed @ 24.0%
- −$698
- After-tax cash flow
- $5,102/yr
For passive investors: Depreciation is non-cash, so a rental often shows a tax loss while cash-flowing — sheltering income. Rental losses are passive: they offset passive income freely, and up to $25,000/yr can offset ordinary (W-2) income if you actively participate and your MAGI is under $100k (phasing out to $0 by $150k); unused losses carry forward. On sale, claimed depreciation is recaptured at up to 25%, and gains may owe capital-gains tax (a 1031 exchange can defer both). Figures are a year-1 estimate at your 24.0% rate — not tax advice; consult a CPA.
Schools (NCES district)
- District
- Frontier Central School District
- NCES district ID
- 3611670
- Math proficiency
- 54% ▼ -16.00%
- Reading proficiency
- 55% ▼ -10.00%
- Median HH income
- $58,807
- Composite
- 47.36/100
- National rank
- #2291
- State rank
- #301 of 590 in NY
Livability — Blasdell
- Score
- 66/100
- State rank
- #643
- US rank
- #12059
Category grades
Schools grade is shown separately in the Schools card above.
Census & demographics
- Census place
- Blasdell, NY
- Population (ZIP)
- 10,894
Population outlook (Erie County) Hauer SSP2
- Today (2025)
- 933,037 people
- By 2030
- 935,181 · +0.2%
- By 2040
- 928,531 · -0.5%
- By 2050
- 905,725 · -2.9%
- By 2075
- 834,037 · -10.6%
- By 2100
- 708,033 · -24.1%
Race, ethnicity, and origin ACS 2023
- Neighborhood character
- Predominantly White (87%)
- Race & ethnicity
- White 87% Two or more races 5% Hispanic / Latino 5% Asian 2% Black 2%
- Common ancestry
- Romanian 21% Slovak 5% Lithuanian 2%
- Foreign-born
- 3% · Canada
- Languages at home
- 93% English-only · Russian/Polish/Slavic 3% Other Indo-European 2% Spanish 1%
Political lean MEDSL · Erie
- 2024 margin
- Lean D (+9.7) · D 54.8% · R 45.2%
- 2008→2024 swing
- -7.9pp toward R · 2008: 17.5pp · 2024: 9.7pp
- All cycles
- 2024: D+9.7 2020: D+14.7 2016: D+4.8 2012: D+15.6 2008: D+17.5
Not yet ingested
- Civics
- —
Market trends
- HPI YoY
- ▼ -80.33%
- Current HPI
- 332.7314
- Rent YoY
- —
- Metro
- —
- State GDP YoY
- ▲ 2.60%
- F500 in state
- 92
Industry mix (Fortune 500 HQ in NY)
| Industry | F500 HQs | Revenue |
|---|---|---|
| Financial Services | 10 | $950B |
|
||
| Consumer Goods | 9 | $162B |
|
||
| Insurance | 4 | $225B |
|
||
| Telecommunications | 2 | $144B |
|
||
| Pharmaceuticals | 2 | $112B |
|
||
| Media / Entertainment | 2 | $69B |
|
||
Price history
+156.0% since first listed3 events — show timeline
- 2026-05-13 Pending — WNYREIS
- 2026-05-02 Listed $199,900 WNYREIS
- 1993-11-09 Sold (Public Records) $78,100 Public Records
Property tax history
+2.1%/yrLatest (2025): $4,975 · +2.0% YoY. Source: county tax records.
Cash-flow waterfall
monthlySold comps — $/sqft
last 12 mo · ≤1 miLoading sold comps…