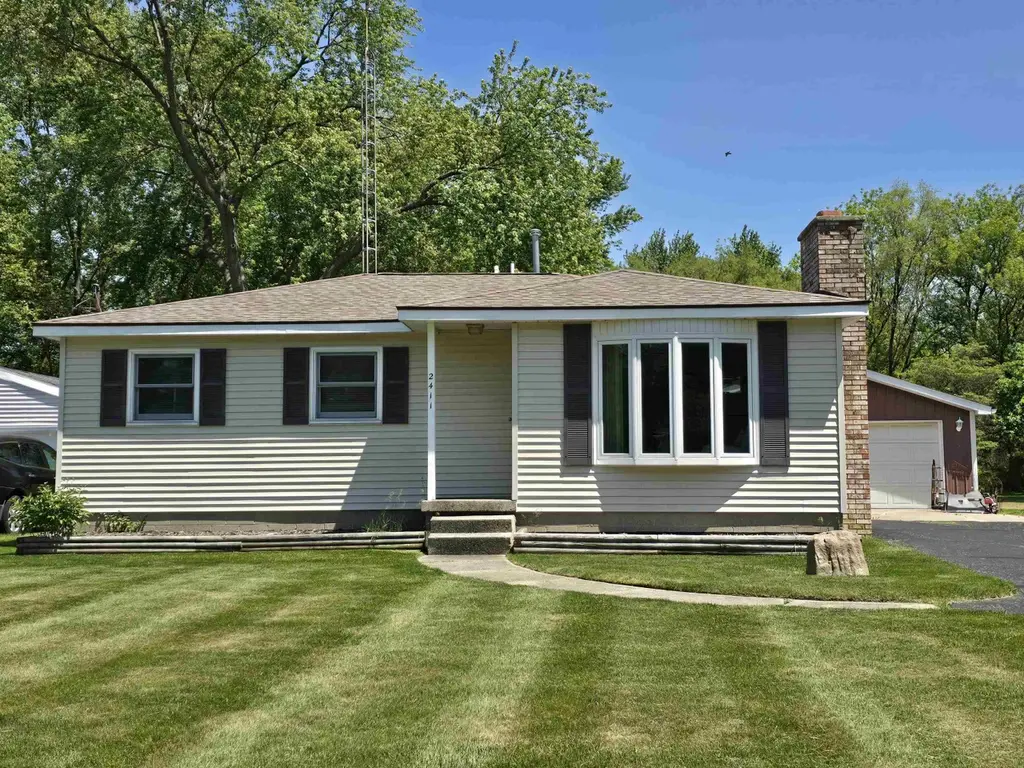
2411 Cheryl Ann Dr · Burton, MI
Flood risk 1/10 · Minimal
- FEMA flood zone
- X (unshaded)
- Chance of flooding over 30 yrs
- 0.0%
- Est. flood insurance / yr
- $507 – $1,088
Fire risk 1/10 · Minimal
- Est. fire insurance / yr
- $784 – $1,456
Heat risk 2/10 · Minimal
- Hot days now (above 96°F)
- 7 days/yr
- Hot days in 30 yrs
- 15 days/yr
Wind risk 2/10 · Minimal
- Chance of severe wind over 30 yrs
- —
Air-quality risk 3/10 · Minor
- Unhealthy air days now
- 2 days/yr
- Unhealthy air days in 30 yrs
- 3 days/yr
Risk factors via First Street. Map © Google.
Why this score? — see what drove the C grade
The composite is a weighted blend of 9 inputs, each scored 0–100. Each bar is that input's sub-score; the figure is the points it added to the 100-point composite (weight × sub-score).
- Cash flow +24.0/30.0
- DSCR +7.7/10.0
- ARV discount +6.8/15.0
- 1% rule +5.7/10.0
- Schools +4.1/10.0
- Livability +3.1/5.0
- Rent growth +2.5/5.0
- Condition / age +2.5/5.0
- Appreciation +0.0/10.0
$155,900
🖨 Deal sheet (PDF) 📄 Offer letter ✓ Due diligence
Listing remarks MLS
Welcome home to this well-maintained 3 bedroom, 1 bath ranch offering comfortable single-level living and plenty of indoor and outdoor space. Relax and entertain on the beautiful covered deck overlooking the large fenced-in backyard — perfect for summer gatherings, pets, kids, or peaceful evenings outdoors. The extra-large 2-car garage provides plenty of room for vehicles, storage, tools, or a workshop area. This home combines convenience, functionality, and cozy charm, making it ideal for first-time buyers, downsizers, or anyone looking for easy ranch-style living. Hardwood floors underneath the carpet. Newer roof and hot water heater. Davison School district.
Key facts
- Covered deck
- Newer roof
- Hot water heater
Tags
Property features AI
Finance
- HOA & community: Homeowners association present
Exterior
- Parking: Detached garage with direct access and garage door opener (2-car)
- Utilities: Private well water; Public sewer
- Home design: Single-family residence; One story
- Construction: Vinyl siding
- Exterior features: Deck; Fenced yard; Shed(s)
Interior
- Kitchen: Oven; Range; Disposal
- Bedrooms: Total rooms: 6; Basement type: Crawl space
- Bathrooms: 1 full bathroom
- Heating & cooling: Forced-air heating (natural gas); Central air; Ceiling fan(s)
- Interior features: Eat-in kitchen; High-speed internet; Bay window(s); Gas fireplace in living room
- Laundry & utility: Washer; Dryer; Gas water heater
Neighborhood map
What this means for you Summary
Snapshot
- This is a 3-bed/1.0-bath single-family listed at $156k.
Deal economics
- At list price, monthly cash flow is $307 ($4k/yr) — positive.
- The deal already cash-flows at list — no discount required.
- Meets the 1% rule at list price ($2k rent vs $156k).
- Cap rate 8.7% vs local median 3.8% in Burton — top-decile yield for the area; either an underpriced asset or a hidden risk that comps aren't pricing in. Stress-test before assuming the spread holds.
Location & tenants
- Location reads 61/100 on livability (#555 in MI) — a middle-class / working-renter tenant base. Strengths: cost of living A+, housing A+; Watch: employment D, schools F, crime F.
- Davison Community Schools (suburban): math 40% / reading 57% proficiency, ranked #117 of 540 in MI (top 22%) — families likely to look elsewhere, expect single-tenant / working-renter base with shorter leases.
- Market conditions: 108 active listings in the ZIP; 2 comparable units currently listed for rent nearby; 419 units permitted in Genesee County in 2024 (68 in 5+ unit buildings).
Forward outlook
- Local home prices are declining (-3.0%/yr); year-one equity from $1k of loan paydown is wiped out by about $5k of value loss. Plan a longer hold.
- Genesee County population projected at -27% by 2050 — secular population decline; favor cash flow + early exit over multi-decade hold.
Negotiation context
- Only 4 days on market — expect competitive offers; lowballing is unlikely to land.
- 2 sale attempts with the ask held roughly flat each time — persistent listings suggest the price (not the market) is what's stuck; bring a comps-based counter.
Questions for the listing agent
- Built in 1968 — when were the roof, HVAC, electrical panel, plumbing, and water heater last replaced?
- Is there a deadline driving the sale (1031 exchange, divorce, estate, relocation)? That informs how much negotiation room exists.
- Schools are F-rated, which usually means shorter tenancies and higher turnover. Who's the typical renter profile here, and what's been the actual vacancy rate?
- Crime grade is F in this area — have there been break-ins, vandalism, or insurance claims at this property in the last 3 years? What carrier currently insures it and at what premium?
- What's the average days-on-market for RENTAL listings here right now (not sales)? A rising rental-DOM trend means longer vacancies and softer asking-rent achievability than the comps imply.
- What's the recent tenant-quality profile in this submarket — average credit score on applications, eviction rate, late-payment / NSF rate, and stable-employment percentage? A property-management company in the area should have these aggregated.
- How much new for-sale + rental construction is in the pipeline within 1–3 miles? Heavy new supply typically softens prices + rents 12–24 months out; constrained supply supports both.
Investment metrics
- 1% rule
- 1.07% ✓
- Cap rate
- 8.65%
- Cash-on-cash
- 8.43%
- DSCR
- 1.37
- GRM
- 7.8
CMA / ARV
- ARV (on-the-fly)
- $153,640
- Comps found
- 3
Show comp detail 3 sales within ~0.75 mi
| Address | Dist | Beds/Ba | Sqft | Sold | Price | $/sf | Match |
|---|---|---|---|---|---|---|---|
| 2507 Eugene St | 0.41mi | 2/1.0 (-1) | 896 (-3%) | 12mo | $150,000 | $167 | 61 |
| 2478 Eugene St | 0.36mi | 3/1.5 | 1,040 (+13%) | 4mo | $106,000 | $102 | 56 |
| 6175 Crabtree Ln | 0.61mi | 2/2.0 (-1) | 864 (-6%) | 2mo | $168,000 | $194 | 51 |
Match score weights: distance 35% · size 25% · config 20% · recency 20%. Top-matched comps best support the ARV.
Projected returns pro-forma
-3.0% appreciation · 3.0% rent growth · sell at horizon
- IRR
- -3.5%
- Equity multiple
- 0.87×
- Total profit
- $-5,753
- Equity at exit
- $23,245
- IRR
- 6.2%
- Equity multiple
- 1.46×
- Total profit
- $20,079
- Equity at exit
- $13,479
Cash invested: $43,652 (down + closing). Projections, not guarantees.
Landlord ↔ Tenant lean methodology
- Overall (STATE)
- 62 Landlord-Friendly
- State Michigan
- 62 Landlord-Friendly · EVEN
- County
- — inherits STATE
- City
- — inherits STATE
ZIP-level market 48519
- Home prices YoY
- -20.5%
- Active inventory
- 108
- Price-to-rent
- 7.8×
Monthly cashflow live
- Estimated rent
- $1,675 medium interval (Pro) →
- Mortgage (P&I)
- −$818
- Tax from tax record
- −$134 /mo · $1,611/yr
- Insurance
- −$65
- HOA
- −$0
- Vacancy / Maint / Mgmt
- −$352
- Net cashflow
- $307
Break-even live
Sensitivity live
| Price | -10% $395 | -5% $351 | +0% $307 | +5% $262 | +10% $218 |
|---|---|---|---|---|---|
| Rent | -10% $174 | -5% $240 | +0% $307 | +5% $373 | +10% $439 |
| Rate | -1.0pp $385 | -0.5pp $346 | base $307 | +0.5pp $266 | +1.0pp $225 |
UW: 25.0% down · 7.5% · 30yr · 1.5% tax · 5.0% vac · 8.0% maint · 8.0% mgmt
Financing live
Cash to close
- Down payment
- $38,975
- Closing costs
- $4,677
- Reserves months
- —
- Total cash needed
- —
Loan-product check · same deal, 3 products live
Conventional
25% down · 7.5% · 30yr
- Down + closing
- —
- Monthly P&I
- —
- Monthly cashflow
- —
- DSCR
- —
- Eligible?
- —
Personal DTI + credit; lowest rate.
DSCR
20% down · 8.5% · 30yr
- Down + closing
- —
- Monthly P&I
- —
- Monthly cashflow
- —
- DSCR
- —
- Eligible?
- —
No personal income docs; deal must DSCR.
Hard money
10% down · 12.0% · 12mo
- Down + closing
- —
- Monthly P&I
- —
- Monthly cashflow
- —
- DSCR
- —
- Eligible?
- —
Short-term bridge; refi at stabilization.
Rent comps 2 comps
| Address | Beds | Baths | Sqft | Rent | $/sqft | DOM | Units | Dist |
|---|---|---|---|---|---|---|---|---|
| 1442 Lasalle Ave Burton, MI | 3.0 | 1.5 | 942 | $1,675 | $1.78 | 45d | 1 | 0.90mi |
| 5403 E Bristol Rd Burton, MI | 3.0 | 1.0 | 1050 | $1,675 | $1.60 | 45d | 1 | 1.42mi |
Listing history 6 events
-
2026-06-03status $155,900 Pending 4 DOM
-
2026-06-02days on market $155,900 Active 4 DOM
-
2026-06-01days on market $155,900 Active 3 DOM
-
2026-05-31days on market $155,900 Active 2 DOM
-
2026-05-30remarks 669-char remark
-
2026-05-30$155,900 Active 1 DOM
ⓘ Source: listings_history table (triggers on properties + properties_extension) + one-shot
backfill from property_details.listing_events for pre-trigger history.
Tax reassessment forecast MI · Partial reset (capped growth)
- Current annual tax
- $1,611 · $134/mo
- Projected year-2 tax
- $2,006 · $167/mo
- Expected delta
- +$395/yr (+$33/mo · 24.5%)
ⓘ Screening estimate from a state-policy table — verify with the county assessor before closing.
Climate risk First Street
- Flood 1/10 Low FEMA zone X (unshaded) · 0% chance over 30 yrs
- Wildfire 1/10 Low
- Heat 2/10 Low 7 d/yr ≥96°F today · 15 d/yr by 30 yrs out
- Wind 2/10 Low
- Air quality 3/10 Moderate 2 unhealthy d/yr today · 3 by 30 yrs out
Nearby sold comps map
Loading sold comps map…
Walkable amenities ~0.75 mi
Loading nearby amenities…
Taxation est. · year 1
- Rental income
- $20,100
- − Mortgage interest
- −$8,733
- − Property taxes
- −$1,611
- − Insurance
- −$780
- − Repairs & maintenance
- −$1,608
- − Management
- −$1,608
- − Depreciation
- −$4,535
- Taxable income
- $1,226
- Est. tax owed @ 24.0%
- −$294
- After-tax cash flow
- $3,384/yr
For passive investors: Depreciation is non-cash, so a rental often shows a tax loss while cash-flowing — sheltering income. Rental losses are passive: they offset passive income freely, and up to $25,000/yr can offset ordinary (W-2) income if you actively participate and your MAGI is under $100k (phasing out to $0 by $150k); unused losses carry forward. On sale, claimed depreciation is recaptured at up to 25%, and gains may owe capital-gains tax (a 1031 exchange can defer both). Figures are a year-1 estimate at your 24.0% rate — not tax advice; consult a CPA.
Schools (NCES district)
- District
- Davison Community Schools
- NCES district ID
- 2611430
- Math proficiency
- 40% ▼ -8.00%
- Reading proficiency
- 57% ▼ -5.00%
- Median HH income
- $49,102
- Composite
- 41.39/100
- National rank
- #3479
- State rank
- #117 of 540 in MI
Livability — Burton
- Score
- 61/100
- State rank
- #555
- US rank
- #17380
Category grades
Schools grade is shown separately in the Schools card above.
Census & demographics
- Census place
- Burton, MI
- City population
- 26,014
- Population (ZIP)
- 7,523
Population outlook (Genesee County) Hauer SSP2
- Today (2025)
- 381,312 people
- By 2030
- 362,731 · -4.9%
- By 2040
- 321,550 · -15.7%
- By 2050
- 279,212 · -26.8%
- By 2075
- 193,336 · -49.3%
- By 2100
- 128,118 · -66.4%
Race, ethnicity, and origin ACS 2023
- Neighborhood character
- Predominantly White (76%)
- Race & ethnicity
- White 76% Black 14% Hispanic / Latino 5% Two or more races 5%
- Hispanic origin (detail)
- Mexican 4%
- Common ancestry
- Romanian 6% Lithuanian 3% Slovak 2%
- Foreign-born
- 1%
- Languages at home
- 97% English-only · Spanish 2%
Political lean MEDSL · Genesee
- 2024 margin
- Toss-up / Even · D 51.4% · R 47.2% · Other 1.4%
- 2008→2024 swing
- -28.3pp toward R · 2008: 32.5pp · 2024: 4.2pp
- All cycles
- 2024: D+4.2 2020: D+9.3 2016: D+9.5 2012: D+28.2 2008: D+32.5
Not yet ingested
- Civics
- —
Market trends
- HPI YoY
- ▼ -65.66%
- Current HPI
- 255.0753
- Rent YoY
- —
- Metro
- —
- State GDP YoY
- ▲ 1.37%
- F500 in state
- 28
Industry mix (Fortune 500 HQ in MI)
| Industry | F500 HQs | Revenue |
|---|---|---|
| Automotive Parts | 3 | $48B |
|
||
| Automotive | 2 | $372B |
|
||
| Chemicals | 1 | $45B |
|
||
| Automotive Retail | 1 | $29B |
|
||
| Healthcare / Medical Devices | 1 | $23B |
|
||
| Automotive Technology | 1 | $20B |
|
||
Price history
+0.0% since first listed2 events — show timeline
- 2026-05-29 Listed $155,900 REALCOMP
- 2026-05-29 Listed $155,900 MiRealSource-MiMLS
Property tax history
+2.9%/yrLatest (2025): $1,611 · +1.9% YoY. Source: county tax records.
Cash-flow waterfall
monthlySold comps — $/sqft
last 12 mo · ≤1 miLoading sold comps…